


Introduction
The complex environmental matrix of diverse agroecosystems offers phytophagous insects a wide array of host plants with variable degrees of suitability for development and reproduction. In this scenario, it is likely that different genotypes perform differently according to their intrinsic aptitudes and the characteristics of their host plants. Ecotypes associated with particular host plant species have been reported in many phytophagous arthropods, leading eventually to the formation of new species living in sympatry (Feder et al., Reference Feder, Berlocher, Opp, Mopper and Strauss1998; Berlocher & Feder, Reference Berlocher and Feder2002). Aphids are a very interesting group for studying the effect of host plants on population structure because of their polyphagy, host alternation and variations in their reproduction modes. Myzus persicae (Sulzer) (Hemiptera: Aphididae) and Acyrthosiphon pisum (Harris) (Hemiptera: Aphididae) are among the aphid species in which population differentiation and the ecological and genetic factors driving divergence between host-races have been most extensively investigated (Carroll & Boyd, Reference Carroll and Boyd1992; Via, Reference Via1999; Via et al., Reference Via, Bouck and Skillman2000; Via & Hawthorne, Reference Via and Hawthorne2002; Del Campo et al., Reference Del Campo, Via and Caillaud2003; Barker, Reference Barker2005; Frantz et al., Reference Frantz, Plantegenest, Mieuzet and Simon2006).
M. persicae is a ubiquitous and polyphagous aphid of great economic importance, frequently found in many agroecosystems in areas with a moderate climate (Blackman & Eastop, Reference Blackman and Eastop2000). The life cycle of M. persicae generally involves the alternation of several parthenogenetic generations in herbaceous plants with migration to the primary host for sexual reproduction. However, there are many variations in the general pattern of cyclical alternation of holocyclic morphs between primary and secondary hosts, for example: (1) obligate parthenogenetic morphs, which reproduce cyclically by parthenogenesis and lack the capacity to reproduce sexually, also known as anholocyclic; (2) morphs that reproduce by obligate parthenogenesis but produce males that migrate to the primary host, where they mate with the cyclical parthenogens (androcyclic); and (3) morphs with an intermediate kind of life cycle, with females reproducing continuously by parthenogenesis, but occasionally producing females that migrate to the primary host, where they originate females and males which mate to produce the overwintering eggs (Blackman, Reference Blackman1971, Reference Blackman1972). The abundance of morphs with different kinds of reproduction in a population depends greatly on the availability of the primary host and the severity of the climate (Margaritopoulos et al., Reference Margaritopoulos, Blackman, Tsitsipis and Sannino2003; Vorburger, Reference Vorburger2004; Blackman et al., Reference Blackman, Malarky, Margaritopoulos and Tsitsipis2007). This versatility in reproduction allows the species to display an abacus of strategies, profiting from the advantages of both sexual and asexual reproduction (Vorburger et al., Reference Vorburger, Sunnucks and Ward2003b). Interaction among genetic, environmental, climate and stochastic factors gives rise to a mosaic of possibilities that ultimately determine the structure of M. persicae populations in agroecosystems. A population of M. persicae in secondary hosts in summer generally consists of a mixture of clones, some of them migrating from the primary host, and others obligate parthenogenetic clones from the previous winter (Blackman et al., Reference Blackman, Malarky, Margaritopoulos and Tsitsipis2007).
A geographic genetic structure may result from restricted gene flow among local populations due to regional variations in environmental conditions (Vorburger et al., Reference Vorburger, Lancaster and Sunnucks2003a). However, other factors, such as demographic events associated with the plasticity of reproductive modes (Delmotte et al., Reference Delmotte, Leterme, Gauthier, Rispe and Simon2002; Guillemaud et al., Reference Guillemaud, Mieuzet and Simon2003; Blackman et al., Reference Blackman, Malarky, Margaritopoulos and Tsitsipis2007; Margaritopoulos et al., Reference Margaritopoulos, Malarky, Tsitsipis and Blackman2007a), host specialization (De Barro et al., Reference De Barro, Sherratt, Brookes, David and Maclean1995; Sunnucks et al., Reference Sunnucks, Barro, Lushai, Maclean and Hales1997) and the alternation between primary and secondary hosts (Sunnucks et al., Reference Sunnucks, Barro, Lushai, Maclean and Hales1997), may also influence differentiation in aphid populations. Host plant-related variations in the performance of different genotypes have been observed in M. persicae (Weber, Reference Weber1985, Reference Weber1986; Edwards, Reference Edwards2001; Vorburger et al., Reference Vorburger, Sunnucks and Ward2003b). Molecular and morphological studies have revealed that populations of M. persicae on Nicotiana tabacum L. (Solanaceae) are genetically and morphologically different from those on other host plants, and support the existence of a host race associated with tobacco (Blackman, Reference Blackman1987; Blackman & Spence, Reference Blackman and Spence1992; Margaritopoulos et al., Reference Margaritopoulos, Mamuris and Tsitsipis1998, Reference Margaritopoulos, Tsitsipis, Zintzaras and Blackman2000, Reference Margaritopoulos, Blackman, Tsitsipis and Sannino2003, Reference Margaritopoulos, Malarky, Tsitsipis and Blackman2007a, Reference Margaritopoulos, Shigehara, Takada and Blackman2007b; Zitoudi et al., Reference Zitoudi, Margaritopoulos, Mamuris and Tsitsipis2001; Blackman et al., Reference Blackman, Malarky, Margaritopoulos and Tsitsipis2007). Microsatellite or DNA short tandem repeats (STR) are codominant markers that have been successfully used to provide information about the population structure in aphids in relation to their life cycle, host, geographical distribution and dynamics (Sunnucks et al., Reference Sunnucks, Barro, Lushai, Maclean and Hales1997; Simon et al., Reference Simon, Baumann, Sunnucks, Hebert, Pierre, Le Gallic and Dedryver1999; Delmotte et al., Reference Delmotte, Leterme, Gauthier, Rispe and Simon2002; Guillemaud et al., Reference Guillemaud, Mieuzet and Simon2003; Vorburger et al., Reference Vorburger, Lancaster and Sunnucks2003a; Vorburger, Reference Vorburger2006; Blackman et al., Reference Blackman, Malarky, Margaritopoulos and Tsitsipis2007; Margaritopoulos et al., Reference Margaritopoulos, Malarky, Tsitsipis and Blackman2007a).
In agricultural areas of south-eastern Spain, agroecosystems are very diverse, with a great variety of crops intermingling with uncultivated land harbouring many wild plant species that are potential hosts for M. persicae (Sanchez et al., Reference Sanchez, La-Spina, Michelena, Lacasa and Hermoso de Mendoza2011). In the southern part of that region, the mild climate and the abundance of both the primary and secondary hosts enable M. persicae to reproduce continuously through parthenogenesis on herbaceous plants, or to engage in cyclical switching between the secondary and primary hosts. These favourable conditions allow M. persicae to overwinter on wild herbaceous plants, which serve as a source of aphids for temporal crops (e.g. pepper grown in greenhouses). In the northern part of the working area, winter temperatures frequently fall below 0 °C and the survival of aphids with anholocylic life cycles is expected to be lower than in the southern part (Blackman, Reference Blackman1974). The aim of this work was to determine the spatial and temporal genetic population structure of M. persicae in the diverse agroecosystems of Murcia province (south-eastern Spain) in relation to host plants and the climatic conditions of the area. We were also interested in comparing the population structure in temporal elements of the landscape, like pepper crops, versus permanently available resources, such as Prunus spp., and the herbaceous plants used as secondary hosts. For that purpose, we scored eight microsatellite loci in M. persicae collected from different host plant species in the province over a period of four years. These data provided information about genetic diversity, the population structure at spatial and temporal scales, and the colonization pattern of pepper greenhouses by M. persicae.
Materials and methods
Sampling of M. persicae
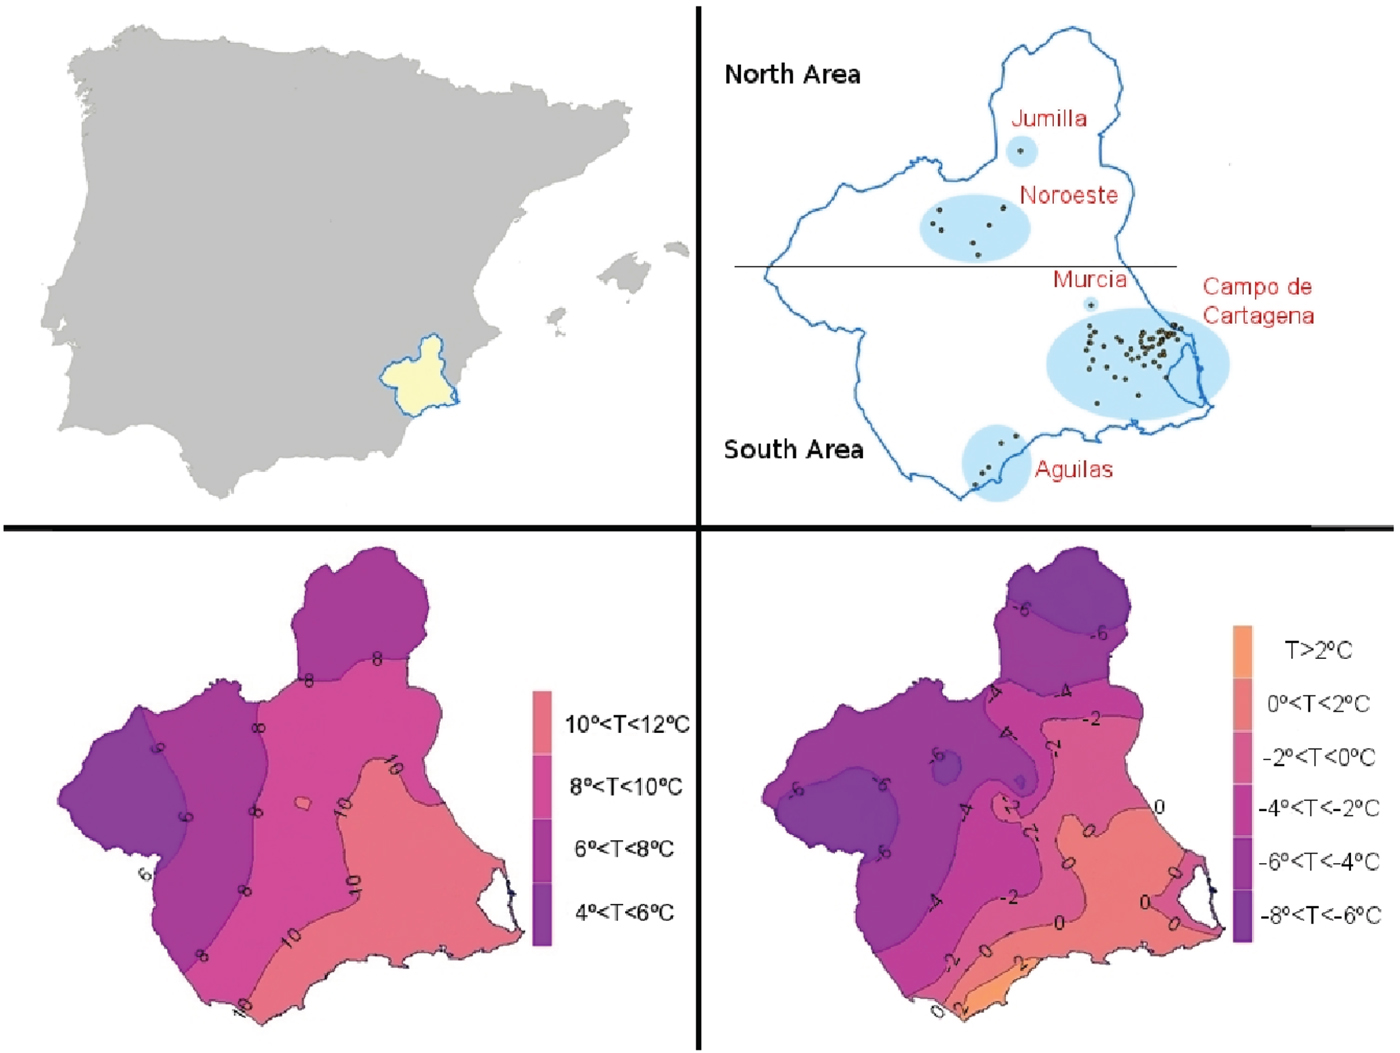
M. persicae was collected from 2005 to 2008 from several areas of the province of Murcia in south-eastern Spain (table 1, fig. 1). Samples were collected from 130 sampling sites in the Campo de Cartagena area, 20 sites from Aguilas, ten sites around Murcia city and 14 sites in the northern part of Murcia Province. The isocline maps for the average and minimum temperatures in January were produced by inverse distance weighting interpolation of the average temperature records from 2000 to 2010 obtained from 40 meteorological stations of SIAM, IMIDA (http://siam.imida.es) (fig. 1). The southern part of the province is within the warm temperate zone as described by Blackman (Reference Blackman1974), corresponding to the 10 °C isotherm, with average temperatures in January between 10 and 20 °C. The northern part of the province is within the medium temperate zone corresponding to the 0 °C isotherm, with average temperatures in January between 0 and 10 °C (fig. 1).
Location of the sampling areas (top) and maps with the isoclines of the average (bottom left) and minimum temperatures in January (bottom right).
Localities, area, year and month of sampling, hosts and number of individuals genotyped (N) in M. persicae samples.

The distance between sampling sites within the same area ranged from 0.5 to 10 km. M. persicae was collected from different secondary host plant species of Chenopodiaceae [Chenopodium album L., Chenopodium murale L., Beta vulgaris L. and Beta maritima L.], Convolvulaceae [Convolvulus arvensis L. and Convolvulus althaeoides L.], Brassicaceae [Sisymbrium irio L., Brassica oleracea L., Diplotaxis erucoides (L.), Eruca vesicaria (L.) Cav., Moricandia arvensis (L.) DC., Raphanus raphanistrum L. and Rapistrum rugosum (L.) Al], Malvaceae [Malva parviflora L.], Rosaceae [Prunus dulcis (Mill.) and Prunus persica (L.) Batsch] and Solanaceae [Capsicum annuum L. and Solanum tuberosum L.]. The primary host samples were collected from P. dulcis in the southern part of the province and from P. dulcis and P. persica in the northern part of the province. The aphids were collected separately from individual plants and introduced into single translucent plastic containers. To reduce the chances of individuals descending from the same progenitor, individual plants at the sampling sites were more than 5 m apart. The M. persicae samples were taken to the laboratory in refrigerated boxes, placed in glass vials with absolute ethanol and stored at 4 °C.
Amplification of microsatellites loci
Two individuals for each plant species, collected from different individual plants at each sampling site, were analysed. DNA was extracted from apterous adult females of M. persicae using the Quelex 100 chelating ion exchange resin method (Malloch et al., Reference Malloch, Highet, Kasprowicz, Pickup, Neilson and Fenton2006). The loci used in this study were two X-linked (M86 and Myz25) and six autosomal (Myz9, M35, M37, M40, M49 and M63) loci (Sloane et al., Reference Sloane, Sunnucks, Wilson and Hales2001; Wilson et al., Reference Wilson, Massonnet, Simon, Prunier-Leterme, Dolatti, Llewellyn, Figueroa, Ramirez, Blackman, Estoup and Sunnucks2004). The X-linked loci, M37-M49 and M35-M63 belonged to three different linkage groups (Sloane et al., Reference Sloane, Sunnucks, Wilson and Hales2001). Myz9 and M40 belonged to another two different linkage groups (Sloane et al., Reference Sloane, Sunnucks, Wilson and Hales2001). Amplification reactions were prepared using 2 μl of approximately 0.5 ng μl−1 of genomic DNA, 0.5 μM of each primer, 0.2 mM of dNTPs, 10 mM Tris/HCl (pH 8.8), 50 mM KCl, 1.5 mM MgCl2, 0.01% of Tween and 0.5 unit of DNA polymerase (DFS-Taq DNA polymerase, Bioron GmbH, Ludwigshafen, Germany), in a total volume of 20 μl. Forward primers were 5′ labelled with 6-FAM, VIC, NED or PET dyes (Applied Biosystems, Foster City, California). Polymerase chain reaction (PCR) amplifications were carried out in an Eppendorf Mastercycler EPgradient (Eppendorf AG, Hamburg, Germany) under the following conditions: 2 min at 94 °C followed by 36 cycles of 15 s at 94 °C, 30 s at 61 °C and 30 s at 72 °C and then a 10 min incubation at 72 °C. The PCR products were run at 1:50 dilution on an AB3730 DNA Analyzer (Applied Biosystems) with the LIZ500-labelled size standard (Applied Biosystems). Fragments were detected with Peak ScannerTM v1.0 (Applied Biosystems) and verified manually.
Genetical statistical analyses
A total of 923 M. persicae were successfully genotyped for the eight microsatellite loci (table 1). To prevent unreliable results due to the inclusion of multiple clonal copies (Sunnucks et al., Reference Sunnucks, Barro, Lushai, Maclean and Hales1997), genotypes with the same score for the eight microsatellites on samples from the same plant species and sampling sites were excluded from the analyses. We assumed that two individuals were in the same genotype or clone whenever they had the same score for the eight microsatellites. The number of alleles per locus and population, heterozygosity, deviation from Hardy–Weinberg equilibrium (HWE), the fixation index (F IS) and genotypic linkage disequilibrium (LD) were calculated using the FSTAT 2.9.3.2 software (Goudet, Reference Goudet2002). All probabilities were Bonferroni corrected (Rice, Reference Rice1989). The frequency of null alleles was estimated using Genepop 4.0 (Rousset, Reference Rousset2008). ANOVA was used to test whether the proportion of a linked pair of loci in samples (number of linked loci/total number of possible pairwise comparisons) was significantly influenced by linkage group (same or different chromosome), host (primary/secondary host) and geographical area (north/south). The number of alleles per individual, the proportion of genotypes (number of different genotypes/number of individuals genotyped) and the number of loci not under HWE in the samples were tested by ANOVA as a function of the host and the geographical area. Data were transformed by the natural logarithm of (x + 1) when needed to account for heteroscedasticity. All the above statistical analyses were performed using the R software (R Development Core Team, 2005).
Pairwise genetic distances for populations were calculated using the Cavalli-Sforza and Edwards chord distance (D C) (Cavalli-Sforza & Edwards, Reference Cavalli-Sforza and Edwards1967) using FSTAT. D C is considered the most efficient distance for obtaining the correct tree topology under different conditions for microsatellite markers (Takezaki & Nei Reference Takezaki and Nei1996). A neighbour-joining tree for all populations (table 1) was constructed using Population 1.2.32 (Langella, Reference Langella1999). The dendrogram was displayed using Treeview (Page, Reference Page1996). Genotypic differentiation between populations was tested by F ST according to Weir & Cockerham (Reference Weir and Cockerham1984), and P-values obtained after 36,000 permutations using FSTAT; probabilities were Bonferroni corrected (Rice, Reference Rice1989). Population differentiation in M. persicae in relation to host plant families was tested using the samples from Campo de Cartagena collected in 2005. To test whether samples of different plant families represented different M. persicae subpopulations, aphids collected from different plant species were pooled by family to calculate pairwise F ST-values. For analysis of the genetic population structure at geographical and temporal scale, F ST-values were calculated by grouping the samples from each year by crop (pepper), secondary host (herbaceous plants other than pepper) and primary host (Prunus spp.). Two AMOVA analyses were performed using ARLEQUIN 2.0 (Excoffier et al., Reference Excoffier, Laval and Schneider2005), grouping the samples according to host category (pepper; secondary and primary hosts) and year, respectively. The AMOVA in which the samples were grouped by year was performed using only the samples from 2005 and 2008 because some of the host categories were not available for 2006 and 2007. The population structure was inferred using STRUCTURE v2.3 following the method described by Pritchard et al. (Reference Pritchard, Stephens and Donnelly2000), assuming a model with 1 to 10 populations (K clusters). Each K was replicated 20 times for 100,000 iterations after a burn-in of 100,000 without any prior information on the population of origin. The ad hoc statistic ΔK, based on the rate of change in the log probability between successive K values, was used to estimate the uppermost hierarchical level of structure (optimal K) (Evanno et al., Reference Evanno, Regnaut and Goudet2005).
Results
Microsatellite markers, linkage disequilibrium and genetic diversity
All eight microsatellite loci amplified successfully for the M. persicae samples. A total of 289 different genotypes were found in the 630 individuals scored for the eight microsatellites, excluding duplicates from the same sampling site and plant species. Polymorphism was observed for the eight loci in all the samples with the exception of MUPRU08, which was monomorphic for M37 (table 2). The average allelic richness across loci was higher for the herbaceous (mean, 5.75: range, 3–10.53) and primary host (5.56: 1–10) than for pepper (4.52: 2.06–6.53) (table 2) samples. The maximum number of alleles was observed in Myz9 (18), followed by M49 (17) (table 2). The maximum number of alleles across samples was found in the samples from herbaceous plants in 2005 (91) followed by the samples in the primary host in 2008 (78) (table 2). There were no significant differences in the number of alleles between primary and secondary hosts (F = 0.368, df = 1, 12, P = 0.556), nor between samples from the southern and the northern part of the province (F = 0.723, df = 1, 12, P= 0.412). However, the number of alleles on pepper samples in Campo de Cartagena was significantly lower than on samples from herbaceous plants (F = 9.07, df = 1, 5, P = 0.030) and Prunus (F = 6.78, df = 1, 3, P = 0.080). The proportion of unique genotypes in the primary host was similar in the northern (mean ± SE, 0.961 ± 0.036) and the southern (0.987 ± 0.013) part of the province. In the secondary host, the proportion of unique genotypes was higher in the north (0.801 ± 0.159) than in the south (0.318 ± 0.063). The ANOVA denoted significant differences in the proportion of unique genotypes between areas (F = 18.50, df = 1, 12, P < 0.001) and host (F = 58.58, df = 1, 12, P < 0.001), with a significant area–host interaction (F = 11.10, df = 1, 12, P < 0.01). The proportion of unique genotypes on pepper and herbaceous plants in the surroundings of greenhouses in Campo de Cartagena was not significantly different (F = 1.13, df = 1, 5, P = 0.336).
Population code: 1 = AGHER05, 2 = CAPEP05, 3 = CAPEP06, 4 = CAPEP08, 5 = CAHER05, 6 = CAHER06, 7 = CAHER07, 8 = CAHER08, 9 = CAPRU05, 10 = CAPRU08, 11 = JUPRU08, 12 = MUPRU08, 13 = NOHER05, 14 = NOHER08, 15 = NOPRU05, and 16 = NOPRU08.

Number of alleles (n), observed (H o) and expected (H e) heterozygosity, F IS-values (*significantly different from expected in HW equilibrium after Bonferroni correction). NA, not available.
The average proportion of null alleles across samples ranged from 0.04 to 5.27%. In samples from the southern part of the province, significant disequilibrium was detected between loci belonging to the same and different linkage groups, both in herbaceous plants and Prunus spp. The average linkage proportions for pairs of loci located in the same chromosome in the southern part of the province were 0.333 and 0.222 in herbaceous and Prunus, respectively. For the loci in different chromosomes, the linkage proportion was higher in herbaceous plants (0.395) than in Prunus spp. (0.133). In the northern part of the province, no linkage disequilibrium was observed between loci located in different groups, and low linkage was observed for loci located in the same group in samples from herbaceous plants (0.02). The proportion of linked loci did not differ significantly in relation to linkage group (F = 0.021, df = 1, 28, P = 0.887) or host (herbaceous plants/Prunus) (F = 0.962, df = 1, 28, P = 0.335), but significant differences were found between the southern and the northern part of the province (F = 6.10, df = 1, 28, P = 0.020).
Heterozygosity was high in most of the samples and loci (table 2). The average H o ranged from 0.452 to 0.900, and the average H e from 0.513 to 0.844 (table 2). Heterozygosity excess was observed in most of the samples, with a significant departure from HWE in all samples on pepper and herbaceous plants in Campo de Cartagena (table 2); the average number of loci not in HWE was the same for pepper and herbaceous plant samples (three loci). Significantly lower heterozygosity than expected was found only for M86 in NOPRU08 (table 2). The number of loci not in HWE was significantly higher in the southern than in the northern part of the province (F = 5.45, df = 1, 12, P = 0.034), and in the secondary host than in the primary host (F = 4.22, df = 1, 12, P = 0.062).
Genetic population structure in M. persicae in relation to host plant
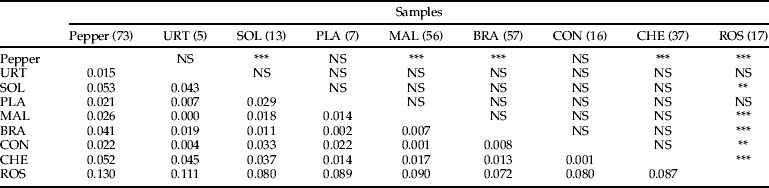
The F ST-values pointed to a degree of differentiation in M. persicae samples according to the primary and secondary hosts. The overall F ST-values among the samples from different families of herbaceous plants in the environment of pepper greenhouses were low (0.001–0.053) and not significant in any case (table 3). These low F ST-values indicate null or little genetic differentiation among samples in relation to plant family. However, significant F ST-values were found between pepper and most of the herbaceous plant samples, and between herbaceous plants (including pepper) and the primary host (table 3). The highest F ST-values (0.072–0.130) were found between samples on the primary host and the rest of the samples (table 3). Given the lack of population differentiation in relation to plant families, M. persicae samples on herbaceous plants in the same year and locality were grouped together for the following analyses.
Pairwise comparison for genetic differentiation based on F ST-values for M. persicae samples on different plant families. URT, urticaceae; SOL, solanaceae; PLA, plantaginaceae; MAL, malvaceae; BRA, brassicaeae; CON, convolvulaceae; CHE, chenopodiaceae; ROS, Rosaceae (Prunus spp.). NS = non-significant, *P < 0.05, **P < 0.01, ***P < 0.001. Significance after the correction of P by Bonferroni. Number of individuals genotyped (excluding duplicates) in brackets.
Genetic population structure at geographical and temporal scale
F ST-values ranged from 0.001 to 0.156 and denoted a variable degree of differentiation among samples in the three groups of hosts (pepper, herbaceous plants and Prunus) in the different geographical areas and years (table 4). F ST-values in the four years of the study ranged from 0.037 to 0.090 among pepper samples, from 0.022 to 0.068 among samples of herbaceous plants and from 0.010 to 0.127 among samples of Prunus (table 4). F ST-values among pepper and herbaceous plant samples in Campo de Cartagena ranged from 0.010 to 0.017, with lower F ST-values among pepper and herbaceous plant samples in the same year than among those in different years (table 4). Significant differences were found among pepper samples from Campo de Cartagena and samples on herbaceous plants from other localities in approximately half of the cases (table 4). F ST-values always showed significant differences in pairwise comparisons among pepper and Prunus samples, with the exception of CAPEP06 and CAPRU08 (table 4). Samples on herbaceous plants in the north and the south of the province differed significantly in six out of ten pairwise comparisons (table 4). No significant differences were found among any Prunus samples in the same year, which was also sometimes the case with pairwise comparison among samples from different years (table 4).
Pairwise comparison for genetic differentiation based on F ST-values for M. persicae samples (see Table 1 for sample codes). P-values obtained after 136,000 permutations. NS = non-significant, *P < 0.05, **P < 0.01, ***P < 0.001; P significance after Bonferroni correction.

AMOVA pointed to a significant population structure when samples were grouped by host category (pepper, secondary and primary hosts). Differences between individuals within samples accounted for most of the genetic variation (94.14%), followed by the variation among samples within groups (4.15%) and differences among groups of hosts (1.71%) (table 5). When samples were grouped by year, most of the genetic variation was also due to differences between individuals within samples (94.80%), followed by variations among samples within groups (4.54%) and between groups (0.66%) (table 6). Two main clusters may be observed in the dendrogram showing the relationship among M. persicae samples: one of the clusters includes all the samples from Prunus and the other all the samples from pepper and the rest of herbaceous plants (fig. 2). There was no clear structure associated with the year of sampling, although, samples from the same year were frequently located in the same branch. A structural analysis was run for K values ranging from 1 to 10, with the ad hoc statistic (ΔK) reaching its maximum at K = 3 (55.4 ± 3.9, average ± SE) followed by K = 2 (52.4 ± 4.2). For K = 2, most of the individuals from the primary host were included in the first cluster, while the samples from pepper and the rest of the secondary hosts were a mixture of individuals assigned to both clusters (fig. 3). The percentage of individuals assigned to the first cluster in the primary host ranged from 88.2 to 99.3%. In the pepper samples, most of the individuals were generally included in the second cluster (47.4–70.9%), while for the other secondary hosts the highest numbers of individuals were assigned to the first cluster (52.7–81.8%) (table 7). For K = 3, most of the individuals from the primary host had the highest probability of ancestry in the first cluster (79.3–96.5%) (fig. 3, table 7). In pepper, a high percentage of individuals were assigned to the second cluster (40.9–64.2%), but the results varied with the years (table 7). In the samples from herbaceous plants, there was no clear pattern in the assignment of individuals to clusters (table 7).
Population dendrogram for samples of M. persicae collected from 2005 to 2008 on different host plants (see table 1 for sample codes). Numbers on nodes show bootstrap support (10,000 pseudo replications).

STRUCTURE analyses for K = 2 and 3 clusters. M. persicae population structure based on microsatellite scores. Each line represents a single individual and is fragmented in different colours according to the coefficient of ancestry of each individual.

Hierarchical analysis of molecular variance (AMOVA) for samples of M. persicae collected from 2005 to 2008 grouped by host category (crop, secondary and primary hosts). Degrees of freedom (df), sums of squared deviations (SSD), the percentage of the total variance because of each level, and the probability test calculated after 1023 permutations.

Hierarchical AMOVA for samples of M. persicae collected from 2005 and 2008 on different host categories grouped by year. Degrees of freedom (df), sums of squared deviations (SSD), the percentage of the total variance because of each level, and the probability test calculated after 1023 permutations.

Results of Bayesian analyses using STRUCTURE. Percentage of individuals in the M. persicae samples assigned to each cluster according to their respective probabilities of ancestry for K = 2 and K = 3 in samples.

Discussion
Genetic diversity
In this work, we investigated the population structure of M. Persicae in diverse agroecosystems in areas with different climatic conditions and in relation to the primary and secondary hosts. We also looked at the change in the population structure in temporal hosts (pepper crops) versus permanent hosts (Prunus spp. and herbaceous plants). The high genetic diversity found in Murcia province agrees with the high haplotype diversity observed using other markers such as RAPD (Random amplified polymorphic DNA) (Martinez-Torres et al., Reference Martínez-Torres, Carrio, Latorre, Simon, Hermoso and Moya1997) or rDNA fingerprinting (Fenton et al., Reference Fenton, Woodford and Malloch1998). The differences in the proportion of unique genotypes, linkage disequilibrium, number of alleles and the number of loci under HWE indicated divergences in the population structure of M. persicae according to the host (primary or secondary) and the geographical area of distribution. The proportion of unique genotypes was higher in Prunus than in the secondary host plants but, while in Prunus the proportion was similar in the northern and southern part of the province, on the secondary host the proportion of unique genotypes was lower in the southern area. No significant differences were found in unique genotypes between pepper and herbaceous plant samples in the vicinity of greenhouses in the southern area, although, a lower number of alleles were observed on pepper than on herbaceous plants and Prunus, which might be due to a founder effect. The higher proportion of unique genotypes in herbaceous plants in the northern part of the province might be explained by the lower survivorship of obligate parthenogens in severe winter conditions, and consequently, by a lower representation of anholocyclic forms in populations. Lower genotypic variability is to be expected in obligate parthenogenetic aphids as a result of the absence of recombination in asexual reproduction (Delmotte et al., Reference Delmotte, Leterme, Bonhomme, Rispe and Simon2001, Reference Delmotte, Leterme, Gauthier, Rispe and Simon2002; Guillemaud et al., Reference Guillemaud, Mieuzet and Simon2003). These findings agree with the distribution and abundance of holocyclic and anholocyclic M. persicae in relation to climatic conditions predicted by Blackman (Reference Blackman1974). The different climatic conditions of our two geographical areas of study may have a significant effect on the M. persicae population structure. In the southern part of the province anholocyclics may easily survive mild winter temperatures, while in the northern part their survivorship will depend greatly on the severity of winter temperatures. Vorburger et al. (Reference Vorburger, Lancaster and Sunnucks2003a) found that both the abundance of peach trees and temperature influenced the distribution of genotypes with different reproduction strategies, and the genetic diversity in populations of M. persicae in Victoria, Australia. Cold winters may eliminate anholocyclic M. persicae, reducing genetic variability and imposing population ‘bottlenecks’ (Fenton et al., Reference Fenton, Woodford and Malloch1998). The results of the present work also agree with those of Guillemaud et al. (Reference Guillemaud, Mieuzet and Simon2003), who found a higher proportion of multilocus genotypes in mixed samples of obligate and cyclical parthenogens than on peach samples of cyclical parthenogens.
Linkage disequilibrium was frequent in samples from the southern part of the province, both in the primary and secondary hosts, but rare in the northern area. A similar degree of association found at both, loci belonging to the same and different linkage groups, might be explained by the generation of new genotypes resulting from the mutation of obligate parthenogens. The significant linkage found on peach samples in the southern part of the province might be explained by the contribution of androcyclic and facultative parthenogenetic clones to the population pool reproducing sexually in the primary host. Gillemaud et al. (Reference Guillemaud, Mieuzet and Simon2003), found no significant linkage among loci in samples of M. persicae populations collected on peach, with frequent linkage disequilibria in samples from aerial traps, supposedly integrated by a mix of obligate and cyclical parthenogens. Linkage disequilibrium at loci belonging to different linkage groups was also observed in M. persicae by Wilson et al. (Reference Wilson, Sunnucks, Blackman and Hales2002).
The significant heterozygosity excess found on pepper and herbaceous plants in the southern part of the province may be attributed to the high representation of obligate parthenogens in M. persicae populations in the secondary hosts. The same diversity pattern associated with the over representation of obligate parthenogens in populations has been reported for other aphids such as Sitobion spp. (Sunnucks et al., Reference Sunnucks, England, Taylor and Hales1996; Wilson et al., Reference Wilson, Sunnucks and Hales1999), Aphis gossyii Glover (Fuller et al., Reference Fuller, Chavigny, Lapchin and Vanlerberghe-Masutti1999) and Myzus antirrhinii Macchiati (Hales et al., Reference Hales, Wilson, Sloane, Christophesimon, Legallic and Sunnucks2002). This higher heterozygosity in obligate parthenogenetical lineages may be explained by the accumulation of mutations at loci during extended cycles of asexual multiplication, among other factors (Birky Reference Birky1996; Fenton et al., Reference Fenton, Woodford and Malloch1998; Guillemaud et al., Reference Guillemaud, Mieuzet and Simon2003; Vorburger et al., Reference Vorburger, Lancaster and Sunnucks2003a). The hybridization between highly differentiated populations is another factor leading to heterozygosity excess in aphid populations (Delmotte et al., Reference Delmotte, Leterme, Bonhomme, Rispe and Simon2001). This argument favours our hypothesis of interbreeding between androcyclic and facultative obligate parthenogens with cyclical parthenogens in the primary host in Murcia province. Complementary studies will help determine the contribution of hybridization to the genetic variability of M. persicae populations.
Population genetic structure in relation to host plants
Host specialization is common in aphids and the formation of host races has been reported in several polyphagous species (Blackman & Eastop Reference Blackman and Eastop2000; Frantz et al., Reference Frantz, Plantegenest, Mieuzet and Simon2006). Divergences in the populations of A. pisum associated with host specialization in alfalfa [Medicago sativa L. (Fabaceae)] and red clover [Trifolium pratense L. (Fabaceae)] have been reported both in the ancestral geographic range of distribution and in the New World (Via, Reference Via1999; Hawthorne & Via Reference Hawthorne and Via2001; Simon et al., Reference Simon, Carre, Boutin, Prunier-Leterme, Sabater-Muñoz, Latorre and Bournoville2003; Frantz et al., Reference Frantz, Plantegenest, Mieuzet and Simon2006). The association of lineages with specific host plant species was also reported in Sitobion avenae (F.) (Hemiptera: Aphididae) in France (Sunnucks et al., Reference Sunnucks, Barro, Lushai, Maclean and Hales1997). The specialization of M. persicae seems to be mostly related to tobacco and little evidence of population differentiation has been reported in other host plants. Molecular, morphological and behavioural studies pointed to significant differences between M. persicae clones on tobacco and other host plants in tobacco-growing regions in northern and central Greece (Margaritopoulos et al., Reference Margaritopoulos, Tsitsipis, Zintzaras and Blackman2000, Reference Margaritopoulos, Blackman, Tsitsipis and Sannino2003, Reference Margaritopoulos, Malarky, Tsitsipis and Blackman2007a; Nikolakakis et al., Reference Nikolakakis, Margaritopoulos and Tsitsipis2003). The overrepresentation of one M. persicae genotype on Solanum physalifolium Rusby (Solanaceae) is the only evidence provided as a possible case of specialization of M. persicae in a host other than tobacco. Fenton et al. (Reference Fenton, Woodford and Malloch1998) found no differences in the distribution of genotypes between Brassica and potato crops. Similarly, Zitoudi et al. (Reference Zitoudi, Margaritopoulos, Mamuris and Tsitsipis2001) found no specific band pattern in clones collected from different host plants using RAPD. In the present work, we found no evidence of M. persicae population divergence in any of the families of herbaceous plants commonly present in the vicinity of pepper greenhouses in Murcia province.
M. persicae population structure at geographical and temporal scale
Analysis of the population structure using microsatellite markers revealed a marked microgeographic structure associated with primary and secondary hosts, and variable with time. F ST-values ranging from 0.034 to 0.130 indicated moderate differentiations between M. persicae populations in the primary and secondary host plants; samples from the herbaceous plants and Prunus also grouped into two distinct clusters in the NJ dendrogram. As stated above, these differences in structure might be due to populations in herbaceous plants being made up of both obligate and cyclical parthenogenetic genotypes, while cyclical parthenogens would be the predominant forms in the primary host. Bayesian analyses showed that the population of M. persicae in Murcia province could be grouped into two or three clusters. In both cases (K = 2 and 3), the samples from the primary host were mainly composed of individuals belonging to the first cluster, while the samples from the secondary host were made up of genotypes belonging to the first, second and third (in the case of K = 3) clusters. The existence of two clusters could be explained according to reproductive modes: Prunus would mainly host holocyclic genotypes, while herbaceous plants would host both holocyclic and anholocyclic forms. The high level of organization (K = 3) predicted by STRUCTURE is difficult to explain because no obvious pattern is observed in the secondary host. Genetic differentiation between populations with a high percentage of cyclical parthenogens and those consisting mostly of anholocyclic lineages were reported in tobacco-growing regions in Greece (Margaritopoulos et al., Reference Margaritopoulos, Malarky, Tsitsipis and Blackman2007a). Martinez-Torres et al. (Reference Martínez-Torres, Simon, Fereres and Moya1996) predicted that a different distribution of anholocyclic and holocyclic aphids in populations would result in significant structuring of populations as long as gene flow between the two lineages and migration levels were limited. The little differentiation between samples of M. persicae on pepper and herbaceous plants in the same year seems to indicate that herbaceous plants in the vicinity of greenhouses are the most likely source of aphids for pepper crops. F ST-values among pepper and herbaceous plant samples from Campo de Cartagena ranged from 0.001 to 0.017, with lower F ST-values between samples on pepper and herbaceous plants from the same year than between those in different years. The differences between herbaceous plants and pepper found in some years could be due to a founder effect, as populations in greenhouses may be composed of the few lineages that spread from herbaceous plants and Prunus.
The significant change observed in the structure of M. persicae populations on the secondary hosts from one year to another might be due to a high turn-over of obligate parthenogenetic genotypes surviving the winter, combined with a variation in the contribution of genotypes generated by cyclical parthenogens reproducing sexually in the primary host. Moreover, the changes in the structure of the population found on Prunus between years might also be connected with the selection of genotypes in secondary hosts that migrate later to the primary host. Impoverishment and increased differentiation between summer and autumn populations of M. persicae were reported in central and northern France (Guillemaud et al., Reference Guillemaud, Mieuzet and Simon2003). Treatment with insecticides may also have a strong impact on the shaping of M. persicae population in agroecosystems, selecting genotypes resistant to insecticides (Devonshire et al., Reference Devonshire, Field, Foster, Moores, Williamson and Blackman1998).
Overall F ST-values (0.022 ± 0.009) among Prunus samples from distant localities in the same year indicate a low degree of population differentiation, possibly due to the homogenization of populations by the displacement of M. persicae over a greater distance than considered in this study (<100 km). In contrast, samples on herbaceous plants showed higher geographical differentiation on the same spatial scale (overall F ST = 0.040 ± 0.006). A higher degree of population homogenization and, therefore, lower population differentiation is expected in cyclical than in obligate parthenogenetic aphid populations due to the migrations of cyclical parthenogens between the primary and secondary hosts.
Acknowledgements
We thank Pedro Fernández, Marta Miguel, Ma Carmen Martínez, Conchi Fernández, Antonio Gutiérrez and Laura Gutiérrez for helping with the sampling, and Javier Cerezuela for technical support. We thank Manolo Caro from SIAM for providing the temperature records and producing the isocline maps. This work was funded by the research project INIA RTA03-101. The senior author (J.A.S.) was awarded grants by the Ministerio de Ciencia e Innovación (Ramón y Cajal programme), the European Social Fund and FEDER. Michelangelo La Spina received a grant from the INIA.



