Introduction
The sex difference in height and weight are well known. Demographers often claim that females' life chances are affected by greater food deprivation, as measured by differences in mortality. Thus sex discrimination is manifested by higher mortality among females in infancy and childhood (Filmer et al., Reference Filmer, King and Pritchett1998; Arokiasamy, Reference Arokiasamy2004). Childhood health discrimination has been prominent in India for a long period, and this is reflected in health at the adult stage. Mothers with ill health in turn give birth to low weight babies. Thus, it is a vicious circle. India has one of the highest levels of low birth weight babies in the world (UNICEF, 2001).
Human populations vary in weight and height (Eveleth & Tanner, Reference Eveleth and Tanner1990), and researchers need a single measure of health status that combines weight, height and age as well as sex. Body mass index (BMI, defined as the ratio of weight in kilograms to the square of the height in metres) has been put forward as a universal and non-controversial measure of the health status of adults (Shetty & James, Reference Shetty and James1994; Gautam et al., Reference Gautam, Adak, Gharami and Datta2006; Adak et al., Reference Adak, Gautam, Bharati, Gharami, Pal and Bharati2006). In India, BMI has been used as a measure of health status in studies in the north-east (Bharati, Reference Bharati1989; Khongsdier, Reference Khongsdier2001) and south (Reddy, Reference Reddy1998) of the country. Women with low (<18.5 kg/m2) BMI have been found to have higher mortality rates and increased risk of illness (Rotimi et al., Reference Rotimi, Okosun, Johnson, Owaoje, Lawoyin, Asuzu, Kaufman, Adeyemo and Cooper1999; Sauvaget et al., Reference Sauvaget, Ramadas, Thomas, Vinoda, Thara and Sankaranarayanan2008). A number of socioeconomic (occupation, education and standard of living), cultural (religion and caste) and demographic (age) factors have been found to be associated with female malnutrition (Griffiths & Bentley, Reference Griffiths and Bentley2001; Radhakrishna & Ravi, Reference Radhakrishna and Ravi2004; Roy et al., Reference Roy, Kulkarni and Vaidehi2004). There is also an association between poor demographic, economic, social and environmental conditions and undernutrition (defined as BMI of less than 18.5 kg/m2; Pryer & Rogers, Reference Pryer and Rogers2006; Subramanian & Smith, Reference Subramanian and Smith2006; WHO, 2012).
However, BMI takes neither age nor sex into consideration. Thus the performance of this measure is not expected to be the same for all age groups, because both males and females experience growth up to the age of around 21 years. This age is slightly higher in India at about 22 or 23 years, due to poor nutritional intake and the severe epidemiological environment (Brennan et al., Reference Brennan, McDonald and Shlomowitz2003). BMI performance will not be the same for both sexes, because the growth patterns of males and females from childhood are different. Any study on the nexus among height, weight and age cannot be made without taking sex into consideration, and these two populations should be treated separately.
Questions remain about the relation between BMI and age. Weight is known to be positively dependent on age and so is height, or the square of height, up to a certain age, say 23 years. Thus, BMI has a positive relation with age above 23 years. The average BMI of babies and children does not have a monotonic relation with age. Average BMI first decreases just after birth for a few days, then goes up for a few months and then down again somewhere around one year. The decreasing trend persists up to the age of 5 or 6 years and then rises again. There are growth charts that have been prepared by WHO, where percentiles of BMI are shown at different ages up to the age 20 years (WHO, 2007).
Variations in adult height in different regions and population groups have been well studied (Bharati et al., Reference Bharati, Mukherji, Pal, Som, Adak, Vasulu and Bharati2010; Perkins et al., Reference Perkins, Khan, Smith and Subramanian2011). Sexual dimorphism in height is increasing in some Indian states (Andhra Pradesh, Orissa and Tamil Nadu), while in others it is decreasing (Gujrat, Kerala and Maharastra) (Guntupalli & Moradi, Reference Guntupalli, Moradi, Pal, Bharati, Ghosh and Vasalu2009). The variations are due to genetic and environmental factors. Height is a retrospective measure of an individual's health and biological standard of living and almost determined before the person reaches the age of 20 (Komlos & Baten, Reference Komlos and Baten1998). Heights, between populations, may differ due to genetic factors, but within a population the differences are mainly due to socioeconomic, nutritional and health factors.
Compared with height, weight is less determined by genetic factors (Rolland-Cachera, Reference Rolland-Cachera1993), as it can easily be changed by altering eating habits and controlling health environments. The local factors that influence stature include socioeconomic status (Sharma, Reference Sharma2008), age (Bhalotra, Reference Bhalotra2007), diet and nutrition (DeRose et al., Reference DeRose, Das and Millman2000) and income inequality (Roy et al., Reference Roy, Kulkarni and Vaidehi2004; Deaton, Reference Deaton2008). In developing countries poverty rates are high and there is also large variation in economic conditions. Thus environmental variation due to variation in the intake of food and hygiene habits is higher in developing countries than in developed countries (although there are some exceptions in Africa, where in spite of low economic positions, average heights are higher than in several other developing countries (Akachi & Canning, Reference Akachi and Canning2008)). Since in a given population the genetic factors remain more or less same, the variation in adult heights is mainly due to variation in environmental factors. Thus developing countries are expected to have more variation in height within a social group.
Since BMI depends on both weight and height, it is expected to depend on both genetic and environmental factors. Height and BMI are both measures of nutritional status, but height is more governed by genetic factors than environmental factors (Bharati et al., Reference Bharati, Mukherji, Pal, Som, Adak, Vasulu and Bharati2010). Moreover, one should keep the fact in mind that people in India practise endogamy. Height, as a measure of adult nutritional status, is a long-term indicator and reflects the net gain in nutrition over the growth period and cannot be altered in the later stages of growth. Prominent changes in height may take a long time and therefore it is more influenced by genetic factors inherited from parents (Viswanathan & Sharma, Reference Viswanathan and Sharma2009). Also, it does not vary much among the members in a given population. On the other hand, BMI is a short-term measure of nutritional status. Changes may occur in a short time due to inadequate or excess food intake. For India, published data show that morbidity and mortality are associated with low BMI as well as high BMI. The burden of diseases is associated with both extremes of physical status (National Institute of Nutrition, 1991; Khongsdier, Reference Khongsdier2002; Shukla et al., Reference Shukla, Gupta, Mehta and Hebert2002; Sauvaget et al., Reference Sauvaget, Ramadas, Thomas, Vinoda, Thara and Sankaranarayanan2008; Kathrotia et al., Reference Kathrotia, Swapnil, Paralikar, Rao and Oommen2010).
Thus it is of interest to see trends in heights over ages for groups of persons of short, medium and tall heights. It is, of course, possible that some short persons may become medium height persons at a later stage. Similarly, some medium height persons may become tall persons as they grow to age 21 years. The movement, especially in the case of BMI, may be in the opposite direction also. But all these are marginal cases and these forward and backward movements are not expected to affect the overall picture much. Given the same environmental and incidental factors, shortness or tallness are more or less genetically determined. Thus distinct features of growth patterns may be expected among different height groups.
Unlike height, BMI mainly reflects the nutritional status of adults. The growth pattern of BMI is not expected to be the same as that of height. It is possible for a person to grow for ever, in terms of BMI, over time. On average, BMI increases with age, but is this true for all BMI groups – underweight, normal and overweight? In the case of BMI, the intergroup movements are expected to be greater in the upward direction, i.e. it is more likely that some underweight persons become normal weight or some normal weight persons become overweight in the course of time. Movement of a person from the underweight group to the normal weight group is expected to be at the level close to the minimum BMI of the normal BMI group, and thus the average BMI will fall in the normal weight group as age increases, if the opposite movement is not much. Is this reflected in the data? The same question may be raised for normal weight persons, as many of these will enter the overweight group. The remaining persons would also gain some weight. Thus there are two effects: movement effect and the usual increase of weight effect. However, it is not possible to differentiate between the two effects using cross-sectional data.
A similar interpretation is possible for other factors, for example place of residence. Urban average BMI/height is expected to be more than that of rural BMI/height. However, is this true for all BMI/height groups? Here again there are two kinds of movement: the usual increase in BMI/height and the movement of persons from rural areas to urban areas and vice versa. The present analysis can only show the resultant movement.
This study assesses both long-term (in terms of stature) and short-term (in terms of BMI) deprivation in the Indian regions. India has a variety of ethnic populations: Scheduled Tribes, Castes, Other Backward Classes on the one hand, and General Castes and other communities such as Muslims, Christians and Sikhs on the other. States also differ within socioeconomic criteria. The ‘caste and religion’ variable is very robust, and it is rare that a person changes their religion or caste status. This analysis will thus show only the usual association of BMI/height with caste and religion.
The main purpose of this study was thus to assess the variation in average BMI and height of adults for different height and BMI groups in India by factors including place and zone of residence, caste and religion, age, education and status of poverty, separately for males and females.
Methods
The data were taken from the India National Family Health Survey-3 (NFHS-3) during the year 2005–06 (IIPS, 2007). This cross-sectional survey gathered information on the population's socioeconomic, demographic, anthropometric and other characteristics, along with other relevant information.
For males, heights were classified as very short (≤149.99 cm), short (150.00–159.99 cm), below medium (160.00–163.99 cm), medium (164.00–166.99 cm), above medium (167.00–169.99 cm) and tall (≥170.00 cm). For females, the classification was: shortest (<145.00 cm), short (145.00–149.99 cm), medium (150.00–154.99 cm), tall (155.00–159.99) and tallest (≥160.00). For simplification and/or parity, male and female heights were grouped into three categories: (i) above medium (tall), (ii) medium and (iii) below medium (short). This classification was taken from Singh et al. (Reference Singh, Bhalla and Kaul1994, Reference Singh, Bhasin, Malik and Eiben1977). Body mass index (defined as weight in kilograms divided by the square of height in metres) was classified according to the WHO classification (WHO, 1995) as underweight (<18.5), normal (18.5–24.9), overweight (25.0–29.9) and obese (≥30.0). This classification is the same for both adult males and females. It was further classified as underweight, normal and overweight, putting obese persons in the overweight group.
The other covariates were: place of residence according to rural and urban settings, age group of males and females from 15 to 49 years, marital status, ethnicity, such as Muslim, Christian, Hindu Scheduled Castes (SC), Scheduled Tribes (ST), General Hindu category and ‘Others’, i.e. other religions such as Sikh, Buddhist, Jain, Jewish and Persian. Economic status was measured by a wealth index based on 33 assets and housing characteristics including: household electrification, type of windows, source of drinking water, type of toilet facility, type of flooring, material of exterior wall, type of roofing, cooking fuel, house ownership, number of household members per sleeping room, ownership of a bank or post-office account and ownership of mattress, pressure cooker, chair, cot/bed, table, electric fan, radio/transistor, black and white television, colour television, sewing machine, mobile phone, any other phone, computer, refrigerator, watch or clock, bicycle, motorcycle, or scooter, animal-drawn cart, car, water pump, thresher and tractor. Each household asset was given a weight, generated through principal component analysis, and the resulting asset scores standardized in relation to a normal distribution with a mean of zero and standard deviation of one (Gwatkin et al., Reference Gwatkin, Rutstein, Johnson, Pande and Wagstaff2000). Each household was then assigned a score for each asset, and the scores summed for each household; individuals were ranked according to the score of the household in which they reside. The sample was then divided into quintiles, i.e. five groups with an equal number of individuals in each.
Two-way tables were prepared and multivariate linear regressions performed using SPSS version 12. For regression analyses height and BMI, as measures of nutritional status, were considered separately as the dependent variables and socioeconomic variables were taken as independent variables. In addition to the usual regression analysis, regression was carried out for each of the three subgroups of dependent variables, where the subgroups were formed according to the values of the dependent variables. For height, the subgroups were short, medium and tall, whereas for BMI the subgroups were underweight, normal and overweight. Levels of significances of p<0.01, 0.05 and 0.1 were considered.
Results
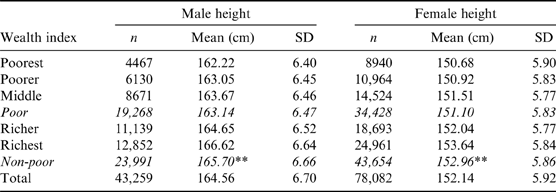
Table 1 shows the height differences of males and females aged 24–49 years by economic group, as measured by the wealth index, for males and females. It was found that, for both males and females, mean heights are higher in higher economic categories, increasing throughout the economic groups. The mean height of the middle income group is less than the overall mean for both males and females. Thus the mean heights of the poorest, poorer and middle income groups are always below the national average, whereas the mean heights of the richer and richest groups are higher than, or almost equal to, the national average, justifying the designation of ‘poor’ and ‘non-poor’ categories.
Distribution of mean heights of males and females aged 24–49 years by wealth index, India, NFHS-3, 2005–06

** Significant at 1% level (non-poor compared with poor).
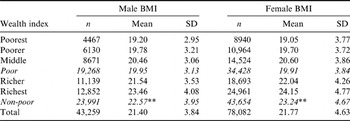
Body mass index (Table 2) consistently increase with higher economic group, and the poor and its subgroups, i.e. poorest and poorer and middle, all have mean BMI values less than the national average, for both males and females. The reverse is true for the non-poor group and its subgroups.
Distribution of mean BMIs of males and females aged 24–49 years by wealth index, India, NFHS-3, 2005–06

** Significant at 1% level (non-poor compared with poor).
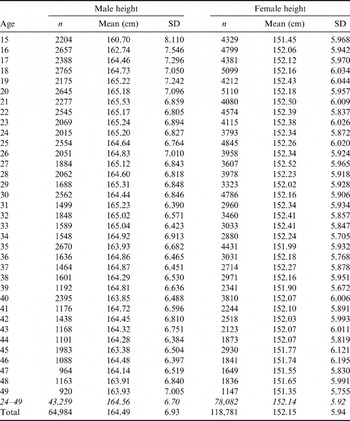
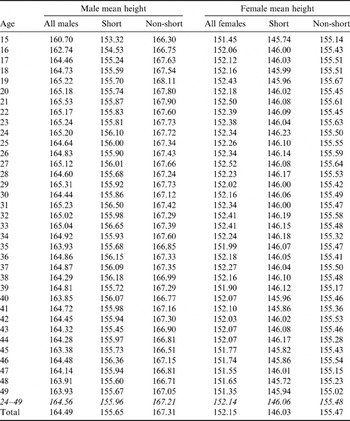
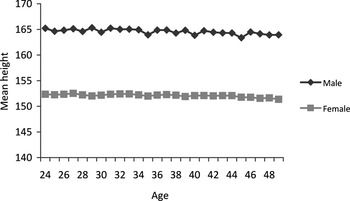
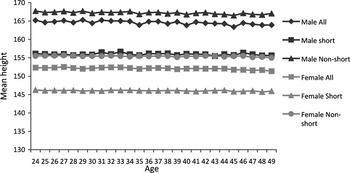
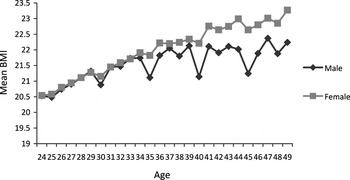
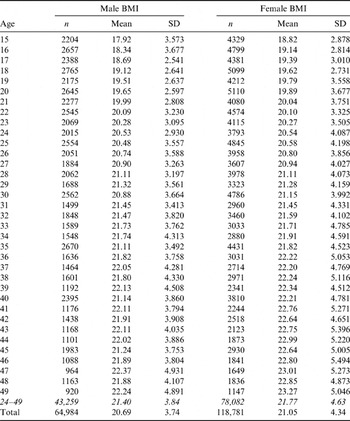
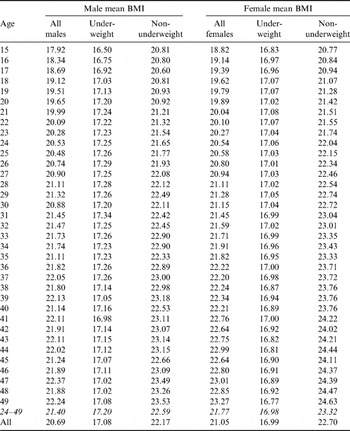
Mean heights and BMIs are shown in Tables 3 and 4 for each age from 15–49 years and Figs 1 and 3 for age 24–49 years respectively. It is known that growth (height increase) almost comes to an end at about the age of 21, and that at the age of 40 height starts to fall due to shrinkage of the vertebral column. However, Brennan et al. (Reference Brennan, McDonald and Shlomowitz2003) found that height increases up to the age of 23 years, so for subsequent analysis the 24–49 year age group was taken to find the relations of age with other variables. Thus the distributions of heights and BMIs over ages are not expected to be similar. Age-wise mean heights for short and non-short males and females are shown in Table 4 and Fig. 2. Table 4 also includes corresponding mean heights of all males and all females for direct comparison. The trends in the mean values for short and non-short persons are similar to the all-male and all-female mean values, except for short females where the figures are more or less constant, i.e. without trend throughout.
Distribution of mean heights of males and females by age, India, NFHS-3, 2005–06

Mean heights of groups of males and females by age, India, NFHS-3, 2005–06

Distribution of mean heights of males and females by age, India, NFHS-3, 2005–06.

Distribution of mean heights of groups of males and females by age, India, NFHS-3, 2005–06.

Distribution of mean BMI of males and females by age, India, NFHS-3, 2005–06.

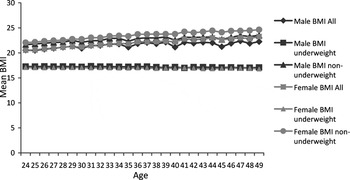
Table 5 and Fig. 3 show the mean BMI distribution for males and females by age group. A consistent increase in BMI is seen with advancement in age for both males and females. The noticeable feature is that females start with a higher BMI at the age of 15 years in comparison with males and continue to increase up to the age of 49 years. Looking at Table 6 and Fig. 4, which show mean BMI for males and females of different weight groups, the mean BMIs of underweight persons are not the same as those of non-underweight persons, or of ‘all persons’. Except for a slight initial increase up to the age of 18 or 19 years, mean BMIs are more or less stagnant. It is true that there is an upper limit for underweight persons, but, given the community of underweight persons, there should be an increasing trend in mean BMI with age. In any case, it calls for further investigation.
Distribution of mean BMIs of males and females by age, India, NFHS-3, 2005–06

Mean BMIs of groups of males and females by age, India, NFHS-3, 2005–06

Distribution of mean BMI groups of males and females by age, India, NFHS-3, 2005–06.

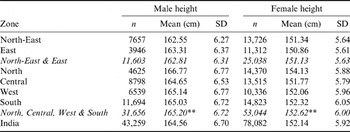
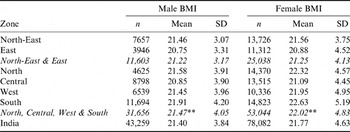
In Tables 7 and 8, mean males and female heights and BMIs are shown for different geographical zones. Mean heights are very small in the North-East and East zones, the North-East having the lowest mean height for males and the East the lowest mean height for females. The greatest height is seen in the North zone for both males and females. Surprisingly, the average height of females in the North zone is much above the average height of females of the other zones. Mean BMIs do not show the same trend. The East zone is consistently below the other zones in the case of BMI, and mean BMI is uniformly highest in the South zone.
Mean heights of males and females aged 24–49 years by zone, India, NFHS-3, 2005–06

** Significant at 1% level (North, Central, West & South compared with North-East & East).
Mean BMIs of males and females aged 24–49 years by zone, India, NFHS-3, 2005–06

** Significant at 1% level (North, Central, West & South compared with North-East & East).
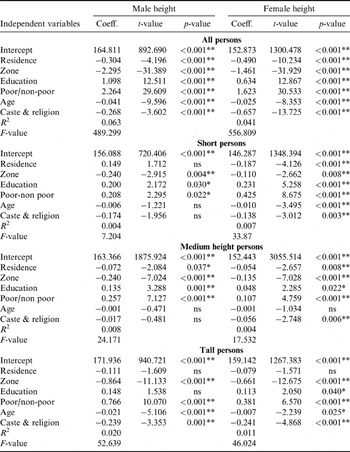
Table 9 shows the results of the linear regression analysis when heights were regressed on the explanatory variables place of residence, zone, education, economic status (poor/non-poor), age and caste & religion. Since it was thought that there might be a non-linear effect of age on height, the square of age was taken, along with age, as an explanatory variable. The coefficient of the square of age was also found to be significant, but it brought in multicollinearity problems for both height and BMI. The idea of adding square of age as an explanatory variable was thus dropped. The same set of regressors has been taken in the case of BMI later in this paper.
Results of linear regression of heights of males and females aged 24–49 years on independent variables for different height groups, India, NFHS-3, 2005–06

Residence: 1=urban, 0=rural; zone: 1=North-East & East, 0=North, Central, West & South; education: 0=illiterate, 1=literate; poor/non-poor: 0=poor, 1=non-poor; age: years completed; caste & religion: 0=Muslim, Christian & Other, 1=SC, ST & Gen Hindu.
*Significant at 5% level; **significant at 1% level.
All the coefficients in Table 9 were found to be significant and the coefficients were in the expected direction, except place of residence and age. The exceptions may be due to the simultaneous effect of other variables. Based on t-values, it is seen that zone and economic status have the greatest effect on height. In the case of short persons, all the coefficients have the same sign as in the case of all males or all females respectively, except for the coefficient of ‘place of residence’ for males. For medium height persons, age has no significant effect on height, and this is the expected result. However, for short and tall persons, the effect of age is seen to be significantly negative. More-educated people and the non-poor have greater average heights for all groups.
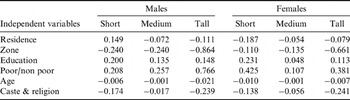
As shown in Table 10, the values of the coefficients changed drastically from one group to the other, and in one case (coefficient of place of residence for short males) the coefficient even changed sign. The greatest changes occurred in the case of tall persons. Again, the directions of the changes do not remain the same. For example, the value of the coefficient for poor/non-poor, reflecting economic condition, decreases from 0.425 to 0.107 going from short to medium height females, and then increases to 0.381 for tall females.
Movement of the regression coefficients as height increases when height is regressed on independent variables, India, NFHS-3, 2005–06

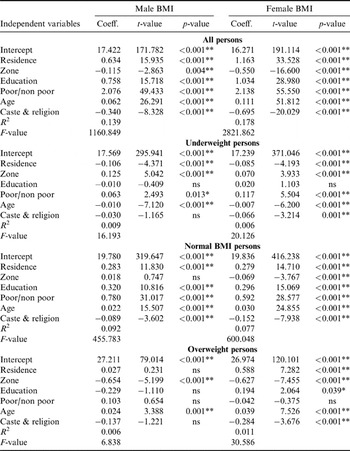
The results of the linear regression for BMI for all, underweight, normal and overweight persons on the explanatory variables are given in Tables 11. All the coefficients are found to be significant except for (i) the coefficient of education of underweight people, (ii) geographical zone for normal BMI males and (iii) education, place of residence, economic condition and caste & religion for overweight males, and, finally, economic condition for overweight females. The only significant coefficients for overweight males are zone and age.
Results of linear regression of BMIs of males and females aged 24–49 years on independent variables for different weight groups, India, NFHS-3, 2005–06

Residence: 1=urban, 0=rural; zone: 1=North-East & East, 0=North, Central, West & South; education: 0=illiterate, 1=literate; poor/non-poor: 0=poor, 1=non-poor; age: years completed; caste & religion: 0=Muslim, Christian & Other, 1=SC, ST & Gen Hindu.
*Significant at 5% level; **significant at 1% level.
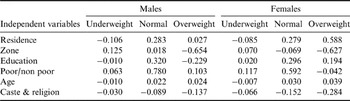
Table 12 summarizes the regression results for BMI for all groups. Here the change of signs from one group to the other is more pronounced than in the case of height. Also, the coefficients do not have the same trend. If the group of overweight males is ignored, then from the regression analyses it is seen that all the variables have a more or less significant role in determining heights and BMI, and even among the sub-groups of heights and BMI for both males and females. The most significant finding is that the coefficients, i.e. the rates of effects, do not remain the same for all the groups.
Movement of the regression coefficients as the BMI increases when BMI is regressed on independent variables, India, NFHS-3, 2005–06

Discussion
No doubt adult males will be taller than adult females. It leaves no scope for comparison. However, adult heights often differ significantly between population groups, and this may be due to genetic differences or childhood lifestyle differences, such as nutrition and physical labour. It is rightly thought that BMI, rather than height, should be taken into consideration to determine the health and nutrition status of adult males and females. Body mass index is also linked to socioeconomic and cultural factors. However, stature should not be sidetracked by saying that it is a genetic factor; it can be considered as a mean for comparison of health status between groups based on economic level, religion etc. The similarity of results for BMI and height with respect to the explanatory variables confirms this hypothesis.
Mendez et al. (Reference Mendez, Monteiro and Popkin2005) observed that the proportion of overweight exceeded the proportion of underweight in a majority of studied countries in both urban and rural areas. These results may not be applicable to many developing countries, despite the trends being in this direction. Overweight people are primarily concentrated in urban, higher socioeconomic status households.
Direct analysis, i.e. neglecting the influence of other variables, leads to the finding that mean adult heights in India are (i) higher in higher economic categories for both rural and urban places of residence, (ii) very small in the North-East and East zones, (iii) greatest in the North zone for both males and females. Similarly, mean BMIs are (i) consistently higher in higher economic groups, (ii) very small in the East zone, (iii) uniformly the highest in the South zone for both males and females. Mean height increases up to the age of 21 or 22, whereas BMI is an ever-increasing variable, especially among females. But do these findings carry forward when looking at the simultaneous influence or the effect for a subgroup of a population? The results of the present analysis suggests the answer is ‘no’.
When the regression analysis is performed for each subgroup of height and BMI the popular belief seem to be questioned. Short, medium and tall people, and underweight, normal and overweight people, show different features than the overall features in many cases. In the multiple linear regression there are simultaneous effects. The interpretation of any regression coefficient is made under the constraint that the values of the other variables are kept fixed. Secondly, subgroups were created according to height and BMI. The relations are not expected to be the same in each subgroup. Thus this type of analysis opens up a new direction, whereby the behaviour within subgroups can be seen, which may lead to different results than the overall results.
It can be proved that, in a multivariate normal distribution, the same linear relation holds for each level of the explained variable. The present data show different relations at different height and BMI levels. Thus the basic assumption of multivariate normality is not valid in this case. Some other multivariate distributional assumptions therefore need to be taken, which corroborate these results.
Regression analysis confirms that all the variables, namely, residence, zone, education, wealth index and caste & religion, have a significant role in determining heights and BMI, even among the subgroups of heights and BMI for both males and females.
It is well known that the North-East zone has been neglected for a long time. Recently a special drive has been taken by the Indian Government to improve the overall situation of the states in the North-East zone. This may have led to short-term nutritional gain in that zone, which is reflected in BMI level.
In the North Indian zone the average male height is higher than in other parts of India, which was also observed by Guntupalli & Baten (Reference Guntupalli and Baten2006). This is despite the fact that rapid population growth has accelerated pollution in this area. The North zone has the highest mean stature, mainly because this includes the states of Punjab and Haryan where people are much taller, and this is ascribed to genetic factors. This region is very fertile due to irrigation facilities and thus is very developed. This may also have an effect on the population's BMI status.