1. Introduction
Granular materials are pervasive in natural and industrial environments, and constitute, by mass, the second most processed material on Earth after water (Jaeger, Nagel & Behringer Reference Jaeger, Nagel and Behringer1996). Their flow behaviour governs diverse phenomena ranging from geophysical hazards such as landslides, avalanches and debris flows (Jaeger et al. Reference Jaeger, Nagel and Behringer1996; Iverson Reference Iverson1997), to industrial processes including hopper discharge, silo transport and particulate flow. Predictive modelling of these flows requires constitutive frameworks capable of bridging grain-scale interactions to macroscopic rheology. At the microscopic level, the discrete-element method (DEM) provides detailed information on particle kinematics and interparticle forces (Cundall & Strack Reference Cundall and Strack1979), but its substantial computational cost confines its applicability to relatively small or idealised domains. This limitation has motivated the development of continuum frameworks based on averaged fields of stress, strain rate and density. Yet even with their attractive scalability, continuum models remain challenged by the dissipative, history-dependent and inherently out-of-equilibrium nature of granular matter (Forterre & Pouliquen Reference Forterre and Pouliquen2008; Andreotti, Forterre & Pouliquen Reference Andreotti, Forterre and Pouliquen2013), which complicates efforts to formulate robust and universally applicable constitutive descriptions.
Unlike Newtonian fluids, whose behaviour is governed by the Navier–Stokes equations combined with well-established constitutive laws, granular assemblies can transition among solid-like, liquid-like and gas-like states depending on packing density, stress conditions and shear rate (GDR MiDi 2004; Forterre & Pouliquen Reference Forterre and Pouliquen2008). In the quasi-static regime, stresses are transmitted through long-lived, highly anisotropic force-chain networks (Radjai et al. Reference Radjai, Wolf, Jean and Moreau1998), while at the opposite extreme, dilute granular flows are dominated by binary collisions amenable to kinetic theory descriptions (Jenkins & Savage Reference Jenkins and Savage1983; Goldhirsch Reference Goldhirsch2003). Between these limits lies the dense inertial regime, which is ubiquitous in natural hazards and industrial processes, and is characterised by the coexistence of enduring frictional contacts and rapid collisional interactions. Developing continuum models capable of capturing these hybrid behaviours is therefore essential for advancing both fundamental understanding and predictive capabilities.
Continuum modelling of granular flows has expanded significantly beyond classical finite-element method and finite-volume method (FVM) approaches. Lagrangian particle-based methods, such as smoothed particle hydrodynamics (SPH) and the material point method (MPM), are particularly attractive for problems involving large deformations, free surfaces and topological changes, as they naturally avoid mesh tangling and re-meshing procedures (Dunatunga & Kamrin Reference Dunatunga and Kamrin2015, Reference Dunatunga and Kamrin2022; Wang & Wu Reference Wang and Wu2025). The lattice Boltzmann method (LBM), based on mesoscopic kinetic equations whose moments recover the Navier–Stokes equations, has also been explored for non-Newtonian rheology and multiphase interactions in granular systems (Yang et al. Reference Yang, Huang, Lu, Kwok, Sobral and Yao2023a
,
Reference Yang, Yang, Jing, Kwok and Sobralb
; Shen et al. Reference Shen, Qiu, Yuan and Liu2025). While these approaches are subject to ongoing algorithmic refinements to address specific numerical issues – such as grid-crossing effects in the MPM (Bardenhagen et al. Reference Bardenhagen2004; Sulsky & Kaul Reference Sulsky and Kaul2004), pressure regularisation in SPH (Swegle, Hicks & Attaway Reference Swegle, Hicks and Attaway1995; Randles & Libersky Reference Randles and Libersky1996), or high-shear interfaces in the LBM (Monaghan Reference Monaghan1994) – the central challenge remains the consistent integration of complex constitutive descriptions, such as the
 $\mu (I)$
rheology extended with granular temperature, into a continuum formulation. In this regard, the FVM provides a robust and well-established platform for incorporating such advanced models within a conventional computational fluid dynamics (CFD) solver.
Within such Eulerian frameworks, the
 $\mu (I)$
rheology has emerged as the most widely adopted continuum description for dense granular flows (Da Cruz et al. Reference Da Cruz, Emam, Prochnow, Roux and Chevoir2005; Jop, Forterre & Pouliquen Reference Jop, Forterre and Pouliquen2006). By prescribing the macroscopic friction coefficient as a function of the inertial number
 $I$
, it captures the rate-dependent strengthening observed in pressure-confined granular assemblies. When embedded within incompressible Navier–Stokes solvers, the
 $\mu (I)$
rheology has been shown to reproduce a range of free-surface granular flows – including column collapse, inclined-plane avalanches and confined shear layers – with good quantitative agreement with laboratory measurements and DEM simulations (Lacaze & Kerswell Reference Lacaze and Kerswell2009; Lagrée et al. Reference Lagrée, Staron and Popinet2011; Barker et al. Reference Barker and Gray2017). Despite its demonstrated capability, the
 $\mu (I)$
model is intrinsically local and cannot reproduce the non-local behaviours widely documented in experiments and simulations. These include sub-yield creep persisting below the nominal yield stress (Komatsu et al. Reference Komatsu, Inagaki, Nakagawa and Nasuno2001; Nichol et al. Reference Nichol, Zanin, Bastien, Wandersman and van Hecke2010), shear-band widths that scale with grain size (Fenistein & van Hecke Reference Fenistein and van Hecke2003), and boundary-driven motion extending into low-stress regions (DeGiuli, McElwaine & Wyart Reference DeGiuli, McElwaine and Wyart2016). Such behaviours arise from correlated particle rearrangements and long-range cooperativity mediated by force chains spanning multiple grain diameters (Reddy, Forterre & Pouliquen Reference Reddy, Forterre and Pouliquen2011; Clark et al. Reference Clark, Thompson, Shattuck, Ouellette and O’Hern2018). In addition, the governing equations may become ill-posed at high shear rates, leading to spurious short-wavelength instabilities that compromise numerical robustness (Barker et al. Reference Barker and Gray2017). Although various regularisation strategies have been proposed (Barker et al. Reference Barker, Schaeffer, Bohórquez and Gray2015; Barker & Gray Reference Barker and Gray2017), these do not address the fundamental physical mechanisms underlying non-locality.
Among extended continuum frameworks developed to account for non-local effects in dense granular flows, the non-local granular fluidity (NGF) model has played a central and influential role (Kamrin & Koval Reference Kamrin and Koval2012; Henann & Kamrin Reference Henann and Kamrin2014). Motivated by the inability of strictly local inertial rheologies to capture cooperative grain rearrangements near yielding, the NGF approach introduces a scalar granular fluidity field
 $g$
that quantifies the local propensity for flow, and relates the shear strain rate to the stress ratio through an associated flow rule (Henann & Kamrin Reference Henann and Kamrin2014). Non-local coupling is incorporated by prescribing a diffusion–reaction evolution equation for
 $g$
, which is characterised by a stress-dependent cooperativity length that sets the spatial range of non-local interactions. With this structure, the NGF framework has been shown to successfully reproduce a wide range of experimentally and numerically observed non-local behaviours in canonical configurations, including sub-yield creep sustained by neighbouring shear zones, finite-width shear bands, and the coexistence of flowing and quasi-static regions under uniform driving (Kamrin et al. Reference Kamrin, Hill, Goldman and Andrade2024). As with other phenomenological continuum descriptions, certain aspects of the NGF formulation require careful interpretation in practical applications: the granular fluidity field acts as an effective internal variable rather than a directly measurable microscopic quantity, the cooperativity length typically requires calibration, and model predictions may depend on the specification of boundary conditions for
 $g$
, particularly in complex geometries or strongly heterogeneous flows. These considerations do not detract from the demonstrated utility of the NGF framework, but instead motivate the exploration of complementary non-local descriptions in which the governing state variable is more directly connected to measurable grain-scale dynamics.
A conceptually distinct route to non-local effects in dense granular flows is to introduce granular temperature – the fluctuational kinetic energy associated with deviations of particle velocities from the mean flow – as an internal state variable governing cooperative grain dynamics (Ogawa, Umemura & Oshima Reference Ogawa, Umemura and Oshima1980; Jenkins & Savage Reference Jenkins and Savage1983; Goldhirsch Reference Goldhirsch2003). Within this framework, granular temperature obeys a transport equation that incorporates advection, diffusion, production and dissipation, thereby enabling fluctuation energy generated in strongly sheared regions to propagate into neighbouring low-shear zones. Such fluctuation-mediated transport provides a physically grounded mechanism for sustaining creep and other sub-yield motions beyond the predictions of a purely local yield condition (Berzi Reference Berzi2024; Irmer, Brodsky & Clark Reference Irmer, Brodsky and Clark2025). A key methodological advantage of this approach is that granular temperature is a physically defined and experimentally accessible quantity. In laboratory experiments, it can be inferred from particle-scale kinematics obtained via high-speed imaging or particle-tracking velocimetry, using temporal averaging in statistically steady flows or instantaneous, locally coarse-grained fluctuation statistics (i.e. the velocity variance about a local mean within a spatial bin/interrogation window) in transient configurations (Wiederseiner et al. Reference Wiederseiner, Andreini, Epely-Chauvin and Ancey2011; Sanvitale & Bowman Reference Sanvitale and Bowman2016; Taylor-Noonan et al. Reference Taylor-Noonan, Gollin, Bowman and Take2021). In discrete-element simulations, granular temperature arises directly from resolved particle velocities without the need for additional constitutive assumptions, thereby enabling transparent comparisons between experiments, simulations and continuum descriptions.
Building on this framework, recent studies have demonstrated that the effective friction coefficient can be expressed as a joint function of the inertial number and granular temperature, yielding a closure relation that links particle-scale fluctuations to macroscopic stress in a physically interpretable and experimentally testable manner (Kim & Kamrin Reference Kim and Kamrin2020; Irmer et al. Reference Irmer, Brodsky and Clark2025). Owing to its reliance on a measurable state variable and a relatively parsimonious constitutive structure, this approach has been extended to a wide range of granular systems, including wet, submerged and polydisperse assemblies (Hao & Guo Reference Hao and Guo2023; Breard, Fullard & Dufek Reference Breard, Fullard and Dufek2024; Han et al. Reference Han, Zhao and Wang2025; Zhao et al. Reference Zhao, Yuan, Han and Wang2025).
Building on these developments, the present study formulates a granular-temperature-augmented
 $\mu (I)$
rheology within a fully conservative finite-volume Navier–Stokes framework. By coupling a transport equation for fluctuation energy to the inertial rheology, granular temperature emerges as a dynamically evolving non-local state variable that mediates the connection between particle-scale velocity fluctuations and macroscopic stress. The formulation is assessed using canonical configurations in which non-local effects are known to play a central role, including steady heap flows and split-bottom Couette shear flows, and is further examined in transient regimes through simulations of granular column collapse. These test cases demonstrate that the incorporation of granular temperature enables a unified continuum description of sub-yield creep, shear-band broadening and rate-dependent inertial flow within a single framework, while maintaining numerical robustness and compatibility with free-surface flow modelling. In contrast to non-local fluidity-based approaches, the present formulation retains a weak but finite diffusion of fluctuation energy from rapidly sheared surface layers into deeper creeping regions, even in the quasi-static limit, leading to a decay length that exhibits a mild rate dependence. From a numerical perspective, a phase-shielding strategy is adopted within the finite-volume discretisation of the granular temperature equation, whereby all active terms are weighted by the granular-phase volume fraction. This treatment confines fluctuation dynamics strictly to the granular phase, suppresses non-physical diffusion across phase interfaces, and significantly enhances the robustness and physical consistency of the volume-of-fluid (VOF)–granular-rheology coupling.
2. Granular-temperature-modified
 $\mu (I)$
rheology

In dense inertial granular flows, stresses are transmitted through a combination of enduring frictional contacts and frequent collisional interactions. Constitutive closures are therefore required to relate the shear stress to the imposed deformation rate. Local rheological descriptions assume that the stress state at a point depends exclusively on local quantities such as shear rate, pressure and particle size, without accounting for spatial coupling with neighbouring regions.
The
 $\mu (I)$
rheology represents the canonical local closure for dense inertial flows (Da Cruz et al. Reference Da Cruz, Emam, Prochnow, Roux and Chevoir2005; Jop et al. Reference Jop, Forterre and Pouliquen2006). It defines the effective friction coefficient
 $\mu$
as the ratio of shear stress
 $\tau$
to pressure
 $P$
, and relates
 $\mu$
to the inertial number
 $I$
:
 \begin{equation} I=\frac {\dot {\gamma }d}{\sqrt {P/\rho _s}}, \end{equation}
where
 $\dot {\gamma }$
is the shear rate,
 $d$
is the particle diameter, and
 $\rho _s$
is the particle density. The inertial number
 $I$
quantifies the ratio of a microscopic rearrangement time scale
 $d/\sqrt {P/\rho _s}$
and a macroscopic deformation time scale
 $1/\dot {\gamma }$
(GDR MiDi 2004). A widely adopted functional form of the
 $\mu (I )$
relation (Jop, Forterre & Pouliquen Reference Jop, Forterre and Pouliquen2005) is
 \begin{equation} \mu \left (I\right )=\mu _s+\frac {\mu _2-\mu _s}{I_0/I+1}, \end{equation}
where
 $\mu _s$
and
 $\mu _2$
denote the quasi-static and dynamic friction limits, and
 $I_0$
is a characteristic inertial number. This formulation has been successfully applied to configurations ranging from inclined-plane flows to column collapses, and forms the foundation for many continuum solvers. Nevertheless, its purely local nature prevents it from reproducing non-local behaviours such as persistent creep, broad shear bands, and boundary-driven motion in low-stress regions (Jop, Forterre & Pouliquen Reference Jop, Forterre and Pouliquen2007; Clark et al. Reference Clark, Thompson, Shattuck, Ouellette and O’Hern2018).
To address these limitations, particle velocity fluctuations can provide a natural extension (Zhang & Kamrin Reference Zhang and Kamrin2017). In analogy to molecular temperature, granular temperature
 $T$
represents the fluctuational kinetic energy associated with particle velocities generated by collisions and rearrangements. Its dimensionless form is commonly defined as
 $\varTheta =\rho T/P$
, where
 $T$
is the fluctuational energy per unit mass. Unlike the abstract fluidity field used in the NGF framework, granular temperature is experimentally measurable through imaging or particle tracking, and is readily available in DEM simulations.
Recent studies indicate that as fluctuation intensity increases, the stress ratio deviates from the single-valued
 $\mu (I)$
law. This softening can be captured by a granular-temperature-modified rheology of the form (Kim & Kamrin Reference Kim and Kamrin2020)
 \begin{equation} \mu \varTheta ^p=f(I), \end{equation}
where
 $p$
is a dimension-dependent exponent extracted from DEM simulations:
 $p \approx 1/6$
for three-dimensional spheres, and
 $p\approx 1/8$
for two-dimensional disks. These exponents are obtained from multivariate linear regressions of
 $\log {\mu }$
and
 $\log {\varTheta }$
within narrow inertial-number windows. Notably, the small magnitudes of
 $p$
are consistent with critical-like behaviour near the jamming transition, where stress, fluctuations, and characteristic velocities display weak power-law scaling with small critical exponents (O’Hern et al. Reference O’Hern, Silbert, Liu and Nagel2003; van Hecke Reference van Hecke2009). Rescaling
 $\mu$
by
 $\varTheta ^p$
collapses data from simple shear, gravity-driven shear layers, inclined-chute flows, and concave geometries – across a range of particle-friction coefficients – onto a single master curve. This demonstrates a robust, geometry-independent softening governed by granular temperature. The relation remains valid even for flows without discernible non-local effects, where both
 $\mu$
and
 $\varTheta$
reduce to single-valued functions of
 $I$
. A practical constitutive relation is therefore expressed as
 \begin{equation} \mu (I,\varTheta )=\mu _{\textit{loc}}(I)\left(\frac {\varTheta _{\textit{loc}}(I)}{\varTheta }\right)^p \!, \end{equation}
where
 $\mu _{\textit{loc}}(I)$
follows the functional form given in (2.3), while the local granular temperature is fitted as
 $\varTheta _{\textit{loc}}(I) \propto I^a$
. The exponent
 $a$
typically takes values
 $3/2$
for frictional hard spheres,
 $1$
for frictionless particles, and
 $2$
as predicted by soft-sphere kinetic theory (Berzi & Jenkins Reference Berzi and Jenkins2015; Irmer et al. Reference Irmer, Brodsky and Clark2025).
In the limit of negligible fluctuation transport – namely, when the shear-induced velocity fluctuations are generated locally and remain confined to the region of production – the granular temperature collapses to its local value
 $\varTheta =\varTheta _{\textit{loc}}(I)$
. In this strictly local-agitation regime, the stress response is governed solely by the instantaneous shear rate and pressure, and the constitutive relation naturally reduces to
 $\mu (I,\varTheta )=\mu _{\textit{loc}}(I)$
, thereby recovering the classical
 $\mu (I)$
rheology for inertial dense flows. When non-local effects become appreciable, however, the transport of agitation contributes through
 $\varTheta$
, embedding cooperative softening directly within a
 $\mu (I)$
-type framework. Physically, granular temperature weakens force-chain anisotropy and the strength of the stress-bearing contact network, offering a mechanistic basis for the non-local reduction of friction observed in creeping, weakly sheared and heterogeneous flow regions (Bathurst & Rothenburg Reference Bathurst and Rothenburg1990; Irmer et al. Reference Irmer, Brodsky and Clark2025). By incorporating fluctuation transport into the
 $\mu (I)$
formulation, the
 $\mu (I,\varTheta )$
rheology retains the predictive capability of inertial models while extending their applicability to flows dominated by creep, shear localisation and long-range relaxation. This yields a continuum framework that is both theoretically well grounded and experimentally accessible.
3. Computational framework
Continuum modelling of granular flows requires the integration of constitutive rheological closures with numerical solvers that ensure strict conservation of mass and momentum while resolving complex flow geometries. In this study, the governing equations are discretised using the FVM, which provides a conservative and flexible framework widely adopted in CFD (Moukalled, Mangani & Darwish Reference Moukalled, Mangani and Darwish2016). Rheological closure is achieved through the granular-temperature-modified
 $\mu (I)$
formulation (hereinafter referred to as the
 $\mu (I,\varTheta )$
model), in which granular temperature
 $\varTheta$
is introduced as an additional state variable to account for velocity fluctuations and non-local transport. Embedding this rheology into a conservative CFD framework yields a unified modelling strategy capable of predicting dense granular flows across regimes dominated by both local inertial effects and non-local cooperative dynamics.
3.1.
The VOF method coupled with
$\mu (I,\varTheta )$
rheology

Granular flows in both natural and industrial contexts often involve complex free-surface dynamics, such as column collapse, heap formation and landslide runout, where interfaces undergo large deformations, fragmentation, and topological transitions. To resolve these processes within a continuum solver, the VOF method (Versteeg Reference Versteeg2007) is employed. In this approach, the granular–air interface is described by a scalar volume-fraction field
 $\alpha$
, advected with the local velocity field and discretised within the FVM. This ensures strict phase conservation, accurate reconstruction of interfaces, and robustness in handling topological transitions, thereby providing a consistent foundation for coupling free-surface evolution with rheological closures.
The governing equations of the VOF framework comprise the continuity equation, the transport equation for
 $\alpha$
, and the momentum balance. Together, they provide a complete description of multiphase dynamics. For dense granular flows at low to moderate velocities, incompressibility is assumed, yielding the continuity condition
 \begin{equation} \boldsymbol{\nabla }\boldsymbol{\cdot }\boldsymbol{u}=0, \end{equation}
where
 $\boldsymbol{u}$
denotes the velocity vector field. The volume-fraction transport equation is expressed as
 \begin{equation} \frac {\partial \alpha }{\partial t}+\boldsymbol{\nabla }\boldsymbol{\cdot }\left (\boldsymbol{u}\alpha \right )+\boldsymbol{\nabla }\boldsymbol{\cdot }\left [\boldsymbol{u}_r\alpha \left (1-\alpha \right )\right ]=0, \end{equation}
where
 $\alpha \in [0,1]$
represents the granular-phase volume fraction. Specifically,
 $\alpha =1$
indicates that the cell is fully occupied by the granular phase,
 $\alpha =0$
corresponds to a cell fully occupied by the gas phase, and
 $0\lt \alpha \lt 1$
denotes interfacial cells. The third term is an artificial compression term, with
 $\boldsymbol{u}_r$
denoting the relative interphase velocity. This contribution acts primarily in the interface region (typically around
 $\alpha$
approaching
 $\alpha \approx 0.5$
) to counteract numerical diffusion, thus sharpening the interface and improving stability (Jasak Reference Jasak1996).
The momentum conservation equation is written as
 \begin{equation} \frac {\partial (\rho \boldsymbol{u})}{\partial t}+\boldsymbol{\nabla }\boldsymbol{\cdot }\left (\rho \boldsymbol{uu}\right )=\boldsymbol{\nabla }\boldsymbol{\cdot }\left (\eta\boldsymbol{\nabla }\boldsymbol{u}\right )+\left (\boldsymbol{\nabla }\boldsymbol{u}\right )\boldsymbol{\cdot }\left (\boldsymbol{\nabla }\eta \right )-\boldsymbol{\nabla }\!p_{\textit{eff}}- \textit{Gh}\,\boldsymbol{\nabla }\!\rho . \end{equation}
To improve numerical conditioning and stabilise the pressure solution, we employ the dynamic pressure
 $p_{\textit{eff}}=p-\rho \textit{Gh}$
, which separates the dynamic and hydrostatic contributions of the pressure gradient. The mixture density and viscosity are obtained via volume-fraction weighting,
 $\rho =\alpha \rho _{{g}}+(1-\alpha )\rho _{\textit{air}}$
and
 $\eta =\alpha \eta _{{g}}+(1-\alpha )\eta _{\textit{air}}$
, where the subscripts ‘g’ and ‘air’ denote the granular and gas phases, respectively. Because the viscosity field
 $\eta$
varies spatially across the two-phase interface, the viscous term in (3.3) comprises both the standard diffusion contribution
 $\boldsymbol{\nabla }\boldsymbol{\cdot }(\eta\boldsymbol{\nabla }\boldsymbol{u})$
and the additional term
 $(\boldsymbol{\nabla }\boldsymbol{u})\boldsymbol{\cdot }\boldsymbol{\nabla }\eta$
, which accounts for the effects of viscosity gradients across the two-phase interface.
A distinctive feature of the present framework is the determination of the effective granular viscosity
 $\eta _g$
through the
 $\mu (I,\varTheta )$
rheology. It is expressed as
 \begin{equation} \eta _g=\frac {\mu (I,\varTheta )\,P}{\left |\dot {\gamma }\right |}, \end{equation}
where
 $|\dot {\gamma }|$
is the shear-rate magnitude, and
 $\mu (I,\varTheta )$
represents the constitutive relation relating the stress ratio to both the inertial number
 $I$
and granular temperature
 $\varTheta$
, as defined in (2.4). The granular temperature
 $\varTheta$
is explicitly solved through a transport equation proposed by Irmer et al. (Reference Irmer, Brodsky and Clark2025):
 \begin{equation} t_0\dot {\varTheta }=Dd^2\,{\nabla}^2\varTheta -B\varTheta +AI^a, \end{equation}
where
 $t_0$
is the characteristic elastic collision time,
 $D$
represents the diffusivity of granular temperature,
 $B$
quantifies collisional dissipation, and
 $A$
prescribes the local production of velocity fluctuations. These coefficients appearing in (3.5) retain an explicit parametric dependence on the coefficient of restitution through order-unity prefactors, although their overall sensitivity to restitution is expected to remain weak in the dense granular flows considered here. The exponent
 $a$
retains its kinetic theory interpretation. The diffusion term allows fluctuation energy to propagate over distances of several particle diameters, thereby incorporating non-local stress transmission, while the source term models production from shear or vibrating boundaries. Equation (3.5) is intended for dense, contact-dominated granular flows, where velocity fluctuations are governed by frictional multi-body interactions. In this regime, it provides closure to the momentum balance via the
 $\mu (I,\varTheta )$
rheology, whereas dilute, collision-dominated flows are more appropriately described by kinetic-theory-based models. Discrete-element simulations of oscillatory shear flows further demonstrate that boundary-driven granular temperature scales with the square of the vibration velocity amplitude (Irmer et al. Reference Irmer, Brodsky and Clark2025), yielding a dimensionless wall temperature proportional to
 $A^2(2\pi f)^2$
. When only local effects are considered, the unsteady, convective and diffusive contributions in (3.5) vanish, and the granular temperature reduces to the local expression
 \begin{equation} \varTheta _{\textit{loc}}=\frac {A}{B}I^{3/2}. \end{equation}
Under this simplification, the two-phase VOF framework reduces to a single-phase formulation applicable to dense granular flows. In this case, the interface-tracking equation is omitted, and in the momentum balance, the buoyancy contribution
 $-\textit{Gh} \boldsymbol{\nabla }\!\rho$
vanishes due to constant density. The viscosity gradient term
 $(\boldsymbol{\nabla }\boldsymbol{u})\boldsymbol{\cdot }\boldsymbol{\nabla }\eta$
, however, must still be retained because
 $\eta _g$
remains spatially variable through its dependence on
 $\mu (I,\varTheta )$
. The continuity equation remains unchanged.
3.2. Discretisation and iterative schemes
The numerical implementation is carried out within the OpenFOAM
 $\circledR$
platform using a finite-volume formulation. All governing equations are discretised in a cell-centred framework, with surface and volume integrals evaluated through Gauss’ theorem (Rusche Reference Rusche2002; Versteeg Reference Versteeg2007). Temporal derivatives are advanced using a first-order implicit Euler scheme, which provides unconditional stability while preserving computational efficiency. Convective terms are discretised with a second-order linear upwind scheme combined with gradient reconstruction (Beam & Warming Reference Beam and Warming1976), whereas diffusive terms employ central differencing. For non-orthogonal meshes, explicit correction terms are applied to maintain second-order accuracy (Ferziger, Perić & Street Reference Ferziger, Perić and Street2019). Pressure-gradient and surface-tension contributions are interpolated at cell faces to enforce strict momentum conservation (Rhie & Chow Reference Rhie and Chow1983).
The volume-fraction transport equation is solved using the multidimensional universal limiter for explicit solution (MULES) algorithm (Weller et al. Reference Weller, Tabor, Jasak and Fureby1998), which applies flux-corrected transport (Zalesak Reference Zalesak1979; Deshpande, Anumolu & Trujillo Reference Deshpande, Anumolu and Trujillo2012) to ensure boundedness of the volume fraction while minimising interface smearing. Coupling between pressure and velocity fields is achieved through the PIMPLE algorithm (Issa Reference Issa1986; Holzmann Reference Holzmann2016), which integrates SIMPLE-type outer iterations with PISO-type inner corrections. Within each time step, the algorithm proceeds sequentially through momentum prediction, pressure correction via a Poisson equation derived from continuity, and velocity correction to restore incompressibility. Multiple PISO iterations are adopted to accelerate convergence.
Viscosity and friction coefficients are updated explicitly after each pressure–velocity loop. To maintain numerical stability, the effective viscosity is bounded according to
 $\eta _{\textit{min}}\le \eta \le \eta _{\textit{max}}$
, where
 $\eta _{\textit{min}}$
prevents divergence, and
 $\eta _{\textit{max}}$
accommodates the elevated viscosities characteristic of quasi-static regimes. Previous
 $\mu (I)$
implementations often set
 $\eta _{\textit{max}}$
consistent with the Drucker–Prager yield condition. In the present work, where non-local quasi-static effects are emphasised, excessively small upper limits truncate the relevant range of viscosities, whereas overly large values promote spurious oscillations. Numerical tests indicate that adopting
 $\eta _{\textit{max}}$
two orders of magnitude larger than conventional
 $\mu (I)$
choices yields stable and physically consistent results (Lagrée et al. Reference Lagrée, Staron and Popinet2011). Similar constraints are applied to the effective friction coefficient, with the lower bound prescribed as
 $\mu _s=0.1$
, and the upper bound limited to suppress numerical instabilities (Kim & Kamrin Reference Kim and Kamrin2020).
The granular-temperature transport equation is discretised using the FVM. Time integration is performed with a first-order implicit Euler scheme, while convective fluxes are approximated using a first-order upwind discretisation. Within the present VOF formulation, the granular-temperature equation is formally advanced everywhere, although granular temperature is physically meaningful only within the granular phase. To localise the dynamics of the granular temperature
 $\varTheta$
to prevent spurious numerical spreading into the pure-fluid region, a phase-shielding strategy based on the granular volume fraction
 $\alpha$
is introduced. The resulting fully discrete implicit form of the transport equation reads
 \begin{equation} \begin{aligned} & \underbrace { \frac {\alpha _P (\varTheta _P^{n+1} - \varTheta _P^n)}{\Delta t} V_P }_{\text{time derivative term}} + \underbrace { \sum _f \alpha _f F_f \varTheta _f^{{upwind}} }_{\text{convection term}} - \underbrace { \sum _f \alpha _f D_{\!f} (\boldsymbol{\nabla }\varTheta )_f \boldsymbol{\cdot }\boldsymbol{S}_f }_{\text{diffusion term}} \\ & =\underbrace { \alpha _P V_P (-B t_0^{-1} \varTheta _P^{n+1} + A t_0^{-1} I_P^{3/2}) }_{\text{source term}} - \underbrace { (1 - \alpha _P) \chi _{\textit{air}} \varTheta _P^{n+1} V_P }_{\text{air-phase damping}}, \end{aligned} \end{equation}
where superscripts
 $n$
and
 $n+1$
denote successive time levels. The subscript
 $P$
refers to the control volume, and
 $f$
denotes the cell face. The quantities
 $\alpha _P$
and
 $\alpha _f$
represent the granular volume fraction at the cell centre and the cell face, respectively. The volumetric flux across face
 $f$
is defined as
 $F_f=\boldsymbol{u}_f\boldsymbol{\cdot }\boldsymbol{S}_f$
, where
 $\boldsymbol{S}_f$
is the face area vector. The upwind value
 $\varTheta _f^{{upwind}}$
is taken as
 $\varTheta _P^{n+1}$
if
 $F_f\geq 0$
, and
 $\varTheta _N^{n+1}$
otherwise, with
 $N$
denoting the neighbouring cell. The diffusion coefficient is defined as
 $D_{\!f}=Dd_g^2t_0^{-1}$
. For numerical stability, the dissipation term
 $-Bt_0^{-1}\varTheta _P^{n+1}$
is treated implicitly, whereas the production term
 $At_0^{-1}I_P^{3/2}$
is evaluated explicitly.
From a physical perspective, the volume-fraction weighting confines the transport, production and dissipation of granular temperature to regions occupied by grains. The additional damping term proportional to
 $(1-\alpha _P)$
enforces a rapid decay of
 $\varTheta$
at the phase interface, and ensures that granular temperature remains negligible in the pure-fluid phase. From a numerical perspective, this phase-shielding strategy suppresses spurious diffusion of
 $\varTheta$
across the interface, and prevents unphysical activation of the
 $\mu (I,\varTheta )$
rheology in fluid-only regions, thereby enhancing the robustness of the coupled VOF–granular rheology framework.
Model parameters are prescribed as follows. The elastic collision time scale is given by
 $t_0=d\sqrt {\rho /E}$
, with representative particle parameter
 $d=0.5\times 10^{-3}$
m,
 $\rho =2450$
 $\mathrm{kg\,m^{-3}}$
, and
 $E=1.3\times 10^7$
 $\mathrm{Pa}$
. Following Irmer et al. (Reference Irmer, Brodsky and Clark2025), the granular-temperature decay length
 $\sqrt {D/B}$
is of order unity under strong vibration (
 $\varGamma \gt 10$
), and varies between 1 and 4 under weaker forcing. In the present work, we adopt
 $D=1$
and
 $B=1$
, consistent with kinetic theory scaling. Using the scaling relation
 $\varTheta _{\textit{loc}}\propto I^{3/2}$
, we choose
 $A/B=0.15$
, yielding
 $A=0.15$
. The granular material considered in the computational examples corresponds to glass beads, for which the rheological parameters are specified as
 $\mu _s=0.38$
,
 $\mu _2=0.64$
and
 $I_0=0.279$
.
The overall solution procedure follows a segregated strategy. Within each time step, the solver advances sequentially through the volume-fraction equation, momentum prediction, pressure Poisson equation and velocity correction. Outer iterations are performed to ensure global convergence. A schematic representation of the iterative process is shown in figure 1.
Algorithm flowchart. The two-phase flow solution in this work is based on interFoam, while the single-phase flow solution is based on pimpleFoam. Both employ an alternating inner–outer iteration scheme, with the distinction that two-phase flow solution requires prior solution of the phase-fraction equation.

3.3. Implementation of boundary conditions
Accurate representation of boundary conditions is essential for capturing velocity and granular-temperature distributions in creeping regions adjacent to confining walls. Since the FVM is based on flux variables, direct implementation of Coulomb-type frictional boundary conditions is not straightforward. Techniques such as Lagrange multipliers or penalty methods, commonly used in finite-element approaches (Simo & Laursen Reference Simo and Laursen1992; Huněk Reference Huněk1993; Ferrás et al. Reference Ferrás, Nóbrega and Pinho2013), are not directly applicable in the present framework. To address this challenge, a Navier-type partial-slip condition is employed. The tangential velocity at the boundary is expressed as
 \begin{equation} \boldsymbol{u}_b=f\boldsymbol{\cdot }\boldsymbol{u}_{\textit{ref}}+\left (1-f\right )\boldsymbol{\cdot }\left (\boldsymbol{I}-\hat {\boldsymbol{n}}\otimes \hat {\boldsymbol{n}}\right )\boldsymbol{\cdot }\boldsymbol{u}_o, \end{equation}
where
 $f$
denotes the slip coefficient controlling the degree of slip,
 $\boldsymbol{u}_{\textit{ref}}$
is the reference velocity (zero in the present context),
 $\boldsymbol{I}$
is the identity tensor,
 $\hat {\boldsymbol{n}}$
is the outward unit normal at the boundary, and
 $\boldsymbol{u}_o$
represents the velocity of the adjacent control volume. This formulation interpolates between the no-slip limit (
 $f=1$
) and perfect slip (
 $f=0$
), thereby providing a flexible representation of wall–particle interactions. In the present simulations, the coefficient
 $f$
is calibrated against experimental flow-rate scaling to ensure consistency with observed bulk behaviour.
For the granular-temperature field, zero-gradient Neumann boundary conditions are imposed to avoid physically inconsistent constraints. As granular temperature is generated by particle vibration and quantifies velocity fluctuations, it is particularly sensitive to boundary specification. When vibration acts as an external energy source, Dirichlet-type conditions can be prescribed in terms of excitation amplitude and frequency (Irmer et al. Reference Irmer, Brodsky and Clark2025). However, the assumption of vanishing granular temperature at a rough, fixed base is valid only in creeping regimes where the velocity profile decays exponentially. Numerous experimental and numerical studies have shown that in dense inertial flows with Bagnold-type profiles, the granular temperature remains finite near the wall; indeed, for frozen-particle base boundaries, its magnitude can remain comparable to bulk values (Bharathraj & Kumaran Reference Bharathraj and Kumaran2019). These observations indicate that enforcing
 $\varTheta =0$
at the boundary would amount to imposing an artificial dissipation sink and is generally inappropriate for dense flows. Instead, the zero-gradient Neumann condition provides a consistent and robust approximation, ensuring compatibility with both creeping and inertial flow regimes.
Schematic diagram of steady dense granular flow calculation.

4. Steady heap flow
4.1. Flow configuration and model validation
Steady heap flows constitute a canonical benchmark for assessing granular rheological models, as they exhibit two distinct regimes within a single configuration. At the free surface, a rapid flowing layer develops whose thickness
 $h$
scales with the imposed volumetric flux
 $Q$
and is well described by local inertial rheology. Beneath this layer, however, the material undergoes slow creeping motion characterised by exponentially decaying velocities with depth. The decay length
 $\lambda$
, which governs the quasi-static region, depends only on system geometry and remains independent of
 $Q$
, thereby reflecting the intrinsic role of non-local effects.
Heap-flow experiments are often favoured because they generate stable, quasi-steady configurations suitable for statistical analysis and the derivation of scaling relations between flow rate and surface properties (Jop et al. Reference Jop, Forterre and Pouliquen2005). In numerical studies, however, channel-flow geometries are frequently adopted, primarily for computational efficiency: plane shear assumptions reduce three-dimensional problems to two dimensions (Liu & Henann Reference Liu and Henann2017), and boundary conditions are simplified. Despite these differences, both heap and channel flows display the same essential phenomenology, namely the coexistence of a rapid surface layer and a creeping bulk.
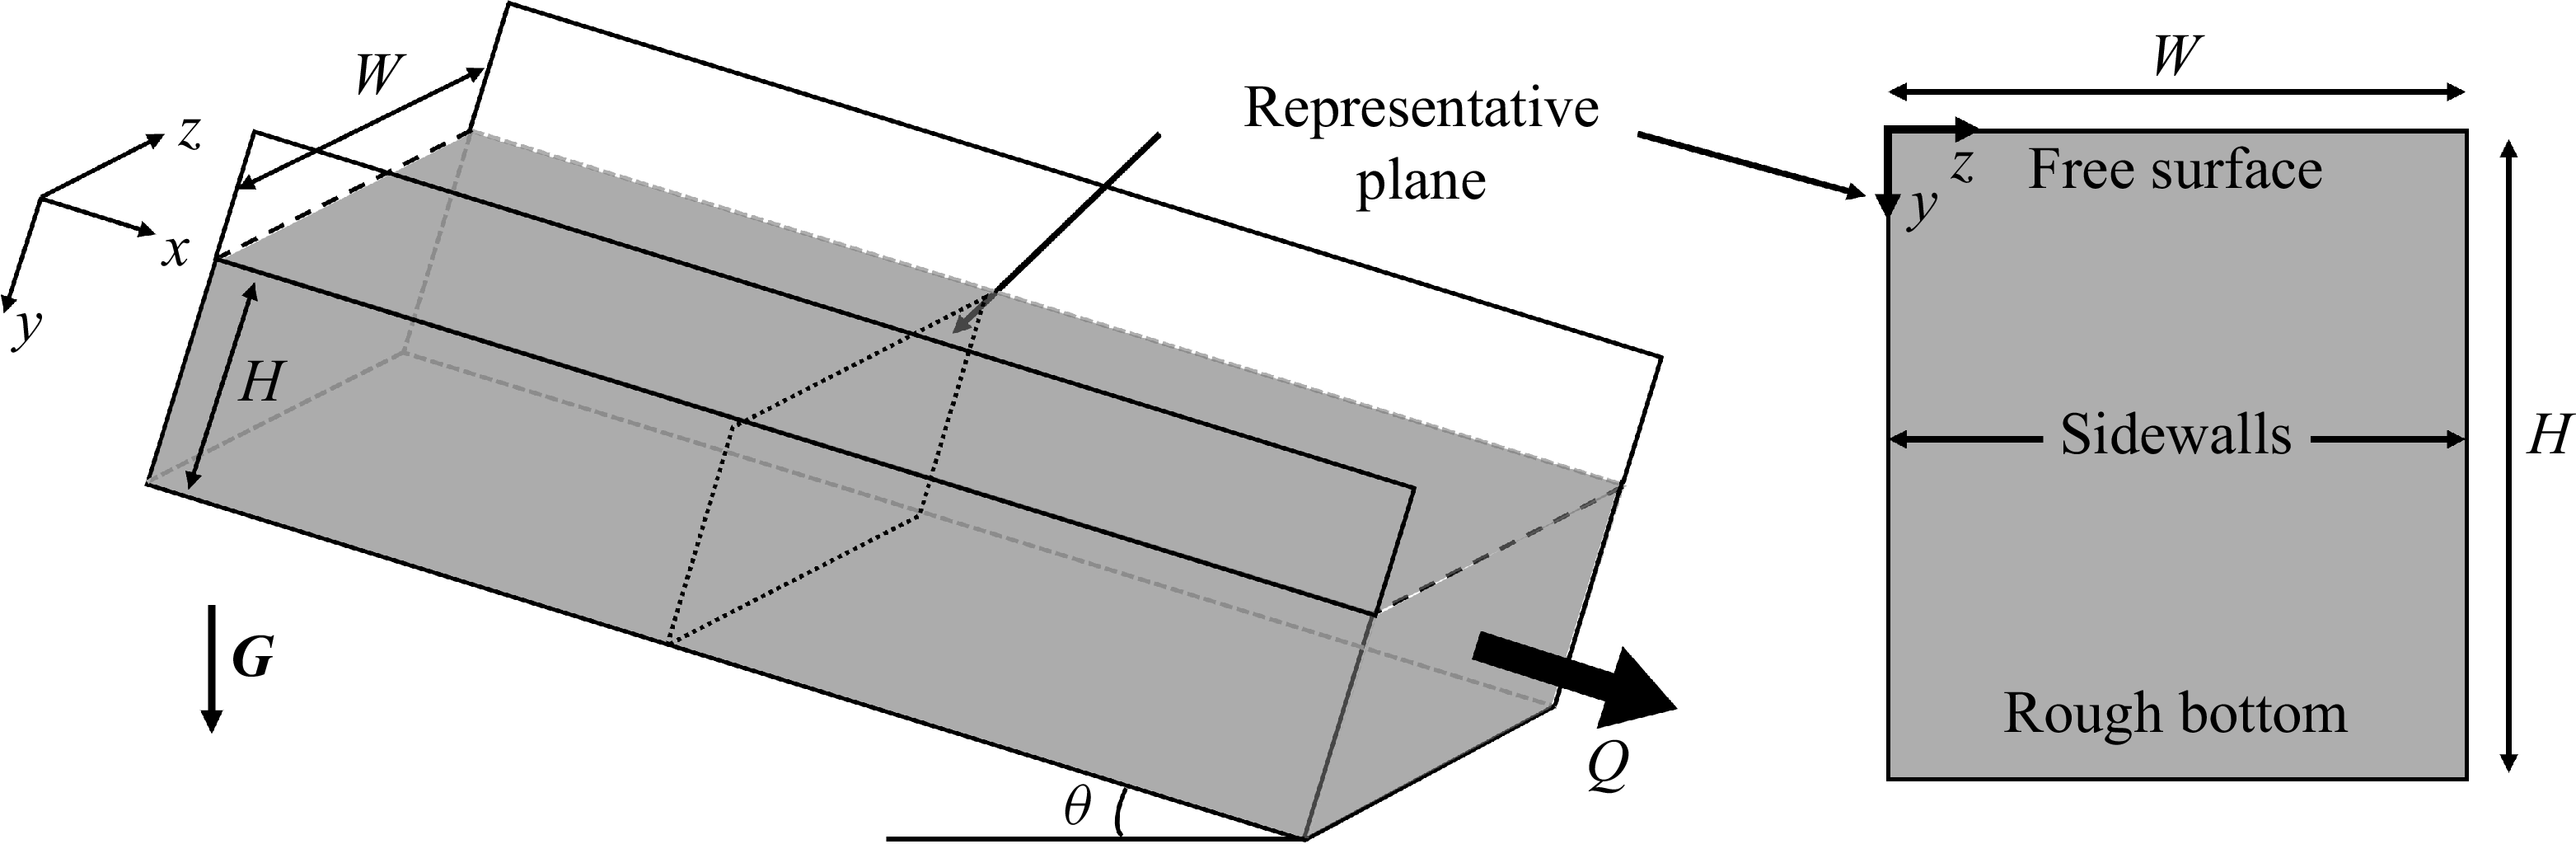
In the present study, we consider the classical configuration of gravity-driven channel flow (figure 2). A granular layer of depth
 $H$
is confined between two glass plates separated by width
 $W$
and inclined at angle
 $\theta$
. Boundary conditions are specified as follows. The basal surface is modelled as rough and no-slip. The sidewalls are treated as frictional boundaries using partial-slip boundary conditions. At the top, a free-slip boundary condition is imposed, corresponding to zero shear stress and zero normal velocity at the free surface. For the pressure field, a zero gauge pressure is prescribed at the free surface, while zero-gradient (Neumann) boundary conditions are applied at the base and the sidewalls.
Steady-state simulations are performed for inclined channel flows. Convergence is deemed to be achieved when two criteria are satisfied simultaneously. First, the normalised residuals of velocity and pressure obtained from the solid-phase governing equations, together with the normalised residual of the granular temperature obtained from the granular-temperature transport equation, all decrease below
 $10^{-4}$
. Second, the relative variation of the volumetric flux between successive iterations is less than
 $1\,\%$
. To minimise basal boundary effects, the channel depth is fixed at
 $H/d=20$
. All velocities are normalised by
 $\sqrt {Gd}$
. The resulting velocity fields reproduce the characteristic features of heap flows, including a reduction of velocity adjacent to the sidewalls, and enhanced transport in the channel core.
Flow field velocity contours and wall velocity distribution calculated in narrow channels with
 $W/d=19$
. Normalised velocity contours obtained using the
 $\mu (I,\varTheta )$
model at (a)
 $\theta =26.1^\circ$
and (b)
 $\theta =28.0^\circ$
. Distribution of normalised wall velocity versus normalised depth in (c) linear coordinates and (d) semi-logarithmic coordinates. Solid lines represent the
 $\mu (I,\varTheta )$
model, dashed lines represent the
 $\mu (I)$
model, dash-dotted lines represent the NGF model with results extracted from Liu & Henann (Reference Liu and Henann2017), and symbols represent experimental data from Jop et al. (Reference Jop, Forterre and Pouliquen2007).

Figure 3 summarises the simulation results for narrow channels with
 $W/d=19$
. Figures 3(a,b) show normalised velocity contours at inclination angles
 $\theta =26.1^\circ$
and
 $\theta =28.0^\circ$
, respectively. In both cases, the
 $\mu (I,\varTheta )$
model captures the key flow features observed in experiments, namely reduced wall velocities and accelerated transport along the channel centreline. Figures 3(c,d) present depth-dependent wall velocity profiles in linear and semi-logarithmic coordinates. Both the
 $\mu (I,\varTheta )$
and NGF models successfully reproduce the exponential velocity decay characteristic of creeping regions, in close agreement with experimental measurements of Liu & Henann (Reference Liu and Henann2017). At higher inclination angles, a slight underestimation of velocity in the deep creeping region is observed. This deviation is likely related to the calibration of the wall boundary parameters against the bulk flow rate, which primarily reflects inertial-region dynamics and is therefore less sensitive to creep. In contrast, the classical
 $\mu (I)$
rheology predicts an abrupt cessation of motion once the yield criterion is violated, thereby failing to capture the creeping velocity tails.
Velocity fields in a wide channel configuration (
 $W/d=142$
). Normalised velocity contours
 $v/\sqrt {Gd}$
displayed in the
 $y$
–
 $z$
cross-section, obtained from the
 $\mu (I,\varTheta )$
non-local rheological model for two volumetric flux conditions: (a)
 $Q/Wd\sqrt {Gd}=4.4$
and (b)
 $Q/Wd\sqrt {Gd}=91$
. (c) Transverse distribution of the dimensionless surface velocity
 $v_{\textit{surf}}/\sqrt {Gd}$
across the channel width
 $z$
. Experimental measurements from Jop (Reference Jop2006) are indicated by symbols, and predictions from the local
 $\mu (I)$
rheology are shown as dashed lines, while solid lines represent results from the non-local
 $\mu (I,\varTheta )$
formulation. The dash-dotted lines denote the NGF model (Liu & Henann Reference Liu and Henann2017). (d) Depth profiles of the dimensionless wall velocity
 $v_{wall}/\sqrt {Gd}$
as a function of distance
 $y$
beneath the free surface, shown for various flow rates
 $Q/Wd\sqrt {Gd}$
.

To examine the influence of lateral confinement, additional simulations were conducted in wide channels with
 $W/d=142$
, as shown in figure 4, and compared against the inclined-plane hopper–heap experiments of Jop and others (Jop et al. Reference Jop, Forterre and Pouliquen2005, Reference Jop, Forterre and Pouliquen2006, Reference Jop, Forterre and Pouliquen2007; Jop Reference Jop2006). The flow rate
 $Q$
considered here is defined as the total volumetric flux, consistent with the definition in Liu & Henann (Reference Liu and Henann2017), but differing from the unit-width flux adopted in Jop et al. (Reference Jop, Forterre and Pouliquen2005, Reference Jop, Forterre and Pouliquen2007). The dimensionless discharge is expressed as
 $Q/Wd\sqrt {Gd}$
. The numerical set-up does not precisely replicate experimental flow-control conditions; a proportional–integral–derivative (PID) feedback scheme was employed to regulate the imposed flux (see Appendix A).
Normalised velocity contours for
 $Q/Wd\sqrt {Gd}=4.4$
and
 $91$
(figures 4
a,b) reproduce the expected qualitative features, with accelerated motion in the central region, and reduced velocities near the sidewalls. The comparison of surface velocity profiles
 $v_{\textit{surf}}(x,y=0)$
with experimental measurements (Jop Reference Jop2006) across four volume flow rates (figure 4
c) demonstrates that the similar predictive capability of both the
 $\mu (I)$
and
 $\mu (I,\varTheta )$
models indicates that the surface velocity distribution is largely independent of non-local effects. By contrast, wall velocity profiles in figure 4(d) provide a more discriminating test. The
 $\mu (I,\varTheta )$
model exhibits significantly improved agreement with experimental data, whereas the classical
 $\mu (I)$
rheology systematically underestimates velocities in deeper wall-adjacent regions. Compared with the NGF model (Liu & Henann Reference Liu and Henann2017), the
 $\mu (I,\varTheta )$
rheology shows slightly reduced accuracy in the regime where normalised velocities fall below
 $10^{-3}$
. This discrepancy is attributed primarily to artefacts of the partial-slip boundary conditions employed here, rather than to inherent deficiencies of the
 $\mu (I,\varTheta )$
rheology.
Relationships in steady, dense granular heap flow: (a) free-surface inclination angle (
 $\theta$
) versus dimensionless volume flow rate
 $Q^\prime$
, and (b) dimensionless maximum velocity
 $v_{\textit{max}}^\prime$
versus dimensionless flow rate
 $Q^\prime$
. Symbols represent experimental data from Jop et al. (Reference Jop, Forterre and Pouliquen2005). Dash-dotted lines represent theoretical predictions from the NGF model reported in Liu & Henann (Reference Liu and Henann2017). Dashed lines represent theoretical predictions from the
 $\mu (I)$
model extracted from Jop et al. (Reference Jop, Forterre and Pouliquen2005). Solid lines represent theoretical predictions from the
 $\mu (I,\varTheta )$
model obtained in the present work.

4.2. Macroscopic scaling relationships
To further evaluate the effectiveness of non-local rheological models in regimes where non-local effects play only a secondary role, we examine the scaling behaviour of macroscopic flow quantities. Unlike localised measurements in creeping regions, bulk observables – such as the total volumetric flux
 $Q$
, the centreline surface velocity
 $v_{\textit{max}}=v(y=W/2,z=0)$
, and the steady inclination angle
 $\theta$
– average the influence of non-local cooperativity across the entire flow domain. Consequently, their consistency with established scaling relations provides a stringent test of whether a non-local model correctly degenerates to local rheology when appropriate. Jop et al. (Reference Jop, Forterre and Pouliquen2005) demonstrated that for heap flows with different stable discharge rates, the relationships between the bulk flow rate, surface velocity and slope inclination collapse onto universal curves when expressed in the dimensionless form
 \begin{align} Q^\prime =Qd/G^{1/2}W^{7/2}, \quad v^\prime _{\textit{max}}=v_{\textit{max}}d/GW^{3/2}, \end{align}
where
 $Q'$
and
 $v'_{\textit{max}}$
represent normalised discharge and surface velocity, respectively. Figure 5 compares simulation results from the
 $\mu (I,\varTheta )$
framework with these scaling laws. The partial-slip wall coefficient was selected consistently with the finite-element implementation of the NGF model, and multiple flow datasets were employed to enhance robustness (figure 5
a). Both the
 $\mu (I,\varTheta )$
and NGF models closely reproduce the experimental scaling relations, showing only minor deviations from measurements. Interestingly, the classical
 $\mu (I)$
rheology yields an almost perfect collapse of the normalised quantities. Nevertheless, the differences among all three models remain small, confirming that creeping zones do not influence global scaling. Thus the
 $\mu (I,\varTheta )$
and NGF models successfully capture creeping behaviour while preserving the predictive accuracy of macroscopic observables governed primarily by local inertial rheology.
Notably, the collapse observed in figure 5 highlights a fundamental property of granular rheology: within the rapidly flowing surface layer, where the inertial number is sufficiently large, non-local contributions become negligible, and global observables continue to obey simple scaling laws. This finding supports the argument of Kim & Kamrin (Reference Kim and Kamrin2020), who proposed that constitutive forms of the type
 $\mu \varTheta ^p=f(I)$
provide a unified description of granular flows across diverse geometrical configurations while preserving the validity of local rheology in its applicable regime.
A simple scaling analysis of the
 $\mu (I,\varTheta )$
model provides further insight. Introducing a characteristic length
 $L$
to represent the typical scale over which the granular temperature
 $\varTheta$
varies significantly, the diffusion term can be approximated as
 ${\nabla} ^2\varTheta \sim \varTheta /L^2$
. In the absence of appreciable non-locality,
 $\varTheta \approx \varTheta _{\textit{loc}}$
. Under steady-state conditions,
 $Dd^2\varTheta /L^2\ll B\varTheta$
; with
 $B/D=1$
under strong vibration, this criterion reduces to
 $L\gg d$
. Thus when the characteristic variation length of
 $\varTheta$
greatly exceeds the particle diameter, diffusion effects become negligible. The flowing surface layer satisfies precisely this condition, explaining why non-local contributions vanish and why global rheological scaling relations remain valid.
4.3. Distinct length scales in layered flows
To elucidate the qualitative differences between the rapidly flowing surface layer and the deep creeping region, two classical length scales are employed (Jop et al. Reference Jop, Forterre and Pouliquen2007). The surface flowing layer is characterised by the mean flow depth
 $h=Q/(Wv_{\textit{max}})$
, where
 $v_{\textit{max}}$
denotes the centreline surface velocity. The creeping bulk is quantified by the decay length
 $\lambda$
, defined through the exponential form of the longitudinal velocity profile,
 $v(z=z_0,y)\sim \exp {(-y/\lambda )}$
, with
 $z_0$
denoting the channel-centre position. In experiments, owing to limited velocity field resolution,
 $\lambda$
is typically extracted from wall-based velocity profiles (Jop et al. Reference Jop, Forterre and Pouliquen2007). In the present simulation with
 $H/d=20$
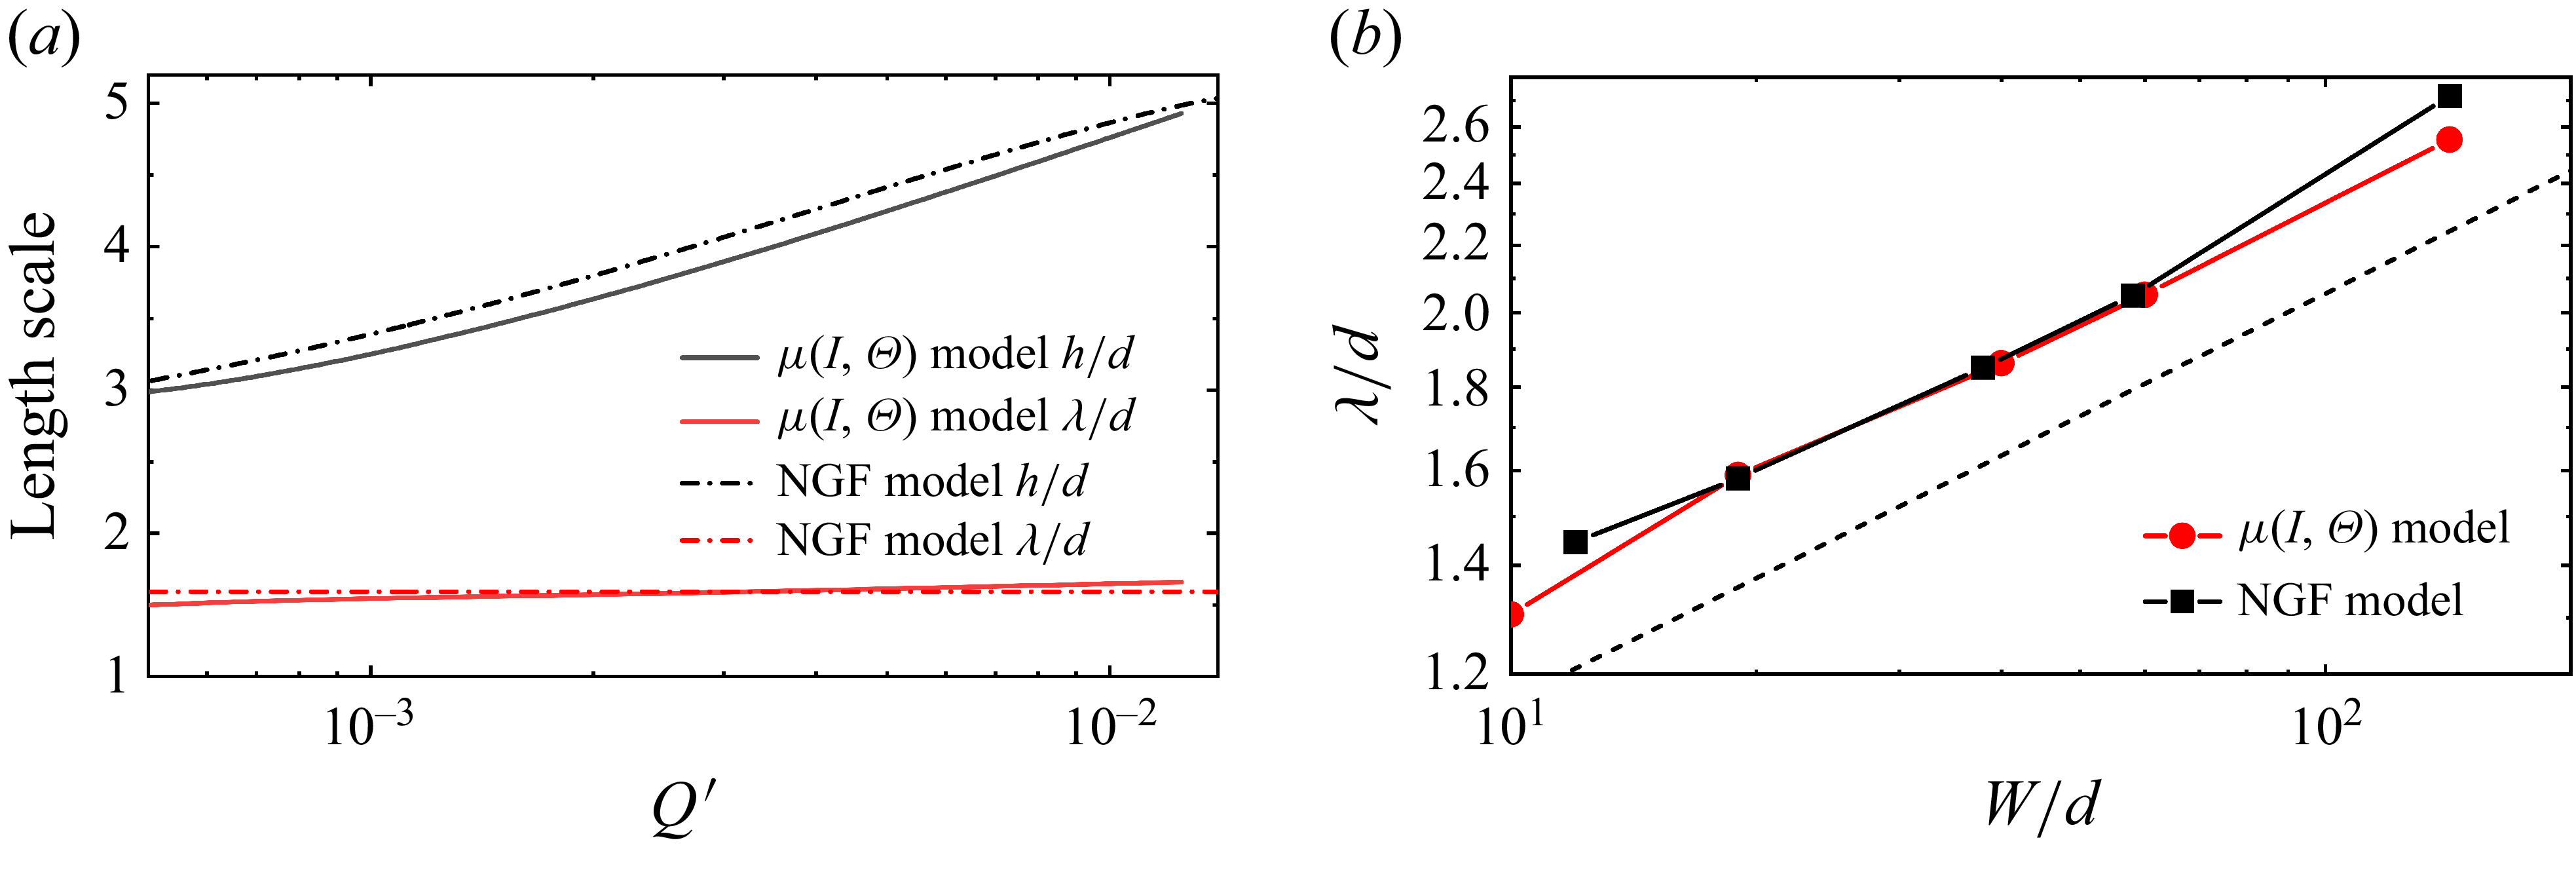
, the creeping region extends up to approximately ten particle diameters above the base. Figure 6(a) presents the variation of normalised length scales
 $h/d$
and
 $\lambda /d$
with the dimensionless discharge
 $Q^\prime$
for both the
 $\mu (I,\varTheta )$
and NGF models in a narrow channel with
 $W/d=19$
. The results reproduce a central observation from Jop et al. (Reference Jop, Forterre and Pouliquen2007): the mean flow depth
 $h$
increases with discharge, whereas the decay length
 $\lambda$
remains essentially independent of flow rate. Both models achieve good quantitative agreement with experimental data, although the
 $\mu (I,\varTheta )$
model exhibits a slight residual dependence of
 $\lambda$
on velocity. Figure 6(b) further compares the scaling relation between
 $\lambda /d$
and channel width
 $W/d$
. The
 $\mu (I,\varTheta )$
predictions are consistent with NGF results, and both align with the
 $1/4$
power-law conjecture proposed by Liu & Henann (Reference Liu and Henann2017), shown as the dashed line.
Comparison of the
 $\mu (I,\varTheta )$
model and NGF model at
 $W/d=19$
. (a) Relationship between flowing zone size
 $h/d$
and creeping zone decay length
 $\lambda /d$
versus dimensionless volume flow rate
 $Q^\prime$
(see text for definition). Solid lines represent predictions of the
 $\mu (I,\varTheta )$
model obtained in the present work, whereas dash-dotted lines represent NGF model results extracted from Liu & Henann (Reference Liu and Henann2017). (b) Relationship between creeping zone decay length
 $\lambda /d$
and channel width
 $W/d$
. The dashed line represents the reference
 $1/4$
power law.

These trends reflect fundamental differences in rheological formulation. In the NGF framework (Kamrin & Koval Reference Kamrin and Koval2012), the flowing surface layer follows the local constitutive law when
 $\mu \gt \mu _s$
, producing a rate-dependent flow thickness
 $h$
. In the creeping bulk, where
 $\mu \lt \mu _s$
, the model prescribes a vanishing local fluidity,
 $g_{loc}=0$
, thereby completely decoupling the local rheology from the driving rate, and producing a strictly rate-independent decay length
 $\lambda$
. In contrast, within the
 $\mu (I,\varTheta )$
framework, the surface layer also behaves locally when the inertial number is large, as
 $\varTheta _{\textit{loc}}/\varTheta \approx 1$
. In the creeping regime, however, as
 $I\rightarrow 0$
, the function
 $f(I)$
tends to zero and
 $\varTheta _{\textit{loc}}/\varTheta \ll 1$
, allowing a small amount of fluctuation energy to diffuse from the inertial layer into the creep region. This residual coupling produces a weak but finite rate dependence of
 $\lambda$
, rather than the strict rate independence enforced in NGF. Such behaviour is physically plausible and consistent with independent theoretical analyses (Martinez et al. Reference Martinez, González-Lezcano, Batista-Leyva and Altshuler2016). Thus the divergence between the two models ultimately reflects whether granular rheology becomes completely decoupled from inertial effects in the quasi-static limit.
Overall, the simulations demonstrate that the
 $\mu (I,\varTheta )$
model consistently captures the layered structure of dense heap flows, characterised by two coexisting length scales: the mean flow depth
 $h$
, reflecting the flux-dependent inertial dynamics of the surface layer, and the decay length
 $\lambda$
, encoding the geometry-controlled creep in the bulk. Across both narrow and wide channels, the
 $\mu (I,\varTheta )$
formulation reproduces these behaviours with quantitative accuracy. In narrow channels, it recovers the exponential velocity decay observed experimentally and predicted by NGF, overcoming the limitations of the classical
 $\mu (I)$
rheology. In wide channels, it yields wall velocity distributions in close agreement with experiments, and performs comparably to NGF, while retaining the computational efficiency of a local constitutive law. Collectively, these findings confirm that incorporating granular temperature substantially extends the applicability of inertial rheology, enabling a unified description of dense granular flows that encompasses both local inertial dynamics and non-local creeping phenomena.
5. Split-bottom annular shear
5.1. Simulation configuration and parameters
Shear localisation is a defining feature of granular flows, in which deformation is concentrated within narrow shear bands while the surrounding bulk remains quasi-rigid. Predicting the width and morphology of these bands remains a central challenge in granular rheology. Local constitutive models, including the classical inertial rheology, typically yield shear zones spanning only a few grain diameters with unrealistically sharp gradients, in marked contrast to experimental observations (Jop Reference Jop2008). Measurement is further complicated by the frequent anchoring of shear bands to sidewalls. Split-bottom shear cells provide a particularly useful geometry in this regard: the shear band originates from the basal discontinuity and broadens upwards into the bulk, offering a clear manifestation of intrinsic localisation. Experimental studies using this configuration have consistently highlighted the importance of non-local effects (Fenistein & van Hecke Reference Fenistein and van Hecke2003; Fenistein et al. Reference Fenistein, van de Meent and van Hecke2004).
In the present work, shallow split-bottom Couette flows (
 $H\le 50\,\mathrm{mm}$
) are simulated using a two-phase VOF framework coupled with the
 $\mu (I,\varTheta )$
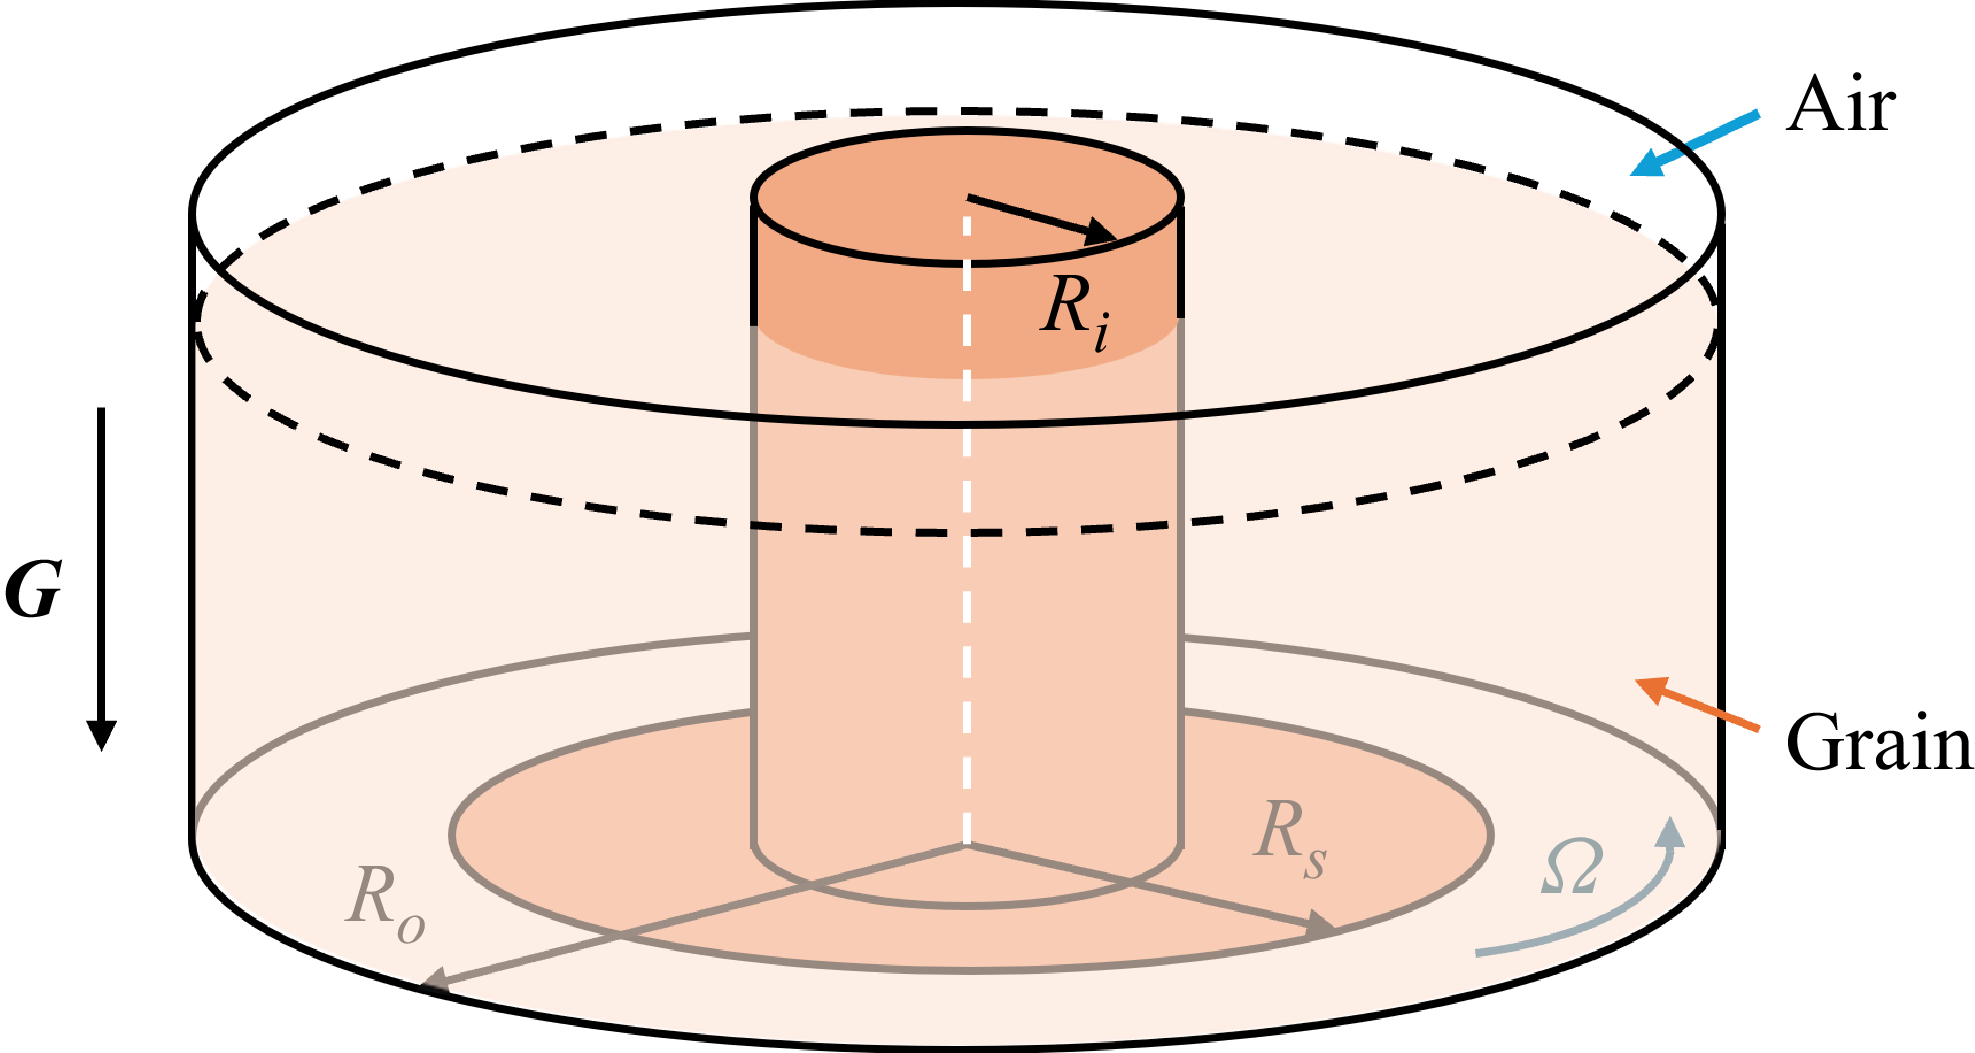
rheology. The apparatus configuration is illustrated in figure 7 and consists of an inner stationary cylinder of radius
 $R_i=65$
mm, a fixed central disk of radius
 $R_s=85\,\mathrm{mm}$
, and an outer rotating cylinder of radius
 $R_o=105\,\mathrm{mm}$
. Both the outer cylinder and basal disk rotate at constant angular velocity
 $\varOmega =0.16\,\mathrm{rad\,s^{-1}}$
, generating shear along the basal discontinuity between fixed and moving boundaries. To avoid spurious pressure constraints arising from centrifugal effects in annular geometries, the granular free surface is evolved dynamically through the two-phase VOF representation. No-slip velocity conditions are imposed on all solid boundaries, while pressure and granular temperature fields satisfy zero-gradient Neumann conditions. The initial granular column height is prescribed through the volume-fraction field.
Classical local models invariably predict shear bands of vanishing width. By contrast, the NGF model successfully reproduces the experimentally observed scaling of shear-band width with system size
 $W(d,H)$
, as well as the dome-shaped transition in deeper layers, by introducing a cooperativity length
 $\xi \propto d$
that reflects the scale of collective particle rearrangements (Henann & Kamrin Reference Henann and Kamrin2013). More recently, Faroux et al. (Reference Faroux, Washino, Tsuji and Tanaka2022) demonstrated that finite-volume implementations of non-local formulations can quantitatively capture these behaviours. Building on these advances, we combine the two-phase VOF method with the
 $\mu (I,\varTheta )$
rheology to assess its predictive capability for shear-band width and morphology, benchmarking the results against both theoretical expectations and experimental measurements.
Schematic diagram of the split-bottom Couette cell.

5.2. Non-local prediction of shear-band characteristics
The normalised angular velocity field, defined as
 $\omega =v_\theta /(r\varOmega )$
, provides direct insight into shear localisation in split-bottom Couette flows. As shown in figure 8, shallow granular columns (
 $H=10\,\mathrm{mm}$
) exhibit significantly narrower shear bands than taller columns (
 $H=30\,\mathrm{mm}$
), while systems composed of smaller particles (
 $d=0.35\,\mathrm{mm}$
) develop narrower bands than those with larger particles (
 $d=1.2\,\mathrm{mm}$
). These observations confirm that shear-band width is jointly governed by the confinement geometry and the particle size. The
 $\mu (I,\varTheta )$
formulation predicts shear bands that broaden progressively with depth and display smooth velocity gradients, consistent with experimental reports of band widths exceeding 50 grain diameters (Fenistein & van Hecke Reference Fenistein and van Hecke2003). In contrast, the classical
 $\mu (I)$
rheology produces sharply localised deformation zones only a few diameters wide, reflecting the inherent limitations of local laws in the quasi-static limit.
Contour plots of the normalised angular velocity field in the
 $r$
–
 $z$
plane of a split-bottom cell, obtained from simulations using different models at column heights 10 and 30 mm: (a–d) predictions from the
 $\mu (I,\varTheta )$
model; (e)–(h) predictions from the
 $\mu (I)$
model. Panels (a,b,e, f) represent particle diameter
 $d = 0.35\,\mathrm{mm}$
, whereas (c,d,g,h) correspond to
 $d = 1.2\,\mathrm{mm}$
.

Particle-size dependence further highlights the underlying mechanism. While both rheologies predict wider bands for larger particles, the effect is significantly stronger in the
 $\mu (I,\varTheta )$
framework. This outcome highlights grain diameter as an intrinsic length scale for shear localisation. In the NGF model, this role is captured by the cooperativity length
 $\xi \propto d$
, representing the extent of correlated particle rearrangements (Henann & Kamrin Reference Henann and Kamrin2013). In the
 $\mu (I,\varTheta )$
formulation, it arises naturally from the diffusion of granular temperature, which transmits fluctuation energy over multiple grain diameters. Accordingly, the
 $\mu (I,\varTheta )$
predictions agree qualitatively with experimental evidence of wide shear zones, whereas the
 $\mu (I)$
rheology yields unrealistically sharp gradients akin to narrow-band variational predictions (Unger et al. Reference Unger, Török, Kertész and Wolf2004). Quantitative comparisons reinforce these findings, as shown in figure 9. For particles with
 $d=0.35\,\mathrm{mm}$
at heights
 $H=10$
,
 $20$
and
 $30\,\mathrm{mm}$
,
 $\mu (I,\varTheta )$
simulations reproduce the experimentally observed broadening of shear bands with depth and the progressive inward migration of the band centre (figures 9
a,b), in close agreement with Fenistein & van Hecke (Reference Fenistein and van Hecke2003). Importantly, shallow columns (
 $H\le 30\,\mathrm{mm}$
) exhibit vertical bands that do not intersect the inner wall, again consistent with experimental reports. When fitted to the universal error function form
 \begin{equation} \omega \left (\lambda \right )=1/2+1/2\,\text{erf}(\lambda ), \end{equation}
the
 $\mu (I,\varTheta )$
results for
 $d=1.2\,\mathrm{mm}$
confirm excellent agreement across multiple filling heights. In contrast, the
 $\mu (I)$
rheology fails to reproduce the universality, predicting band widths that remain nearly independent of particle size (figure 9
c).
Radial profiles of the normalised angular velocity at the flow surface, obtained from simulations using different rheological models and compared with experimental and theoretical references. (a) Comparison of the
 $\mu (I, \varTheta )$
and
 $\mu (I)$
models with experimental data from Fenistein & van Hecke (Reference Fenistein and van Hecke2003) for particle diameter
 $d = 0.35\,\mathrm{mm}$
. (b) Comparison of the
 $\mu (I, \varTheta )$
and
 $\mu (I)$
models with the velocity-scaling predictions of Fenistein & van Hecke (Reference Fenistein and van Hecke2003) for
 $d = 1.2\,\mathrm{mm}$
. (c) Compilation of all
 $\mu (I)$
model simulation results for varying column heights and particle diameters.

Additional simulations were carried out for particle diameters
 $d = 0.35{-}2.2\,\mathrm{mm}$
with filling heights
 $H = 5{-}35\,\mathrm{mm}$
, and the results are summarised in figure 10. The predicted dependence of shear-band width on layer depth across different particle sizes exhibits excellent agreement with both experimental measurements and the NGF model predictions (Henann & Kamrin Reference Henann and Kamrin2013). Specifically, the
 $\mu (I,\varTheta )$
predictions collapse onto the power-law relation
 \begin{equation} {W}/{d}\propto \left ({H}/{d}\right )^{2/3} \end{equation}
as given in the inset of figure 10, consistent with the scaling proposed by Henann & Kamrin (Reference Henann and Kamrin2013). This scaling highlights that the band width is not governed by stress gradients alone, but instead reflects cooperative particle rearrangements over a length scale proportional to grain size. By contrast, the
 $\mu (I)$
model systematically underestimates band width and fails to capture the experimentally observed broadening. It predicts bands of nearly constant and unrealistically small thickness, essentially independent of particle size, owing to the vanishing inertial number in the quasi-static regime.
Relationship between the shear-band width
 $W$
and the packing height
 $H$
of the granular column for different particle diameters (
 $d = 0.35$
,
 $0.8$
,
 $1.2$
and
 $2.2\,\mathrm{mm}$
, from bottom to top). Upon normalising both
 $W$
and
 $H$
by the particle diameter
 $d$
, the simulation data collapse onto a
 $2/3$
power-law scaling,
 $W/d \propto (H/d)^{2/3}$
, as illustrated in the inset, consistent with the observations of Henann & Kamrin (Reference Henann and Kamrin2013).

The split-bottom Couette simulations demonstrate that the
 $\mu (I,\varTheta )$
rheology provides a robust and physically consistent description of shear localisation in quasi-static granular flows. Unlike the classical
 $\mu (I)$
model, which predicts unrealistically narrow and size-independent shear zones, the
 $\mu (I,\varTheta )$
framework captures the progressive broadening of shear bands with depth, their inward migration with increasing filling height, and the particle-size dependence of shear-band width. The resulting velocity profiles collapse onto universal error function forms, and the width scaling
 $W\propto d^{2/3}H^{1/3}$
is reproduced in close agreement with both experimental measurements and NGF predictions. These results confirm that granular-temperature-based cooperativity furnishes a mechanistic explanation for non-local stress redistribution, reconciling the finite shear-band widths observed experimentally with continuum modelling. Collectively, the findings establish the
 $\mu (I,\varTheta )$
formulation as a unified rheological framework capable of recovering inertial behaviour in rapid flows while extending predictive accuracy to slow, quasi-static regimes dominated by non-local effects.
6. Granular column collapse
In the preceding sections, the ability of the
 $\mu (I,\varTheta )$
formulation to capture non-local effects was examined using steady configurations. While the classical
 $\mu (I)$
rheology has been shown to perform well for a range of transient granular flows (Lacaze & Kerswell Reference Lacaze and Kerswell2009), the present model extends this framework by introducing a granular-temperature transport equation, which provides a physically grounded description of the production, diffusion and dissipation of fluctuation energy during unsteady processes (Irmer et al. Reference Irmer, Brodsky and Clark2025). A stringent test of such a formulation is therefore its performance in a genuinely transient, large-deformation setting. To this end, we consider the collapse of a granular column, a canonical benchmark that has been extensively studied experimentally and numerically, and is widely used to assess continuum granular rheologies.
From a numerical perspective, transient large-deformation problems pose particular challenges for grid-based methods, owing primarily to the rapid evolution of free boundaries. A common strategy is to reformulate the problem within a two-phase framework, in which the free surface is handled through interface-capturing techniques (Lagrée et al. Reference Lagrée, Staron and Popinet2011). This approach was already employed in § 5 for the split-bottom annular shear configuration, where it mainly served to remove non-physical constraints associated with centrifugal effects, and the analysis focused on the final steady state. In contrast, the column-collapse problem considered here is intrinsically transient and requires resolving the full temporal evolution of both the flow field and the free surface. Transient simulations are therefore particularly demanding for non-local rheological models, as rapid stress variations and evolving boundaries can strongly amplify numerical sensitivity, a difficulty widely reported for NGF and
 $I$
-gradient-based formulations in unsteady flows (Liu & Henann Reference Liu and Henann2017; Lin & Yang Reference Lin and Yang2020; Dunatunga & Kamrin Reference Dunatunga and Kamrin2022).
In the present simulations, particular attention is therefore paid to the coupling between the granular-temperature transport equation and the VOF formulation. A phase-shielding treatment is applied to prevent spurious diffusion of
 $\varTheta$
into the ambient fluid phase, thereby avoiding non-physical artefacts near the interface and ensuring that granular-temperature boundary conditions effectively constrain only the granular phase. Consistent with previous experience, transient simulations also require significantly more iterative effort than steady calculations. While steady Navier–Stokes –
 $\mu (I,\varTheta )$
simulations using the PIMPLE algorithm show limited sensitivity beyond one outer and three inner iterations, transient cases typically require at least five outer iterations and three inner iterations per time step to obtain stable and converged solutions, with the precise requirement depending on the flow configuration and parameters.
We consider the two-dimensional collapse of an initially stationary granular column under gravity on a horizontal substrate. The initial geometry follows Lagrée et al. (Reference Lagrée, Staron and Popinet2011) and is defined by the column height
 $H_0$
and half-width
 $L_0$
, with aspect ratio
 $a=H_0/L_0$
serving as the principal control parameter. Three representative values,
 $a=0.5$
,
 $1.42$
and
 $6.26$
, are examined, corresponding to shallow, intermediate and tall initial configurations. Granular material properties are chosen to represent dense glass beads and are consistent with those used in the preceding sections. The computational domain is sufficiently extended in both horizontal and vertical directions to minimise the influence of far-field boundaries. A no-slip condition is imposed at the basal wall to model a rough substrate, and symmetry about the column centreline is exploited by simulating only half of the domain, with zero normal velocity and zero tangential stress prescribed at the symmetry plane. The free surface is captured through the transport equation for the solid volume fraction, with the interface identified by the
 $\alpha =0.5$
isocontour.
All physical quantities are non-dimensionalised. To avoid singular behaviour of the constitutive law in regions of vanishing pressure near the free surface, a minimum pressure threshold
 $p_{\textit{atm}}=10^{-5}$
, representative of ambient air pressure, is imposed. As in earlier sections, a broader viscosity cut-off is employed than in the original
 $\mu (I)$
implementation of Lagrée et al. (Reference Lagrée, Staron and Popinet2011) (see § 3.2).
Under these numerical settings, the
 $\mu (I,\varTheta )$
model produces stable and physically consistent transient solutions. As illustrated in figure 11, the spatio-temporal evolution of the velocity field exhibits well-defined failure planes and shear localisation for all aspect ratios considered. The simulations capture the characteristic sequence of granular column collapse, including initial mobilisation, the development of localised shear zones, subsequent lateral spreading and eventual arrest, indicating that the
 $\mu (I,\varTheta )$
formulation qualitatively reproduces collapse dynamics over a wide range of initial geometries.
Velocity magnitude contours at successive times during the collapse of a granular column governed by the
 $\mu (I,\varTheta )$
rheology. (a–c) Aspect ratios
 $a=0.5$
,
 $1.42$
and
 $6.26$
, respectively, with columns showing the temporal evolution at non-dimensional times
 $\bar {t}=0, 1, 2, 3, 4$
(left to right), where
 $\bar {t}=t/\sqrt {H_0/g}$
. The surrounding phase is air.

Quantitative comparisons are performed by analysing the temporal evolution of the flow front and the final deposit morphology, as shown in figure 12, with benchmarks provided by discrete contact method (DCM) simulations and continuum predictions obtained using the local Navier–Stokes–
 $\mu (I)$
rheology. For shallow, intermediate and tall columns, the
 $\mu (I,\varTheta )$
model closely reproduces the DCM predictions for time-dependent runout, capturing both the initial rapid acceleration and the late-stage deceleration towards arrest. In contrast, the
 $\mu (I)$
model systematically yields a slightly shorter runout, with the discrepancy becoming more pronounced as the aspect ratio increases.
Similar deviations have been reported in previous studies of granular column collapse. Lagrée et al. (Reference Lagrée, Staron and Popinet2011) attributed them primarily to two effects: (i) a small population of grains at the leading edge detaches from the bulk deposit and therefore violates the assumptions underlying a continuum description; and (ii) the inertial number at the front locally exceeds the range of validity of the
 $\mu (I)$
rheology. These arguments emphasise the limitations of a purely local constitutive relation when applied to highly transient flows with strong spatial heterogeneity. The present results offer a complementary interpretation from a rheological perspective. Our simulations indicate that when the constitutive model incorporates an intrinsic mechanism to describe deformation in weakly sheared and near-yield regions – here through the granular-temperature-dependent
 $\mu (I,\varTheta )$
formulation – the systematic underprediction of runout by the local
 $\mu (I)$
model is significantly reduced. This improvement suggests that although strong non-local effects are not dominant in the classical sense for gravity-driven granular column collapse, the dynamics remains sensitive to how sub-yield and creeping deformation are represented.
Temporal evolution of the flow-front position and final deposit morphology for granular columns with different aspect ratios: (a–c) time evolution of the normalised front position; (d–f) the corresponding final deposit morphologies for columns with aspect ratios
 $a=0.5$
,
 $1.42$
and
 $6.26$
, respectively. The DCM simulation results and the
 $\mu (I)$
model results are both derived from Lagrée et al. (Reference Lagrée, Staron and Popinet2011).

The physical origin of this improvement can be traced to the transport of fluctuation energy embodied in the granular temperature
 $\varTheta$
. In the
 $\mu (I,\varTheta )$
framework, granular temperature provides an additional state variable that relaxes the excessive rigidity of the classical
 $\mu (I)$
rheology in the quasi-static limit, allowing finite deformation in regions nominally below the yield condition. Furthermore, fluctuation energy generated within the basal shear layer diffuses into the surrounding material, locally reducing the effective friction, and sustaining deformation away from the primary shear zone. This diffusion-mediated mechanism promotes momentum transfer over a broader portion of the granular column, leading to a thicker flowing layer, enhanced lateral spreading, and an increased runout distance. These effects are relatively modest for shallow columns, where collapse dynamics are dominated by near-surface spreading, and stress gradients remain moderate. In contrast, for intermediate and tall columns, strong transient stress heterogeneities and the development of extensive shear bands amplify the role of fluctuation-energy transport, making its contribution to the overall collapse dynamics increasingly significant.
In this respect, the
 $\mu (I,\varTheta )$
framework differs in emphasis from other non-local continuum approaches, such as the NGF model and
 $I$
-gradient formulations. While these models introduce non-locality through phenomenological diffusion of fluidity or strain-rate-related quantities, the
 $\mu (I,\varTheta )$
formulation associates non-local effects with the transport of fluctuation energy, governed by an explicit balance equation for production, diffusion and dissipation. This distinction is particularly relevant for transient flows, such as granular column collapse, where rapid temporal variations and evolving shear localisation play a central role. By explicitly resolving the transport of fluctuation energy, the
 $\mu (I,\varTheta )$
framework provides a physically consistent continuum description of dense granular flows under transient large deformations, firmly anchored in a clear mechanistic interpretation of nonlocality.
7. Conclusions
This work has developed a continuum framework for dense granular flows that incorporates non-local effects through a granular-temperature-modified
 $\mu (I)$
rheology. By embedding granular temperature as a state variable within a finite-volume computational fluid dynamics solver, the model establishes an explicit connection between grain-scale fluctuations and macroscopic stresses, thereby extending the predictive scope of classical inertial rheology.
This framework was systematically validated against three canonical flow configurations. In steady heap flows, it reproduces the coexistence of a rate-dependent surface layer governed by the inertial number and a deep creeping region characterised by an exponential velocity decay that is independent of discharge rate. In split-bottom Couette flows, the model captures the progressive broadening and inward migration of shear bands with increasing filling height, as well as their scaling with particle diameter, in close agreement with experimental observations. In granular column collapse, the formulation successfully reproduces transient free-surface evolution and runout dynamics, demonstrating that the granular-temperature description remains applicable under strongly unsteady conditions involving rapid acceleration, deceleration and material transport. Together, these benchmarks show that granular temperature provides a physically interpretable mechanism for long-range stress transmission and cooperative dynamics in dense granular flows across both steady and transient regimes.
Relative to existing non-local fluidity-based models, the present framework offers three notable advantages. First, granular temperature is a measurable kinematic quantity whose evolution is governed by well-defined transport, production and dissipation processes, avoiding the interpretational ambiguity associated with abstract order parameters such as fluidity (Zhang & Kamrin Reference Zhang and Kamrin2017; Berzi Reference Berzi2024). Second, the granular-temperature transport equation can be incorporated naturally within conservative finite-volume methods, ensuring numerical robustness across a wide range of flow regimes. Third, because granular temperature represents a universal descriptor of fluctuational motion, the framework can be extended in a straightforward manner to more complex systems, including polydisperse assemblies, non-spherical particles, wet granular materials and cohesive granular materials (Hao & Guo Reference Hao and Guo2023; Breard et al. Reference Breard, Fullard and Dufek2024; Han et al. Reference Han, Zhao and Wang2025; Zhao et al. Reference Zhao, Yuan, Han and Wang2025).
Overall, the granular-temperature-extended
 $\mu (I)$
rheology provides a unified continuum description of dense granular flows that reconciles local and non-local behaviours within a single framework. It retains the predictive strengths of inertial rheology in rapid, dense flows while extending its validity to creeping and shear-localised flows. Beyond the benchmark problems considered here – spanning steady flows, quasi-static shear localisation, and transient collapse – the formulation provides a scalable basis for modelling granular flow processes in both geophysical and industrial contexts. By directly linking measurable microscopic fluctuations to macroscopic stresses, the present framework offers both a mechanistic foundation for non-locality and a practical route towards a unified granular rheology capable of bridging laboratory experiments, discrete simulations and field-scale applications.
Acknowledgements
This research was supported by the National Natural Science Foundation of China (grant nos 12272158 and 11872028). The authors would like to thank H. Tang and Y. Wang for continuing helpful discussions related to this study.
Declaration of interests
The authors report no conflict of interest.
Appendix A. The PID control method
In gravity-driven inclined thin-film flows, the relationship between flow rate and inclination angle is nonlinear and highly sensitive. Traditional approaches rely on repeated trial-and-error adjustments to identify the inclination angle corresponding to a prescribed discharge, which is inefficient and often imprecise. To overcome this limitation, a PID controller is implemented to automatically regulate the inclination angle and achieve accurate flow-rate control.
The PID controller is a classical feedback mechanism (Åström & Hägglund Reference Åström and Hägglund1995). Its principle is to adjust the control variable based on the deviation between the system output and the desired target. In this application, the instantaneous inlet discharge rate
 $Q(t)$
is monitored, and its deviation from the target value is computed as
 $e(t)=Q_{\textit{target}}-Q(t)$
. The controller output is then
 \begin{equation} u(t)=K_{\!p}e(t)+K_i\int e(t) {\rm d}t+K_d\frac {{\rm d}}{{\rm d}t}e(t), \end{equation}
where
 $K_{\!p}$
,
 $K_i$
and
 $K_d$
are the proportional, integral and derivative gains, respectively. The output
 $u(t)$
is used to adjust the inclination angle
 $\theta$
, thereby regulating the flow rate.
The control procedure is iterative. At each step, a CFD simulation is advanced until a statistically steady state is reached, after which the discharge rate is evaluated and the deviation computed. The PID controller then provides a corrective adjustment to
 $\theta$
. To ensure numerical stability and physical plausibility, the angle correction is restricted to
 $\pm 5^\circ$
per iteration, and the overall inclination angle is constrained within
 $10^\circ \leq \theta \leq 45^\circ$
. When a sign change in the error
 $e(t)$
is detected – indicative of overshoot – the controller automatically reduces the gain parameters to suppress oscillations.
A dynamic gain-adjustment mechanism is adopted to accelerate convergence:
 \begin{equation} \begin{cases} K_{\!p}\,\beta & \text{if} \quad \text{sgn}(e_t)\neq \text{sgn}(e_{t-1}), \\[2pt] K_{\!p} & \text{otherwise}, \end{cases} \end{equation}
with
 $\beta =0.5$
the decay factor, and
 $e_t$
the instantaneous flow-rate error. Upon detecting sign changes, the gains
 $(K_{\!p},K_i,K_d)$
are reduced, thereby suppressing overshoot oscillation behaviour.
Finally, convergence to steady state is determined using dual criteria:
 \begin{equation} \mathrm{CV}=\frac {\sigma _Q}{\mu _Q}\lt \varepsilon \quad\text{and}\quad\Delta t\gt t_{w\textit{indo}w}, \end{equation}
where
 $\sigma _Q$
and
 $\mu _Q$
are the standard deviation and mean of the flow rate, respectively, and
 $\varepsilon =0.1$
. The conditions must be satisfied for three consecutive checks, ensuring robustness relative to single-threshold approaches.