




No CrossRef data available.
Article contents
Usability of a theory of visual attention (TVA) for parameter-based measurement of attention I: Evidence from normal subjects
Published online by Cambridge University Press: 16 December 2005
Abstract
The present study investigated the usability of whole and partial report of briefly displayed letter arrays as a diagnostic tool for the assessment of attentional functions. The tool is based on Bundesen's (1990, 1998, 2002; Bundesen et al., 2005) theory of visual attention (TVA), which assumes four separable attentional components: processing speed, working memory storage capacity, spatial distribution of attention, and top-down control. A number of studies (Duncan et al., 1999; Habekost & Bundesen, 2003; Peers et al., 2005) have already demonstrated the clinical relevance of these parameters. The present study was designed to examine whether (a) a shortened procedure bears sufficient accuracy and reliability, (b) whether the procedures reveal attentional constructs with clinical relevance, and (c) whether the mathematically independent parameters are also empirically independent. In a sample of 35 young healthy subjects, we found high intraparameter correlations between full- and short-length tests and sufficient internal consistencies as measured via a bootstrapping method. The clinical relevance of the TVA parameters was demonstrated by significant correlations with established clinical tests measuring similar constructs. The empirical independence of the four TVA parameters is suggested by nonsignificant or, in the case of processing speed and working memory storage capacity, only modest correlations between the parameter values. (JINS, 2005, 11, 832–842.)
Information
- Type
- Research Article
- Information
- Journal of the International Neuropsychological Society , Volume 11 , Issue 7 , November 2005 , pp. 832 - 842
- Copyright
- © 2005 The International Neuropsychological Society
INTRODUCTION
Recent progress in neuroscience indicates that attention consists of separable components supported by overlapping, but independent cerebral networks (Duncan & Owen, 2000; Posner & Petersen, 1990). For the neuropsychological assessment of attention disorders this raises the problem of how the distinct components can be specifically addressed by the testing procedures applied (Fan et al., 2002). A decisive impulse can be expected from parameter-based measurements of attention. They assume a set of latent processes (parameters) to underlie the observable performance, integrate these within a coherent theory, and suggest appropriate assessment tools. In this way, it is possible to address separable components distinctly and draw specific conclusions about them.
A prominent example is the theory of visual attention (TVA; Bundesen, 1990, 1998, 2002) assuming the performance in visual attention tasks to be determined by four visuala
Of course, the relative focus on visual attention in this paper does not ignore the existence of different attention systems for processing information in different modalities.
The conceptual framework provided by TVA is not the only possible way to differentiate attentional components. However, a recent proposal by Fan et al. (2002) includes at least three of the four parameters included in TVA: speed, lateralization, and top-down control.
Several studies have demonstrated the potential of a TVA-based approach for patient assessment. In neglect patients, a specific pattern of impaired and intact processes of spatially lateralized and nonlateralized aspects of attention has been revealed (Duncan et al., 1999). A subtle attentional deficit was disclosed in a patient complaining of reduced awareness of left-sided stimuli in everyday activities, but performing normally in conventional tests (Habekost & Bundesen, 2003). Peers et al. (2005) uncovered double dissociations between TVA parameters in a large sample of patients with frontal and parietal lesions who also showed minimal signs of impairment on clinical tests. Furthermore, a novel account of simultanagnosia as a consequence of severe processing speed reduction has been put forward (Duncan et al., 2003).
These results obtained from basic research studies are promising and suggest that TVA-based assessment procedures could also be valuable for clinical purposes. The parameter estimates derived are easily interpretable values: the number of visual elements processed per second (processing speed); the number of elements maintained in parallel (storage capacity); the degree of lateralization (spatial distribution of attention); and the degree of prioritization of targets over distractors (top-down control). Moreover, in contrast to the heterogeneity of clinical attention tests, whole and partial report tasks have highly similar stimuli (letters) and response requirements (verbal report) and impose comparable demands on perceptual and motor skills. Performance is assessed in terms of in terms of accuracy at certain exposure durations instead of response latency. Thus, assessment occurs independently from motor impairments, which are common after brain damage, and adapted to each subject by adjusting the exposure durations accordingly. In sum, the simplicity of the tasks, their adaptability, and the verbal, nonspeeded response modus permit administration at a broad range of motor and attentional abilities.
Despite these benefits, a number of questions have to be addressed beforehand. First, the tasks used so far (e.g., Duncan et al., 1999) were rather time-consuming, taking a few hours to complete. They can readily be shortened so as to obey the need of a clinical setting. But do these procedures have sufficient accuracy and reliability? A second question is whether the assessment provides information the clinical neuropsychologist is really interested in. Put differently, are the parameters related to conventional neuropsychological tests, and in a specific manner? Third, according to TVA, the parameters are mathematically independent, but does this assumption hold empirically? That is, is it really possible to address the attentional components distinctly and to obtain uncorrelated parameter estimates?
These three issues are the subject of this paper. Its rationale will be explained below. First, however, we give a brief outline of TVA (see Kyllingsbæk, in press, for a formal description).
The Theoretical and Methodological Framework of TVA
TVA is a mathematical model with strong relations to the biased-competition view of visual attention (e.g., Desimone & Duncan, 1995). On this view, visual objects are processed in parallel and compete for selection, that is, conscious representation. The race among objects can be biased in such a way that some objects are favored for selection, based either on automatic, “bottom-up,” or on intentional, “top-down,” factors.
In TVA, selection of an object is synonymous with its encoding into a visual working memory store with limited capacity. The selection probability is determined (a) by an object's processing rate v, which in turn depends on the its attentional weight (w), and (b) by the capacity of the working memory store (if the store is filled, the selection process terminates). TVA parameters model the general processing efficiency of the information processing system (processing rate and storage capacity), and specific aspects of attentional weighting, namely top-down-control (filtering), and spatial distribution of attention.
The general efficiency is assessed within whole report, in which subjects are briefly presented with multiple stimuli,c
Exposure durations are short enough (< 0.5 s) to prevent mnemonic strategies such as verbal rehearsal.
The specific aspects of weighting are estimated from partial report, where subjects have to identify target objects, only, which are prespecified (e.g., with respect to color), whilst ignoring distractors. From the probability of target identification, attentional weights are derived for targets (wT), and for distractors (wD), separate for each visual hemifield. Top-down control, parameter α, is defined as the ratio wD /wT, averaged across hemifields. Thus, low α-values indicate high selectivity, while α-values close to one indicate unselective processing. Additionally, averaging across targets and distractors, separate weights can be estimated also for the left (wL) and for the right hemifield (wR). Parameter wλ, the spatial distribution of attention, is defined as the ratio wL /(wL + wR). While a value of wλ = 0.5 indicates balanced weighting, values of wλ > 0.5 indicate a leftward, and values of wλ < 0.5 a rightward spatial bias.
Rationale of the Present Study
To investigate the issues in question, a sample of normal subjects performed TVA-based whole- and partial-report, and a number of neuropsychological tests assumed to assess the same attentional constructs.
The first question was whether shortened whole and partial report experiments still produce sufficiently reliable and accurate TVA parameter estimations and what minimum number of trials is required, respectively. To assess the reliability of the estimates obtained at varying test lengths, we analyzed their robustness as a function of trial number using the method of bootstrapping (Efron & Tibshirani, 1998; Kyllingsbæk, in press; see also Bublak et al., 2005). Moreover, to assess the internal consistency, we analyzed the correlations between the short- and the full-length test estimates and tested whether they were significantly different.
The second question was how strongly and specifically the TVA parameter estimates are related to conventional neuropsychological tests. Therefore, we analysed their association with standard tests assumed to address the same attentional components on the one hand and with tests supposed to cover different attentional components on the other.
Finally, we examined whether the assumption of parameter independence can be empirically validated. A high test-internal specificity, that is low intercorrelations between the four parameters would indicate that they indeed reflect independent aspects of attention..
Our study assessed a rather homogeneous group of healthy, young, and bright subjects, and, therefore, has severe limitations. These include the inapplicability of the paradigms in acute patients, possible prolongations of test duration in patients, and the possibility that even shortened paradigms may be still too long to be incorporated in more comprehensive neuropsychological batteries.d
Having analyzed the minimum number of trials necessary to receive robust parameter estimations with the current number of stimulus positions (whole report: 10; partial report: 4), we can also develop even shorter paradigms by reducing the stimulus positions. Accordingly, versions with a central 5-letter column (whole report) and a 2-position row (partial report) are under way, that have only half of the current trials, are under way.
METHOD
Subjects
Thirty-eight healthy volunteers (psychology students) took part in our study. Of these, 35 subjects were included in the analysis (26 females, 9 males; mean age 22.1, SD = 3.3, range 19–35 years).e
Three subjects had to be excluded from analysis, for the following reasons: one had to be excluded because of technical problems during testing; one was found to suffer from a previously undiagnosed attentional disorder (confirmed by medical diagnosis); and one suffered from an injury to the dominant hand at the time of testing, which provided a handicap in performing some of the standard neuropsychological tests.
Procedure
The TVA experiments and the TAP (Test for Attentional Performance; Zimmermann & Fimm, 1993) subtests were PC-controlled and conducted in a dimly lit room. Stimuli were presented on a 17-inch monitor (1024- by 768-pixel screen resolution; 70-Hz refresh rate). Viewing distance was approximately 50 cm.
Each subject completed four test sessions (of maximally 1.5 hours), including two sessions for the different TVA experiments on one day, and two sessions for the standard tests on another day. The order of the different sessions (TVA versus standard tests) and the order of tests within one session were counterbalanced across subjects.
General method for whole and partial report
Both experiments had the same trial event sequence. First, subjects were instructed to fixate a central white digit, (0.3° visual angle) presented for 300 ms. Then, after a gap of 100 ms red and/or green letters (0.5° high × 0.4° wide) were presented on a black background for a brief predetermined exposure duration. The letters for a given trial were randomly chosen from the prespecified set {ABEFHJKLMNPRSTWXYZ}, with the same letter appearing only once. Each subject received the same displays in a random sequence. Stimuli were either unmasked or masked. Masks consisted of squares of 0.5° filled with a + and an x presented for 500 ms at each stimulus location.
The verbal report was performed in arbitrary order and without speed stressing. Subjects were instructed to report only those letters they had surely recognized. The experimenter entered the responses on the keyboard and then started the next trial.
Whole report
On each trial, a column of five equidistant letters was presented 2.5° of visual angle to the left or the right of fixation (see Figure 1). All letters were either red or green. Subjects' task was to report as many letters as possible. The experiment comprised two phases: In phase 1, three exposure durations were determined for phase 2, in which the data were collected.
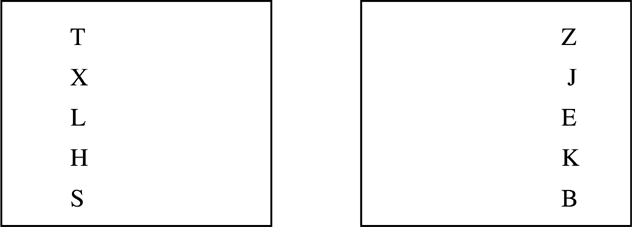
Different trial types of the whole report experiment with presentation of five equidistant letters in columns on the left or the right of the fixation point.
Phase 1 comprised 24 masked trials with an exposure duration of 86 ms. It was assessed whether the subject could, on average, report one letter (20%) per trial correctly. If this was achieved, 43, 86, and 157 ms, and if not, 86, 157, and 300 ms were used as exposure durations in the experimental phase 2. Here, letter displays were presented either masked or unmasked. In unmasked conditions, due to visual persistence, the effective exposure durations (Sperling, 1960) are prolonged, usually by several hundred ms.f
TVA assumes this prolongation, which is estimated by an additional parameter μ, to be constant across conditions (see Kyllingsbæk, in press).
The resulting six “effective” exposure durations were expected to generate a broad range of performance, tracking the early and the late parts of the accuracy/exposure duration function. There were 12 different conditions (2 hemifields × 3 exposure durations × 2 masking conditions) presented in 14 blocks of 48 trials each. Within each block, all conditions were equally frequent.
Partial report
On each trial, either a single target (letter), or a target plus a distractor (letter), or two targets (see Figure 2) were presented at the corners of an imaginary square with an edge length of 5°, centered on the screen. All letters were masked. Two letters were presented horizontally or vertically, but never diagonally. Subjects had to report only target letters (red for half and green for the other half of the subjects).
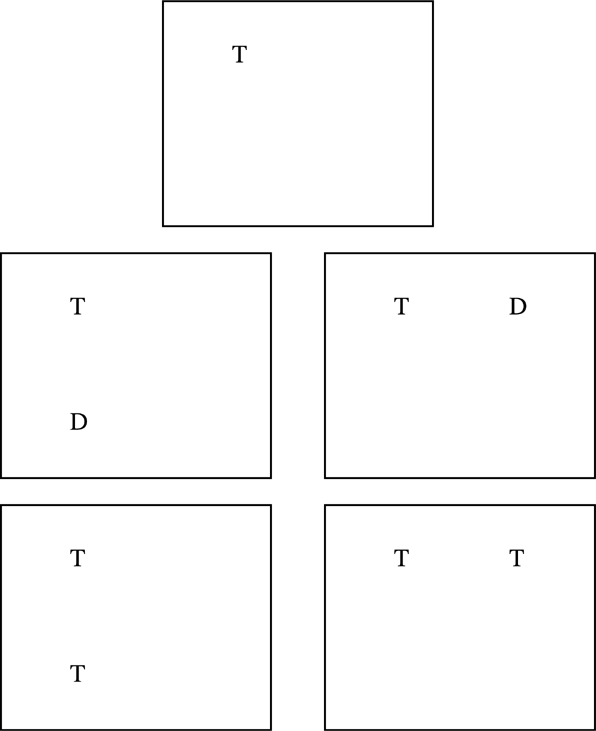
Different trial types of the partial report experiment with targets (depicted as “T”) and distractor letters (depicted as “D”). Targets and distractors differed with regard to color. For half of the subjects, targets were red and distractors were green and for the other half vice versa. Presentation of a single target (at the top), of a target accompanied by a distractor in the same or the opposite visual hemifield (left and right center) and of two targets in the same or in opposite hemifields (bottom left and right).
A pretest period (32 single target trials) with an exposure duration of 71 ms was used to test whether a subject was able to reach an accuracy of 60–80% for single target report. If the subject performed outside this range, the exposure duration in the experimental phase 2 was adjusted accordingly (extended to 100 ms if < 50% and to 86 ms if 50–60%; shortened to 57 ms if 80–90% and to 43 ms if > 90%). In the experimental phase (phase 2) there were 16 different conditions (4 single-target, 8 target-plus-distractor, and 4 dual-target conditions), with 42 trials each. Displays were presented in 14 blocks of 48 trials with equal frequency of conditions.
Clinical neuropsychological tests
Four standard neuropsychological tests were chosen to address the same attentional aspects as the four TVA parameters.
Processing speed. A simple response time task, the subtest “Alertness” from the TAP (Zimmermann & Fimm, 1993), was used to assess processing speed. This computerized task, requiring a speeded response to a visual stimulus, with or without a preceding warning signal, is assumed to measure tonic and phasic alertness.
Working memory storage capacity. The “Visual Memory Span” from the WMS-R (Härting et al., 2000) was used to measure working memory storage capacity. The examiner points at a sequence of 2–8 blocks on a board. The subject is required to repeat the sequences, either forwards or backwards, depending on the test condition. The dependent variable was the number of correct sequences.
Spatial distribution of attention. Because normal subjects perform at ceiling in typical spatial bias measurements (e.g., cancellation tests), we instead used the speeded “Visual Scanning” TAP-subtest, which may be more sensible to even a slight bias. The subjects' tasks is to indicate by button press, whether a target “square” with a gap in the upper edge is present among a grid of “square” elements. In order to assess scanning performance across the whole display and because of a speed-accuracy tradeoff in target-present trials (r = −.31, P < .05), we considered target-absent trials (50%) only. We measured speed (median response time) and accuracy (number of errors). The test is assumed to assess the ability of line-by-line scanning, which requires shifting attention from the left to the right and back. Any bias was assumed to interfere with shifting and become manifest in slower and more error-prone performance.
Top-down-control. A German Stroop task (FWIT; Bäumler, 1985) was used to assess top-down control. The test consists of three conditions: color-word reading, color-bar naming, and interference. The latter, in which the subject has to name the ink colors of incongruent color words by suppressing the highly automatized reading of the words, is assumed to measure susceptibility to interference. Since the top-down control parameter α is also assumed to measure resistance to interference, it was assumed that low values of TVA α estimates would be related to higher speed in the interference condition.
Intelligence. To assess the dependency of the four parameters on intelligence, the German MWT (Multiple-Choice Vocabulary Test; Lehrl et al., 1995) was used for IQ estimation.
RESULTS
In this section, we initially describe the qualitative pattern of performance obtained in the TVA experiments; we also report the degree of correspondence between the observed data and those predicted by the TVA model-based parameter estimates. The model-fitting procedure applied in the present study was largely identical to that used by Duncan et al. (1999).g
There was one exception, however: Instead of deriving separate values of C, K, and α for the left and right hemifields, we estimated one general value across both hemi-fields. The reason for this was that, in clinical settings as well as for testing normal observers, it is important to obtain estimates of the general (i.e., bilateral) perceptual speed, working memory storage capacity, and top-down control parameters (notwithstanding that hemifield differences in these parameters are of great interest in basic neuropsychological research). Note, however, that we did derive estimates for the parameter wλ, which indicates differences in the distribution of attentional weighting across the two visual hemifields.
Whole-Report
Figure 3 presents the observed data points of a representative subject (visual working memory storage capacity K= 3.69 elements; processing spread C = 23.68 elements/s), that is, the mean numbers of letters reported correctly as a function of effective exposure duration.h
For each subject, two further parameters were derived to estimate the effective exposure duration of each display: t0 (minimum effective exposure duration) and μ (effective additional exposure of an unmasked display). Since these parameters are of no further interest in the present study, they will not be discussed here. Details are available from the authors.

Whole report performance for a typical subject (s 18) representing the performance of the group (K = 3.5 elements; C = 22.3 elements/s). The mean number of correctly reported letters is shown as a function of effective exposure duration. Solid lines represent the best fits from the Theory of Visual Attention to the observations. The estimate of the visual working memory capacity K is marked by a dashed horizontal line. For this subject, exposure durations were 43, 86, and 157 ms, the estimated visual detection threshold, t0, was 9 ms, the prolongation of visual stimulus persistance in unmasked conditions, μ, was 132 ms. Thus, the six resulting effective exposure durations were 34, 77, and 148 ms in the three masked and 166, 209, and 280 ms in the three unmasked conditions.
Note: Mean(obs): observed mean; Mean(theo): predicted mean; K: working memory storage capacity
Each subject's qualitative performance pattern was quantitatively described by TVA model fitting, which produced estimates for processing speed C and working memory storage capacity K. Parameter C was estimated as the average of the two summed v values for the objects presented to the left and to the right of fixation, respectively and reflects the total rate of information uptake (number of elements per second), corresponding to the slope of the fitted curve at t0. Parameter K reflects, in effect, the maximum number of letters reported on any single trial.
The observed and the predicted mean scores for the different conditions showed a close correspondence. Across all subjects, the average Pearson product-moment correlation coefficient between the observed values and TVA's best fits to the data was 0.96 (SD: 0.02), explaining r2 = 90% (SD: 16%) of the accounted variance.
Partial-report
Figure 4 presents the mean proportion of correctly identified target letters for each hemi-field, separately for the five experimental conditions: single target letter; target accompanied by a distractor in the same or the opposite hemifield; and target accompanied by a second target in the same or in the opposite hemifield. Since exposure durations were individually adjusted, only the relative differences among the conditions are critical for parameter estimation.

Mean percentage of correctly reported targets presented either in the left or in the right hemifield. Each bar represents the mean in one condition: target presented alone, target accompanied by a distractor (D) in the same hemifield, target accompanied by a second target (T) in the same hemifield, target accompanied by a distractor in the opposite hemifield, target accompanied by a second target in the opposite hemifield. The error bars represent the standard errors.
In general, we found the performance pattern predicted by TVA and reported by other partial-report studies (e.g., Duncan et al., 1999): Accuracy was highest for single targets. Adding another target decreased performance more than adding a distractor. This pattern was, by and large, the same for both hemifields, with the exception that same-hemifield distractors disturbed slightly more in the left than in the right hemifield.
Again, the qualitative pattern of performance was quantitatively described by two TVA parameters. The model produced estimates of attentional weights for targets and non-targets, separately for each location. While wλ indicates the relative weights for the left compared to the right hemifield, α reflects the difference in relative weights for distractors compared to targets.
The mean scores observed in the various conditions and those predicted based on the best fits of the TVA model parameters α and wλ yielded a mean correlation of r = 0.87 (SD = 0.09), explaining r2 = 77% (SD: 15%) of the accounted variance.
Correspondence Between Short and Long Test Versions
Reliability of the parameter estimates obtained at different test lengths
At first, for each subject, parameter values were estimated based on all 672 trials performed in each experiment. Then, the estimations were repeated based on the first 384, 288, and 192 trials, respectively.
To test the robustness of the parameter estimates for different test lengths, a bootstrap method was applied (see Kyllingsbæk, in press). The original data set was resampled repeatedly with successively smaller numbers of trials included (672, 384, 288, and 192 trials). Accordingly, the bootstrapping samples produced consisted of 672, 384, 288, or 192 “new” observations. The algorithm was repeated 200 times for each test length. For each simulated data set, a TVA-based maximum likelihood fit was computed. The standard deviations of these bootstrapping estimates may be taken as quantitative estimates of the standard errors of the original parameter estimations (Habekost & Bundesen, 2003).
The mean parameter estimates across all subjects are presented in Figure 5, separately for the different “test lengths”. Some qualitative differences in the development of the four parameters can be seen as the test length decreased. The whole-report parameter estimates were quite constant (processing speed C: 23.44–25.58 elements/si
For one subject, a C value of 59.80 elements/s was estimated, which is more than three standard deviations above the mean estimate of the whole group. An analysis of the raw data revealed that this subject performed highly above the criterion level, even though the set of the shortest exposure durations was used. While the criterion was set to ∼20% (∼1 letter) correct at the intermediate exposure duration in the masked condition, this subject achieved 53% correct even at the shortest exposure duration. Since this subject performed at ceiling in most experimental conditions, the parameter estimation could not reasonably be performed, and he was excluded from further analysis.

Whole and partial report parameters estimated on the basis of 672, 384, 288, and 192 experimental trials. The filled circles represent the mean values of the regular parameter estimates across subjects. The error bars represent the mean standard errors for the individual estimates. They were estimated by 200 bootstrap repetitions for each exact estimate.
Note: C, processing speed (elements/s); K, visual working memory capacity (number of elements); alpha, effectiveness of top-down control of attention; wλ, spatial distribution of attentional weighting. Error bars indicate the standard errors of the estimated parameter values (as estimated by 200 bootstrapping repetitions).
The error bars indicate the mean standard errors (derived from the bootstrapping procedure) of the estimates across all subjects. They were rather small and constant for the whole-report parameters (C: always ∼5 elements/s; K, range: .1–.2 elements). This indicates a high robustness of individual estimations even with a test length of only 192 trials.
Concerning the partial-report parameters, the bootstrapping estimates suggested differential levels of reliability. For the wλ estimates, the standard errors were overall quite low and increased only slightly from 0.05 (672 trials) to 0.09 (192 trials), indicating high robustness. The estimation of the α parameter, by contrast, was less robust. The standard errors of the α estimates were generally higher; they further increased with decreasing test length; and they were particularly high at 192 trials (range .15–.36). Therefore, we chose a longer test version of 288 trials for our further analyses.j
The increase in alpha variability may be due to α being defined as the ratio of two stochastic variables. Such parameters will, all other things being equal, exhibit greater variability than regular stochastic variables.
Correlations between parameter estimates at different test lengths
To further assess the reliability of parameter estimates for the various test lengths, estimates based on the first 384, 288, and 192 trials, respectively, were correlated with those based on the 672 observations (see Table 1).
Intra-parameter-correlations: Correlation coefficients for TVA parameter estimates based on 384, 288, and, respectively, 192 trials with estimates based on all 672 trials

While the whole-report parameters were highly reliable even with inclusion of only the first 192 trials (r > .90), the partial-report parameters showed sufficient reliability (r ≥ .75) only when at least 288 trials were included.
Comparison of the mean parameter values
In Table 2, the means and standard deviations of the parameter estimates are listed separately for the long and the appropriate short test lengths.
Mean TVA parameter estimates, and associated standard deviations, for long and short test versions, and comparisons between means (pairwise t tests)

The mean estimates based on the short and on the long versions corresponded fairly well. The C values indicated that subjects could process approximately some 24 elements/s, and the K values suggested that subjects could maintain maximally 4 objects in parallel. The wλ-values suggested a slight bias to the left hemifield. The α (top-down control) values were about 0.6, which corresponds to targets having twice the attentional weight of distractors.
Relationship with conventional neuropsychological tests
As expected, most subjects performed normally in all clinical neuropsychological tests (see Table 3 for mean scores and standard deviations). However, some below-average scores were observed (simple response times: without/with warning signal: n = 4/n = 3; “Visual Scanning”: n = 1; “Color-Word Reading” Stroop: n = 2; Visual Span forward: n = 4). The standard deviations indicated a reasonable performance variability permitting to obtain significant correlations. Note that, since no significant difference was found between the simple response times with and without warning signal (P > .20), the combined mean of both conditions was used for the analyses.
Neuropsychological test scores (means and standard deviations)

Significant correlations with tests addressing corresponding functions were obtained for all TVA parameters (see Table 4). Parameter C showed a significant negative correlation with the simple response time, suggesting faster responses of subjects with higher processing speed. Parameter K was significantly correlated with the backward (not the forward) version of the block span test. Since we did not assume our subjects to have a systematic spatial bias, we used the absolute deviation of wλ from the optimum value 0.5 in any direction, Dev(wλ), as an index of the subject's general ability to attend equivalently to both hemifields. Highly significant negative correlations were found for Dev(wλ) with regard to both speed and accuracy of visual scanning, suggesting that balanced weighting was associated with faster and more accurate scanning. The parameter α, finally, showed a significant negative correlation selectively for the Stroop interference condition (not for the neutral conditions).
Correlation coefficients between TVA parameter estimates and traditional neuropsychological test scores. Correlations between parameters and tests assessing analogous attentional functions are printed in bold.

The correlations with theoretically unrelated tests were generally smaller than those with related tests (see Table 4). In most cases, they were nonsignificant, suggesting a remarkable specificity of the four parameters. Exceptions were a significant negative correlation of the parameter K with response time in the “Visual scanning” TAP-subtest and a significant correlation of the parameter Dev(wλ) with the no-interference conditions of the Stroop task.
Parameter independence
The interparameter correlations are listed in Table 5. They were very low and mostly nonsignificant. Only within whole report, a marginally significant correlation was found (r = .40, P = .05, 2-sided) for C and K.
Interparameter correlations

Relationship Between Parameter Estimates and Intelligence
Subjects reached a mean IQ score of 111.60 (SD = 11.78). We only found nonsignificant tendencies for a weak positive correlation of IQ with parameter K (r = .29, P > .05, 2-sided)—and for a weak negative one with parameter Dev(wλ) (r = −.30, P > .05, 2-sided). The parameters C (r = .20, P > .25) and α (r = .04, P > .80) appeared to be IQ-independent in our sample.
DISCUSSION
Combining the theory of visual attention (TVA) with the methods of whole and partial report provides parameter-based measurement of four attentional components: processing speed, working memory storage capacity, spatial distribution of attention, and top-down control. We investigated whether shorter versions of whole and partial report, that may be practicable for clinical application, deliver robust and accurate parameter estimations. Second, we examined whether the parameter are useful for the clinical neuropsychologist, that is, whether they are related to conventional tests. Third, we assessed the independence assumption of TVA, that is, whether the independently modeled parameters are also empirically unrelated.
With respect to the first, reliability issue, estimates for the whole report parameters C (processing speed) and K (storage capacity) obtained from 192 trials (lasting about 30 minutes) were very robust according to the bootstrapping analyses and also highly correlated to those obtained from the full-length version. Differences between the mean values derived from the two versions were small. For the partial report parameters, inclusion of 288 trials (also lasting about 30 minutesk
The exposure duration used in partial report is normally shorter than the mean exposure duration used in whole report. Also, the mean number of letters to be reported by the subject and, hence, the number of letters to be typed into the keyboard by the experimenter is reduced compared to whole report. Therefore, a higher number of trials can be performed within the same test duration.
With respect to the question of their clinical usefulness, it can first be stated that all parameter estimates were of a magnitude likely to be representative for young healthy subjects. While the mean K-value equals the supposed “magical number four” storage capacity (Cowan, 2001; Schneider, 1999), the processing rate C around 24 elements/s equals that of subjects of comparable age (Habekost & Bundesen, 2003). The mean top-down control α value indicates performance lying between “perfect selectivity” and “none-selectivity.” The mean spatial distribution of attention wλ-value denoted a slight leftward bias (“pseudo-neglect”) in healthy subjects, which has repeatedly been reported already (e.g. Jewell & McCourt, 2000). Thus, overall, the parameters appear to provide plausible quantitative measures for the underlying attentional components.
Furthermore, the four parameters seem to be related to conventional tests, as evidenced by higher correspondence with theoretically related, as compared to unrelated, scores. Processing speed C was significantly related only to the simple response-time “Alertness” test. Working memory storage capacity K showed a positive correlation with the backward visual span task. The backbard span may be less prone to internal strategies, such as chunking or rehearsal assumed to influence forward span task performance (Cowan, 2001; Duncan et al., 2003) and may, therefore, deliver more precise estimations of the real storage capacity. The additional significant negative correlation with “Visual Scanning” time implies that higher working memory storage capacity improves the parallel processing of multiple items, and therefore also line-by-line scanning speed. With respect to partial report, the significant correlation of the deviation of wλ with “Visual Scanning” accuracy and speed suggests a relation to the ability to shift attention from left to right and vice versa in this task. The same may hold for color-reading in the Stroop task as proposed by the significant correlation with speed in this task. The Stroop interference condition, however, was specifically correlated with the top-down control parameter α. Thus, the α estimates, although related to substantial uncertainty according to the bootstrapping analyses, seem to reflect the ability to select target over distractor information.
It should be noted that the correlations with conventional tests were generally not expected to be very high. After all, we considered a parametric approach based on TVA to be superior to conventional neuropsychological tests with respect to addressing attentional components specifically.
Given the nonsignificant correlations of the TVA parameters with IQ, they do not seem to strongly depend on global intelligence. However, subjects with higher IQs tended to have higher working memory capacity and reduced spatial bias. Furthermore, the homogeneous subject sample may lead to an underestimation of the real correspondence to intelligence. Also, since the MWT is assumed to measure crystallized intelligence (Lehrl et al., 1995), the correspondence with fluid intelligence remains to be assessed.
To address the functional independence of the four parameters, we analyzed their intercorrelations. By and large, these were nonsignificant, apart from a moderate correlation between the whole-report parameters C and K. Interestingly, similar correlations of r = .40 among verbal processing speed and working memory storage capacity were found previously (Cowan et al., 1998). While this might indicate some mutual influence of both parameters, alternatively, a third variable, like intelligence, may have moderated the association as suggested by the marginally significant correlation between K and IQ.
We conclude short whole and partial report versions to provide reliable, specific, and meaningful information about four aspects of attention that are of significance for clinical neuropsychological assessment.
ACKNOWLEDGMENTS
We wish to thank P. Boehm, S. Redl, A. Kendler, and S. Schuettler for assistance with data acquisition and manuscript preparation. Furthermore, we wish to thank C. Bundesen and T. Habekost, who provided outstanding expertise concerning the parametric analyses. We are grateful to the reviewers who provided valuable comments. A substantial part of this work has been carried out at the University Eichstaett-Ingolstadt. Preliminary results of this study were first presented at the Joint Meeting of the International Neuropsychological Society and the German Society for Neuropsychology, Berlin, Germany, 2003. This work was supported by grants from the Deutsche Forschungsgemeinschaft (Mu 773/6-1) to W.X. Schneider and H.J. Müller, the Carlsberg Foundation, and the National Research Foundation for the Humanities to S. Kyllingsbæk.
References
REFERENCES
Bäumler, G.
(1985).
Farbe-Wort-Interferenztest (FWIT) nach J. R. Stroop.
Göttingen:
Hogrefe.
Bublak, P.,
Finke, K.,
Krummenacher, J.,
Preger, R.,
Kyllingsbæk, S.,
Müller, H.J., &
Schneider, W.X.
(2005).
Usability of a theory of visual attention II: Evidence from two
patients with frontal or parietal damage.
Journal of the International Neuropsychological Society,
11,
000–000.
(this issue)Google Scholar
Bundesen, C.
(1998).
A computational theory of visual attention.
Philosophical Transactions of The Royal Society London B,
353,
1271–1281.Google Scholar
Bundesen, C.
(2002).
A general theory of visual attention. In
L. Bäckman &
C. von Hofsten (Eds.),
Psychology at the turn of the millennium. Cognitive, biological, and
health perspectives
(Vol. 1, pp.
179–200).
Hove:
Psychology Press.
Bundesen, C.,
Habekost, T., &
Kyllingsbæk, S.
(2005).
A neural theory of visual attention: bridging cognition and
neurophysiology.
Psychological Review,
112,
291–328.Google Scholar
Cowan, N.
(2001).
The magical number 4 in short-term memory: A reconsideration of
mental storage capacity.
Behavioral and Brain Sciences,
24,
1–68.Google Scholar
Cowan, N.,
Wood, N.L.,
Wood, P.K.,
Keller, T.A.,
Nugent, N.D., &
Keller, C.V.
(1998).
Two separate verbal processing rates contributing to short-term
memory span.
Journal of Experimental Psychology: General,
127,
141–160.Google Scholar
Desimone, R. &
Duncan, J.
(1995).
Neural mechanisms of selective visual attention.
Annual Review of Psychology,
18,
193–222.Google Scholar
Duncan, J.,
Bundesen, C.,
Olson, A.,
Humphreys, G.,
Chavda, S., &
Shibuya, H.
(1999).
Systematic analysis of deficits in visual attention.
Journal of Experimental Psychology: General,
128,
450–478.Google Scholar
Duncan, J. &
Owen, M.A.
(2000).
Common regions of the human frontal lobe recruited by diverse
cognitive damands.
Trends in Neurosciences,
23,
475–483.Google Scholar
Duncan, J.,
Bundesen, C.,
Olson, A.,
Humphreys, G.,
Ward, R.,
Kyllingsbæk, S.,
Raamsdonk, V.M.,
Rorden, C., &
Chavda, S.
(2003).
Attentional functions in dorsal and ventral simultanagnosia.
Cognitive Neuropsychology,
20,
675–701.Google Scholar
Efron, B. &
Tibshirani, R.J.
(1998).
An introduction to the bootstrap.
London:
Chapman & Hall.
Fan, J.,
McCandliss, B.D.,
Sommer, T.,
Raz, A., &
Posner, M.I.
(2002).
Testing the efficiency and independence of attentional
networks.
Journal of Cognitive Neuroscience,
14,
340–347.Google Scholar
Habekost, T. &
Bundesen, C.
(2003).
Patient assessment based on a theory of visual attention (TVA):
Subtle deficits after a right frontal-subcortical lesion,
Neuropsychologia,
41,
1171–1188.Google Scholar
Härting, C.,
Markowitsch, H.J.,
Neufeld, H.,
Calabrese, P.,
Deisinger, K., &
Kessler, J.
(2000).
WMS-R Wechsler Gedächtnistest—Revidierte Fassung.
Bern:
Hans Huber.
Jewell, G. &
McCourt, M.E.
(2000).
Pseudoneglect: A review and meta-analysis of performance factors in
line bisection tasks.
Neuropsychologia,
38,
93–110.Google Scholar
Kyllingsbæk, S.
(in press).
Modeling visual attention.
Behavior Research Methods.
Lehrl, S.,
Triebig, G., &
Fischer, B.
(1995).
Multiple choice vocabulary test MWT as a valid and short test to
estimate premorbid intelligence.
Acta Neurologica Scandinavica,
91,
335–345.Google Scholar
Peers, P.V.,
Ludwig, C.J.H.,
Rorden, C.,
Cusack, R.,
Bonfiglioli, C.,
Bundesen, C.,
Driver, J.,
Antoun, N., &
Duncan, J.
(2005).
Attentional functions of parietal and frontal cortex.
Cerebral Cortex,
15,
1469–1484.Google Scholar
Posner, M.I. &
Petersen, S.E.
(1990).
The attention system of the human brain.
Annual Review of Neuroscience,
13,
25–42.Google Scholar
Ross, S.M.
(2000).
Introduction to probability and statistics for engineers and
scientists.
San Diego:
Academic Press.
Schneider, W.X.
(1999).
Visual-spatial working memory, attention, and scene representation:
A neuro-cognitive theory.
Psychological Research,
62,
220–236.Google Scholar
Sperling, G.
(1960).
The information available in brief visual presentations.
Psychological Monographs,
74,
11.Google Scholar
Zimmermann, P. &
Fimm, B.
(1993).
Test for Attentional Performance (TAP).
Herzogenrath:
Psytest.
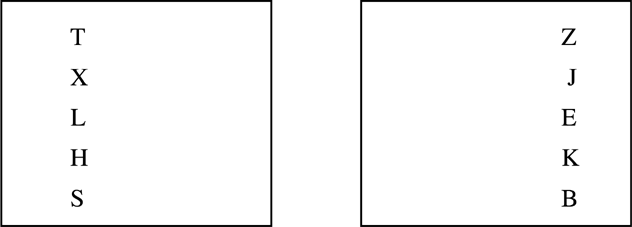
Different trial types of the whole report experiment with presentation of five equidistant letters in columns on the left or the right of the fixation point.
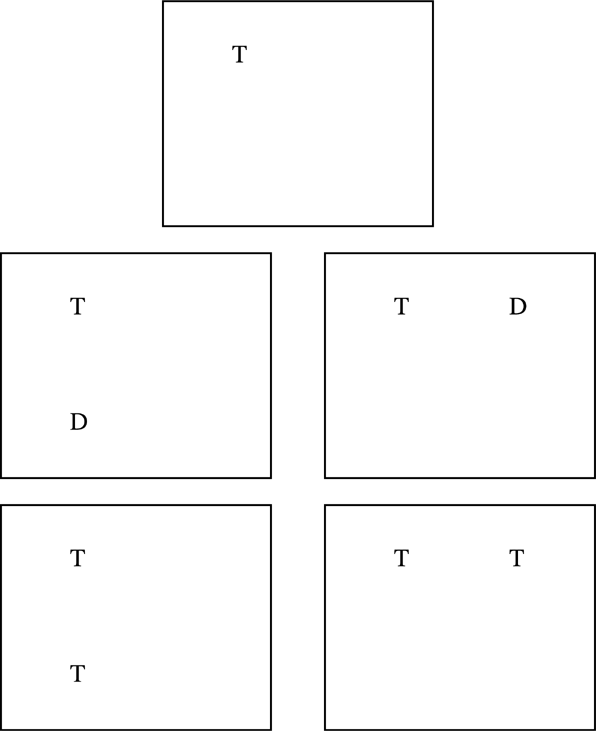
Different trial types of the partial report experiment with targets (depicted as “T”) and distractor letters (depicted as “D”). Targets and distractors differed with regard to color. For half of the subjects, targets were red and distractors were green and for the other half vice versa. Presentation of a single target (at the top), of a target accompanied by a distractor in the same or the opposite visual hemifield (left and right center) and of two targets in the same or in opposite hemifields (bottom left and right).

Whole report performance for a typical subject (s 18) representing the performance of the group (K = 3.5 elements; C = 22.3 elements/s). The mean number of correctly reported letters is shown as a function of effective exposure duration. Solid lines represent the best fits from the Theory of Visual Attention to the observations. The estimate of the visual working memory capacity K is marked by a dashed horizontal line. For this subject, exposure durations were 43, 86, and 157 ms, the estimated visual detection threshold, t0, was 9 ms, the prolongation of visual stimulus persistance in unmasked conditions, μ, was 132 ms. Thus, the six resulting effective exposure durations were 34, 77, and 148 ms in the three masked and 166, 209, and 280 ms in the three unmasked conditions.Note: Mean(obs): observed mean; Mean(theo): predicted mean; K: working memory storage capacity

Mean percentage of correctly reported targets presented either in the left or in the right hemifield. Each bar represents the mean in one condition: target presented alone, target accompanied by a distractor (D) in the same hemifield, target accompanied by a second target (T) in the same hemifield, target accompanied by a distractor in the opposite hemifield, target accompanied by a second target in the opposite hemifield. The error bars represent the standard errors.

Whole and partial report parameters estimated on the basis of 672, 384, 288, and 192 experimental trials. The filled circles represent the mean values of the regular parameter estimates across subjects. The error bars represent the mean standard errors for the individual estimates. They were estimated by 200 bootstrap repetitions for each exact estimate.Note: C, processing speed (elements/s); K, visual working memory capacity (number of elements); alpha, effectiveness of top-down control of attention; wλ, spatial distribution of attentional weighting. Error bars indicate the standard errors of the estimated parameter values (as estimated by 200 bootstrapping repetitions).

Intra-parameter-correlations: Correlation coefficients for TVA parameter estimates based on 384, 288, and, respectively, 192 trials with estimates based on all 672 trials

Mean TVA parameter estimates, and associated standard deviations, for long and short test versions, and comparisons between means (pairwise t tests)

Neuropsychological test scores (means and standard deviations)

Correlation coefficients between TVA parameter estimates and traditional neuropsychological test scores. Correlations between parameters and tests assessing analogous attentional functions are printed in bold.

Interparameter correlations
 You have
Access
- 82
- Cited by