Central-line–associated bloodstream infection (CLABSI) is associated with serious morbidity and mortality in intensive care units (ICUs) and is one of the costliest hospital-acquired infections (HAIs).Reference Sydnor and Perl 1 , Reference Zimlichman, Henderson and Tamir 2 In the province of Québec, the perceived public health importance of HAI due to a large C. difficile outbreak led to the development of provincial surveillance programs in 2003: Surveillance Provinciale des Infections Nosocomiale (SPIN) under the Institut National de Santé Publique du Québec (INSPQ).Reference Fontela, Platt and Rocher 3 Currently, all ICUs in Québec with ≥10 beds are required to report CLABSIs year-round to SPIN, giving the program the advantage of having representative population surveillance.Reference Fontela, Quach, Buckeridge, Pai and Platt 4 SPIN objectives include acquiring data to track epidemiology, incidence, and causative pathogens, as well as providing benchmark incidence rates. Importantly, the program’s continuous surveillance throughout the year enables both intra- and interfacility benchmarking of CLABSI rates and central line use.
Canadian and American surveillance have revealed an overall decline in CLABSI since 2006.Reference Dudeck, Edwards and Allen-Bridson 5 , 6 Québec CLABSI rates also reflected this downward trend from 2003 to 2009.Reference Fontela, Platt and Rocher 7 These declines coincided with the implementation of several important programs and guideline updates such as the Centers for Disease Control and Prevention (CDC) revised intravascular catheter-related infection prevention guidelinesReference O’Grady, Alexander and Burns 8 and the Canadian Patient Safety Institute’s program, Safer Healthcare Now! The Safer Healthcare Now! program was created in 2009 to support the implementation of evidence-based bundles of central-line insertion and maintenance and has been effective in decreasing CLABSI rates. 9 On a regional level, a survey of ICUs in Québec revealed that most ICUs implemented bundled practices; however, practices such as performing regular audits were less optimal in most adult ICUs.Reference Gonzales, Rocher and Fortin 10 A recent study of American pediatric ICUs (PICUs) showed similar bundle use and compliance practices.Reference Edwards, Herzig and Liu 11 Due to changing practices and overall decreasing CLABSI rates within the last decade, as seen in several national and regional surveillance programs including Québec, we aimed to determine the effect of changing practices and culture of CLABSI prevention efforts in Québec during the last 8 years, as well as to ascertain how SPIN rates compared with other populations to guide future prevention efforts. Our specific aims were (1) to describe CLABSI rates in Québec during the surveillance period, (2) to determine whether any significant rate trends existed, especially after newer guideline publications, and (3) to benchmark Quebec rates dynamically with annual SPIN, Canadian, and American surveillance CLABSI rates.
METHODS
SPIN Surveillance Network
SPIN is a year-round active and prospective CLABSI surveillance program, mandatory for all ICUs with ≥10 beds in the province of Québec since 2007, with individual-level data. ICUs with <10 beds voluntarily submit data. Retrospective analysis of the program’s reporting validity during the study period showed excellent results when compared with other regional surveillance networks, having a sensitivity and specificity of 88% and 92%, respectively.Reference Fontela, Rocher and Platt 12 By 2014, 70 ICUs from 51 different hospitals participated in the program (969 beds), comprising 33 nonteaching adult ICUs, 24 adult teaching ICUs, 8 neonatal ICUs (NICUs), and 5 PICUs. Of these, 57 ICUs (851 beds) participated in all 8 years of surveillance (Table 1) and were used in rate descriptions. All ICUs were included in benchmarking for standardized incidence ratio (SIR) analyses, regardless of full or partial participation because subgroup analyses demonstrated similar incidence. A previously published surveillance report of SPIN CLABSI rates included 2 years that overlap the present study (2007–2008 and 2008–2009);Reference Fontela, Platt and Rocher 7 nevertheless, because mandatory SPIN CLABSI surveillance began in 2007, we included data from 2007 onward for optimal validity.
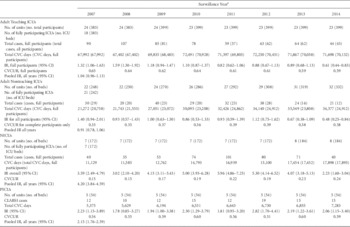
Total ICU Units, CLABSI Cases, CVC Days, Pooled Means (95% CI), CVCUR by Year, and ICU Type

NOTE. ICU, intensive care unit; CI, confidence interval; IR, incidence rate; CLABSI, central-line–associated bloodstream infection; CVC, central venous catheter; CVCUR, central venous catheter ratios (CVCUR); PICU, pediatric ICU.
aThe surveillance year begins April 1, which acts as day 1 of reporting period 1. Calendar years are written singly, eg, 2007 refers to the period from April 1, 2007, to March 31, 2008.
Definitions and CLABSI Identification
Central venous catheters (CVCs) were defined as intravenous catheters that end in a vessel in proximity to the heart, eg, the subclavian, internal jugular, or femoral vein. In accordance with NHSN and CNISP practices, peripherally inserted catheters, total implanted catheters, and umbilical catheters were also considered CVCs. SPIN has been following the National Healthcare Safety Network (NHSN) definition of CLABSI since April 1, 2010. 13 SPIN CLABSI cases from 2007 to 2010 were retrospectively recomputed to reflect the new definition. NHSN 2006–2008 data reports already reflected this new definition, whereas CNISP CLABSI reports adopted the change as of April 1, 2010. 6 , Reference Edwards, Peterson and Mu 14
Data Collection and Surveillance
Patients with CVC in the ICU were followed 48 h after CVC removal or discharge from the ICU. Infection control practitioners prospectively identified positive blood cultures in ICU patients, confirmed CVC placement and timing, and performed the chart review for criteria fulfillment. Data on CLABSIs that occurred between April 1, 2007, and March 31, 2015, were extracted in June 2015. The present study is a retrospective longitudinal cohort analysis that was approved by the INSPQ and did not require institutional board review because it was a secondary analysis of collected data.
Statistical Analysis
Pooled CLABSI incidence rates (IRs; cases per 1,000 CVC days), CVC utilization ratios (CVCURs, an indicator of CVC usage), and SIRs were calculated by ICU type (adult teaching or nonteaching, pediatric or neonatal) and by surveillance year. Incidence rate by each reporting period (1 calendar year comprises 13 4-week intervals) was examined for seasonal trends. The surveillance year begins April 1, which acts as day 1 of reporting period 1. Henceforth, calendar years written singly as “2007” refers to the start of surveillance year, which spans from April 1, 2007, to March 31, 2008. ICUs were defined as “teaching” if associated with medical training and research programs, and “nonteaching” otherwise. NICUs and PICUs are all associated with teaching hospitals. Poisson confidence intervals for rates and SIRs were used to compare CLABSI rates. Statistical calculations were performed using Stata version 14 (StataCorp; College Station, Texas).
SIRs use indirect standardization to compare rates between 2 populations.Reference Gustafson 15 SIRs were obtained by dividing the observed number of CLABSI cases by the expected number of cases. Expected rates were taken from a reference population and were multiplied by the observed number of CVC days to generate the expected numbers of cases. A SIR of 1 denotes no difference between the observed and expected number of CLABSIs; a SIR < 1 denotes a rate less than expected, and a SIR > 1 denotes a rate higher than expected. The 95% SIR confidence intervals (CIs) were derived using upper and lower 95% CI limits of CLABSI IRs to calculate the corresponding number of expected cases.
To examine intraregional CLABSI rate trends over time, we used pooled SPIN rates from April 2007 to March 2010 as the benchmark because several important prevention guidelines and initiatives were published in 2009 (eg, the Safer Healthcare Now! program in Canada and the World Health Organization’s launch of the Save Lives: Clean Your Hands initiative for hand hygiene).Reference Pittet, Allegranzi and Boyce 16 Using these pooled rates as benchmarks allowed us to measure the impact of these initiatives over time. To determine whether sustained rate trends existed, dynamic SPIN benchmarks were also used: SIRs for a particular year were calculated using pooled SPIN rates from the preceding 3 years for a given ICU type (eg, the 2010 adult teaching ICU SIR used pooled CLABSI rates of 2007 to 2009 in adult teaching ICUs as the benchmark to calculate expected rates).Reference Saman, Kavanagh and Abusalem 17
To compare SPIN rates with American and Canadian ICU CLABSI rates, we obtained published CLABSI rates from available CNISP and NHSN reports during 2007–2014. CNISP surveillance data were extracted from published reports for 2006, 2009, 2010, and 2011, 6 and NHSN data were extracted for years 2006–2008 (pooled rates)Reference Edwards, Peterson and Mu 14 and for subsequent yearly reports from 2009 to 2013.Reference Dudeck, Edwards and Allen-Bridson 5 , Reference Dudeck, Horan and Peterson 18 – Reference Dudeck, Weiner and Allen-Bridson 21 CDC/NHSN and consumer groups release ongoing reports publishing SIRs using NHSN 2006–2008 CLABSI benchmarks; therefore, we included this benchmark to be consistent with ongoing publications. However, to better explore whether SPIN rates were similar to NHSN rates over this period in the context of practice changes affecting both healthcare populations, dynamic SIRs using NHSN rates from the preceding 3 years were also used as benchmarks for the examined year. CLABSI rates for NHSN medical and/or surgical ICUs described as “major teaching” were used to obtain expected rates for SPIN adult teaching ICU SIR derivations; ICUs classified as “all other” were considered nonteaching adult ICUs. NICUs were not compared because they used birth weights in their reporting; this information was not collected in SPIN during the entire study period. However, as of April 2013, birth-weight-specific CLABSI rates were being reported.
Due to gaps in published reports between CNISP and SPIN during this period, the most recently available CNISP rates were used as benchmarks for any corresponding SPIN year. CNISP 2006 rates served as benchmarks for SPIN surveillance years 2007–2009 inclusive; pooled CNISP 2009–2010 rates were used to benchmark SPIN years 2010 and 2011; and CNISP 2011 rates were used to benchmark SPIN surveillance years 2012–2014, inclusive. Because the vast majority of CNISP hospitals are tertiary hospitals with academic affiliations, adult nonteaching ICUs were excluded from CNISP SIR derivations.
RESULTS
CVCURs and Pooled IRs
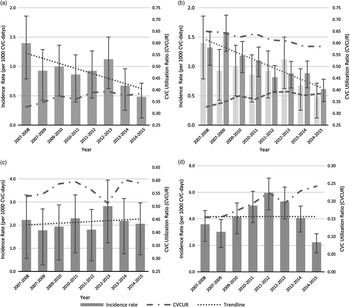
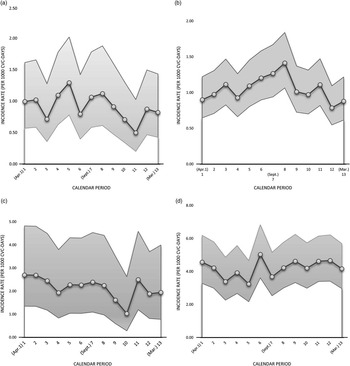
Total participating ICUs, CLABSI cases, CVC days, CVCUR, and pooled IR by year and ICU type are shown in Table 1. Over the surveillance period, ICU participation increased from 56 to 67 facilities, 11 of which were nonteaching adult ICUs. A total of 1,428 laboratory-confirmed CLABSIs and 970,498 CVC days were recorded, and the overall pooled mean rate was 1.47 (95% CI, 1.40–1.55) cases per 1,000 CVC days. Restricting analysis to ICUs that participated for the entire surveillance period, the overall incidence remained at 1.49 (95% CI, 1.41–1.57). Incidence rates and CVCURs by ICU type and year are shown in Table 1 and illustrated in Figure 1. Figure 2 shows rates by reporting period: no significant evidence of seasonality was observed in rates for each ICU type. CVCURs for adult teaching and nonteaching, pediatric, and neonatal ICUs, which participated for the entire 8 years were 0.62, 0.37, 0.57, and 0.20, respectively (Table 1).
Incidence Rate (IR) expressed as CLABSI cases per 1,000 CVC days, with 95% Poisson confidence interval bars, and central venous catheter utilization Ratios (CVCURs) by year for (a) Adult nonteaching ICUs, (b) Adult teaching ICUs, (c) PICUs, and (d) NICUs.

SIRs Against SPIN 2007–2009 and NHSN 2006–2008 Benchmarks
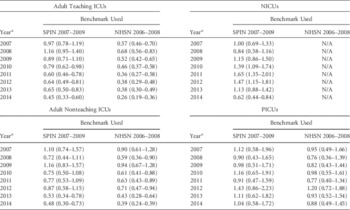
SIRs with fixed SPIN 2007–2009 and NHSN 2006–2008 benchmarks were calculated to study rate changes over time before and after important guideline and program launches in 2009–2010. Table 2 presents SIRs for each ICU type and by year: adult teaching ICUs showed a significant rate decline over the period, with 2014 SIRs of 0.45 (95% CI, 0.33–60) and 0.26 (95% CI, 0.19–0.36) using SPIN and NHSN benchmarks, respectively. Adult nonteaching ICUs also decreased, with a SPIN SIR of 0.48 (95% CI, 0.30–0.73) and an NHSN SIR of 0.39 (95% CI, 0.24–0.59) in 2014. PICUs did not show a significant rate change with either benchmark. Neonatal ICU rates varied; a significant rate increase was observed in SIRs for years 2011 and 2012, followed by a significant rate decrease in 2014, with an SIR of 0.62, (95% CI, 0.44–0.84).
Standardized Incidence Rate (SIR) by Intensive Care Unit (ICU) Type Using Baseline NHSN 2006–2008 and SPIN 2007–2009 Rates as Benchmarks for All SPIN Surveillance Years from 2007 to 2014

NOTE. NHSN, National Healthcare Safety Network; SPIN, Surveillance Provinciale des Infections Nosocomiale; NICU, neonatal ICU; PICU, pediatric ICU; N/A, not available.
a The surveillance year begins April 1, which acts as day 1 of reporting period 1. Calendar years are written singly, eg, 2007 refers to the period from April 1, 2007, to March 31, 2008.
SIRs Using Dynamic Benchmarks
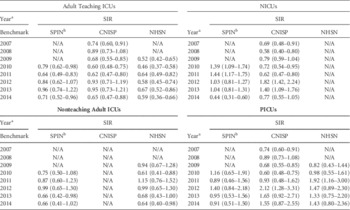
Dynamic SIRs using SPIN, CNISP, and NHSN benchmarks by ICU type are shown in Table 3. For adult teaching ICUs using SPIN benchmarks, rates for most years were similar to the preceding year’s rates, except for 2014, which showed a statistically significant decline with an SIR of 0.71 (95% CI, 0.52–0.96). With CNISP benchmarks, SPIN adult teaching ICUs had lower rates compared with the most recent CNISP rates published in 2007, 2009–2011, and 2014. Dynamic NHSN benchmarks yielded significantly lower SIRs for adult teaching ICUs for all years. In adult nonteaching ICUs, SIRs in 2013 and 2014 using SPIN benchmarks showed significantly lower rates compared with preceding years, and SIRs using NHSN benchmarks were significantly lower in 2010 and 2014.
Standardized Incidence Rate (SIR) Using Dynamic SPIN, NHSN, or CNISP Benchmarks of CLABSI Rates of Either the Preceding 3 Years or the Most Recent Rate, by Intensive Care Unit (ICU) Type

NOTE. NHSN, National Healthcare Safety Network; SPIN, Surveillance Provinciale des Infections Nosocomiale; CNISP, Canadian Nosocomial Infection Surveillance Program; NICU, neonatal ICU; pediatric ICU; N/A, not available.
a The surveillance year begins April 1, which acts as day 1 of reporting period 1. Calendar years are written singly, eg, 2007 refers to the period from April 1, 2007, to March 31, 2008.
b SPIN dynamic benchmarks for each year were calculated using the incidence rates for preceding 3 years of surveillance; dynamic SIRs for SPIN surveillance years 2007–2009 were thus not calculated because it is the benchmark.
NICU SIRs showed significantly higher rates with SPIN benchmarks in 2010 and 2011, having SIRs of 1.39 (95% CI, 1.09–1.74) and 1.44 (95% CI, 1.17–1.75), respectively. Likewise, using CNISP benchmarks, NICUs SIRs for 2012 (1.82; 95% CI, 1.42–2.24) and 2013 (1.40; 95% CI, 1.09–1.76) were also significantly higher. PICUs demonstrated no significant differences in dynamic SIRs using SPIN data, but they did yield significantly higher SIRs when using NHSN benchmarks in 2011 (SIR 1.92; 95% CI, 1.16–3.00) and CNISP data in 2012 (SIR 2.12; 95% CI, 1.28–3.31).
DISCUSSION
From 2007 to 2014, the overall rate of 1.49 cases per 1,000 CVC days for all ICU types was comparable to CLABSI rates in other developed countries after bundle intervention, such as Germany (1.64 cases per 1,000 CVC days in 2008–2010),Reference Hansen, Schwab, Schneider, Sohr, Gastmeier and Geffers 22 and Victoria, Australia (1.26 cases per 1,000 CVC days in 2009–2013).Reference Worth, Spelman, Bull, Brett and Richards 23 Neither a seasonality effect nor a “July effect” on rates due to influx of new residents in hospitals was identified.Reference Young, Ranji, Wachter, Lee, Niehaus and Auerbach 24
Importantly, Québec adult teaching and nonteaching ICUs showed lower and decreasing CLABSI rates over the surveillance period. Later, adult teaching and nonteaching ICU rates demonstrated statistically significant declines when using SPIN 2007–2009 benchmarks, decreasing by 55% (95% CI, 40%–67%) for adult teaching ICUs, and by 52% (95% CI, 27%–70%) for adult nonteaching ICUs in 2014. Using dynamic benchmarks to examine significant year-to-year changes, SPIN adult ICUs also had lower rates compared with NHSN and CNISP benchmarks for most years. SIR was not statistically significant when using dynamic SPIN benchmarks, perhaps to a lack of power because SPIN is a smaller network. Post-hoc power calculation showed that power was <80%, ranging from 5% to 51% for most ICU types and most years. Dynamic adult nonteaching ICU SIRs with NHSN referents were more comparable to SPIN rates overall, with significantly lower SIRs in 2008 and 2010.
Adult ICU rate reduction may be attributed to several factors. In 2009, a national campaign from the Canadian Patient Safety Institute implemented guidelines on the use of evidence-based bundles in hospitals. Furthermore, greater HAI awareness from updated CDC intravascular catheter guidelines in 2011 and WHO hand hygiene recommendations in 2009 may have contributed to decreasing ratesReference O’Grady, Alexander and Burns 8 , Reference Pittet, Allegranzi and Boyce 16 ; this effect was seen in a multicenter time series study in Germany.Reference Hansen, Schwab, Schneider, Sohr, Gastmeier and Geffers 22 SPIN rates for adult teaching ICUs were comparable to CNISP benchmarks, suggesting Québec CLABSI interventions paralleled that of national efforts. Recent results from 1 Québec academic center with 7 ICUs demonstrated continual decreases during the last 8 years of stepwise prevention.Reference Paquet, Frenette, Patterson and Decary 25 Moreover, surveillance in itself has been shown to decrease rates of device-associated infections, which may in part explain decreasing rates prior to guideline changes.Reference Gastmeier, Schwab, Sohr, Behnke and Geffers 26
Unlike adult ICUs, Québec NICU and PICU rates did not show the same downward trend. In PICUs, no significant rate changes were observed using either fixed or dynamic SPIN-derived SIRs, although smaller sample size should be noted. PICU rates at outset of SPIN surveillance were comparable with NHSN rates, and lower than CNISP rates. SPIN PICU rates remained constant over time with no decrease in rates during the period, while NHSN and CNISP PICU rates decreased more than SPIN PICU rates.
When compared with SPIN 2007–2009 benchmarks, SPIN NICUs had statistically significant rate increases from 2007 to 2011, peaking at 5.96 (95% CI, 4.86–7.25) cases per 1,000 CVC days in 2011, corresponding to an SIR of 1.65 (1.35, 2.01). Subsequently, rates and SIR declined, resulting in a statistically significant SIR decreases of 48% (95% CI, 16%–56%). Prior to 2012, NICU SPIN SIRs for most years were significantly lower using CNISP benchmarks; however, CNISP-derived SIRs became significantly higher in 2012–2013. Similarly, dynamic SPIN-derived SIRs were also significantly higher in 2010–2012.
Higher NICU and PICU rates may have several explanations. First, evidence for insertion and maintenance bundles in these populations are less robust than in adults. Several studies show that children have longer central catheter dwell times, emphasizing greater importance on maintenance bundle adherence.Reference Miller, Griswold and Harris 27 , Reference Milstone, Reich and Advani 28 Consequently, there is greater heterogeneity in bundle element types for children than for bundles designed for adults.Reference Huskins 29 , Reference Smulders, van Gestel and Bos 30 Successful strategies described include incorporating elements based on facility-specific challenges, involving parents in prevention efforts, and holding regular meetings with stakeholders to discuss outcomes and directions.Reference Fisher, Cochran and Provost 31 – Reference Neill, Haithcock and Smith 33 The rising NICU and PICU rates during in Québec around 2012 may also be due to outbreaks leading to persisting local CLABSI endemics. For example, between 2010 and 2013, 46% of all CLABSI NICU cases and 52% of all PICU CLABSIs originated in 1 facility, compared to 30% and 37%, respectively, in that facility for all other years. HAI rates also greatly differ across NICUs in Canada and may be explained by regional strains, difference in case mix, and clinical practices.Reference Aziz, McMillan and Andrews 34 Québec has 4 large academic centers, a distinguishing feature offering unique challenges. Following a combination of molecular and epidemiological characterization of what led to the rate increase and subsequent decline in PICUs and NICUs, sharing of knowledge and strategies regularly among the 4 centers will be important for future prevention efforts.
Strengths and Limitations
A major strength of the study is the complete population-level surveillance of SPIN ICUs, which includes a mix of different hospitals (both teaching and nonteaching) and ICU types in Québec, which lead to accurate CLABSI benchmarking. This surveillance program has been validated in the past and has been shown to be accurate,Reference Fontela, Platt and Rocher 7 resulting in greater accuracy in intraregional rate comparisons. That said, as always when comparing rates and generalizability between different networks, differences in surveillance methods and infection control practice should be kept in mind. Nevertheless, here, both incidence rates and SIRs illustrate that CLABSI rates are declining in Québec adult ICUs during 2007 to 2014.
Our study demonstrates that CLABSI rates in adult teaching ICUs in Québec were significantly lower than CNISP and NHSN rates and that rates continued to decline throughout the surveillance period. SPIN adult nonteaching ICUs rates also decreased, at a pace more comparable to NHSN nonteaching adult ICUs. On the contrary, IRs in SPIN NICUs and PICUs increased from 2011 to 2013, unlike other American and Canadian facilities, which saw a continual decline in rates. Future efforts should be directed at delineating and understanding causes of persistently higher rates in the NICU and PICU and at identifying strategies to further decrease these rates.
Incidence by each calendar period for each ICU type by year for (a) Adult nonteaching ICUs, (b) Adult teaching ICUs, (c) PICUs, and (d) NICUs. Period are calendrical, with April 1 (start of yearly reporting period) corresponding to period 4 in graphs. Shading represents 95% CI.

ACKNOWLEDGMENTS
We would like to thank all the infection control personnel from participating facilities who make this surveillance possible.
Financial support: C.Q. has received funding from GlaxoSmithKline, Pfizer, Sage, and AbbVie for research grant or support for unrelated research projects. The remaining authors have no financial relationships to disclose.
Potential conflicts of interest: All authors report no conflicts of interest relevant to this article.