Only those who cast a ballot determine the outcome of an election. Yet virtually all democracies exhibit a considerable degree of unequal political participation. Voters tend to be older, richer, more educated, and more conservative than non-voters (Nevitte et al., Reference Nevitte2009; Leighley and Nagler, Reference Leighley and Nagler2013; Fujiwara, Reference Fujiwara2015). This representational inequality may lead to biases in public policy because elected officials respond to the needs of those who are politically active (Lijphart, Reference Lijphart1997; Butler, Reference Butler2014). Moreover, many worry that low turnout prepares the ground for affluent special interests influencing the policymaking process, often to the detriment of the public good (Bolling, Reference Bolling1986). Therefore, higher turnout may cause decisive shifts in public policy, a conjecture that led President Obama to note that “it would be transformative if everybody voted—that would counteract money more than anything.”Footnote 1
Political jurisdictions increasingly rely on the availability of voting-by-mail to counteract growing voter fatigue. However, we still lack systematic assessments of how changes in the costs of voting affect the multidimensional composition of turnout. Such an assessment requires knowledge about how the reform affects the turnout probabilities of different political and sociodemographic subgroups. In contrast to best current practice, this necessitates estimating mobilization effects separately for each subgroup. This is because the common approach which relies on multiple regression answers the purely hypothetical question of how the reform mobilizes a specific group assuming that the probability of voting among all other groups remains completely unaffected. However, since most reforms mobilize or de-mobilize along several dimensions simultaneously, this assumption may not be plausible. Second, assessing whether an electoral reform increases representational inequality necessitates a multidimensional comparison of the composition of turnout with and without the electoral reform. Finally, this information should be benchmarked against the sociodemographic and political composition of the voting-eligible population.
We implement this approach and study the long-term effects of postal voting on turnout in direct legislation in Switzerland (1981–2009). In contrast to electoral reforms such as universal suffrage, literacy tests, or poll taxes, postal voting does not obviously imply differential effects that directly relate to sociodemographic characteristics. Instead, by offering citizens more convenience, all-mail elections promise to mobilize less likely voters. At the same time, postal voting may still have differential mobilization effects (Berinsky et al., Reference Berinsky, Burns and Traugott2001; Gerber et al., Reference Gerber, Huber and Hill2013) since the propensity to vote correlates with socioeconomic status (Nevitte et al., Reference Nevitte2009) and political preferences (Tucker et al., Reference Tucker, Vedlitz and DeNardo1986; Gomez et al., Reference Gomez, Hansford and Krause2007). Therefore, postal voting could benefit some political agendas, parties, or ideological platforms more than others. Similarly, the availability of voting by mail could particularly activate citizens with low levels of political interest and knowledge.
To evaluate these and related predictions, we exploit the sequential introduction of postal voting in Swiss cantons as a natural experiment (Funk, Reference Funk2010; Hodler et al., Reference Hodler, Luechinger and Stutzer2015). We analyze large individual-level and referendum-level data that offer detailed insights into how the introduction of postal voting changes the representativeness of turnout in referendums to decompose the average turnout increase into its political and sociodemographic elements. Based on an analysis of over 200 referendums from 1981 to 2009 in combination with survey data from 79,000 individuals, we subsequently simulate the consequences of postal voting on direct-democratic decisions.
The results suggest that the positive effect of postal voting on turnout results from a largely equal increase in participation across ideological orientation and partisan identification, political knowledge, trust in government, age, employment status, religious denomination, and place of residence. Our estimates also reveal some degree of differential mobilization since we find that postal voting more strongly increases turnout among high earners, citizens with medium levels of education, and those who are less interested in politics. Yet newly mobilized voters are not systematically less informed about the issues at stake according to objective political knowledge measures that ask respondents to state the name and content of each ballot proposition. Additional results indicate that the mobilization effects we document have only limited impact on the representativeness of turnout as well as referendum outcomes. We elaborate on the implications of our findings for the study of representational inequality and electoral reforms in the conclusion.
Cost sensitivities, turnout, and postal voting
Turnout constitutes an aggregate phenomenon that results from citizens’ individual decisions to participate in an election, which, in turn, depends on the expected costs and benefits of voting (Downs, Reference Downs1957; Riker and Ordeshook, Reference Riker and Ordeshook1968). A large literature has examined how changes in the cost of voting affects turnout using observational, field-experimental, and lab-experimental data (see Feddersen Reference Feddersen2004 for a review). For example, turnout responds to factors such as bad weather (Sinclair et al., Reference Sinclair, Hall and Alvarez2011; Bechtel and Hainmueller, Reference Bechtel and Hainmueller2011; Gomez et al., Reference Gomez, Hansford and Krause2007), the proximity of polling stations (McNulty et al., Reference McNulty, Dowling and Ariotti2009; Brady and McNulty, Reference Brady and McNulty2011), electronic (Fujiwara, Reference Fujiwara2015) and early voting (Burden et al., Reference Burden2014), as well as the existence of compulsory voting laws (Panagopoulos, Reference Panagopoulos2008; Bechtel et al., Reference Bechtel, Hangartner and Schmid2018).
Our interest is in the turnout effects of postal voting which seems increasingly popular among pundits and policymakers to counteract growing voter fatigue and representational inequality. As Tucker et al. (Reference Tucker, Vedlitz and DeNardo1986) have argued, it is useful to distinguish between two sets of voters. The first type comprises citizens who almost always turn out (“likely voters”) while the second type are individuals who have a lower propensity to participate in political collective action. Low propensity or less likely voters offer the most potential for electoral reforms intended to increase political participation. It is well established that less likely voters are unevenly distributed across characteristics such as knowledge, education, and income (Berinsky, Reference Berinsky2005; Enos et al., Reference Enos, Fowler and Vavreck2014). This means that postal voting may be most effective among those who are, for example, less politically knowledgeable, less educated, and low income (Nevitte et al., Reference Nevitte2009; Hodler et al., Reference Hodler, Luechinger and Stutzer2015). It is also well known that civic engagement is related to political interest (Verba et al., Reference Verba, Schlozman and Brady1995) as it reduces the net costs of collecting and processing information required for forming a consistent opinion on an issue (Zaller, Reference Zaller1992). Therefore, postal voting may mobilize those with low political interest more strongly than those who tend to be more interested in politics.
Previous empirical work has mostly explored the impact of postal voting in selected American states and for certain types of elections. Southwell and Burchett (Reference Southwell and Burchett1997) report that in a 1996 special Senate election in the state of Oregon additional voters mobilized by the opportunity to vote by mail were more educated and better informed about politics (Southwell and Burchett, Reference Southwell and Burchett2001). However, Gronke and Miller (Reference Gronke and Miller2012) show that these initial findings do not generalize over time and suffer from replicability problems. Gerber et al. (Reference Gerber, Huber and Hill2013) document that turnout increased in all-mail elections in Washington State and that this effect was more pronounced among less likely voters. Evidence on the effects of postal voting on turnout in referendums is scant and mixed. Hodler et al. (Reference Hodler, Luechinger and Stutzer2015) find that in Swiss referendums postal voting increased turnout significantly and mostly mobilized citizens with low levels of education and knowledge while Funk (Reference Funk2010) reports that postal voting had an insignificant or even negative effect on turnout that depends on municipality size. More recently, Schelker and Schneiter (Reference Schelker and Schneiter2017) document that providing citizens with postage-paid envelopes to return their ballots increases turnout by two to four percentage points.
It is important to note that even if an electoral reform such as the introduction of postal voting does not have differential mobilization effects across political and sociodemographic subgroups, this may still affect the outcomes of policy choices because the initial turnout propensities of these subgroups vary. Therefore, even uniform mobilization effects can lead to differential changes in the sociodemographic composition of turnout. As an example, let us assume an equal share of young and old citizens in the population. Suppose that without postal voting, turnout among young individuals is 20 percent and turnout among older citizens is 90 percent. This implies that the share of older individuals in the age composition of turnout is $( 0.5\times 0.9) /( 0.5\times 0.9 + 0.5\times 0.2) = 0.81$ and the turnout share of the young is $0.19 = 1-0.81$
 . Suppose that postal voting is introduced and it uniformly increases the probability of voting by 5 percentage points. The resulting share of older voters is $0.79 = ( 0.5\times 0.95) /( 0.5\times 0.95 + 0.5\times 0.25)$
 and, consequently, the share of young voters is 21 percent. Thus, postal voting has decreased the share of older voters in the age composition of turnout by 2 percentage points ($-0.02 = 0.79-0.81)$
 while the share of young voters has increased by 2 percentage points. This differential total effect—despite a homogeneous treatment effect—underscores the importance of estimating the impact of policy instruments that aim to increase political participation on the composition of turnout even if the mobilization effects themselves are homogeneous across subsets of the population.
We implement this approach to explore the impact of postal voting on the representativeness of turnout using individual- and aggregate-level data from Switzerland. Our research design exploits the sequential introduction of postal voting to (i) estimate its total mobilization effect, (ii) explore effect heterogeneity by sociodemographic and political subgroups, (iii) compute the impact of the estimated effects on the composition of turnout, and (iv) provide point predictions for referendum outcomes to gauge the policy relevance of postal voting in the context of direct legislation.
Background and data
Direct democracy and postal voting in Switzerland
The Swiss political system comprises several direct-democratic instruments. The first type offers the possibility of preventing policies that change the status quo (mandatory and optional referendum). All federal-level constitutional amendments and international treaties have to be ratified in a mandatory referendum. Moreover, the so-called optional referendum allows citizens to challenge all federal bills passed by the Swiss parliament and put them to a vote conditional on having met a signature requirement.Footnote 2 The second type of direct-democratic instruments consists of the popular initiative which allows citizens to initiate direct legislation, i.e., to change the status quo.Footnote 3 The use of direct democratic instruments has increased strongly in the past decades. Between 1848 and 1949, the Swiss voted only on about 1–2 ballot propositions per year. In the second half of the 20th century, this number increased to 7 ballot measures per year. In our sample period (1981–2009), Swiss citizens voted on 8 propositions per year on average.
After World War II, Switzerland experienced a steady decline in turnout.Footnote 4 To counteract growing voter fatigue and respond to demands for more convenient forms of voting (Biggers and Hanmer, Reference Biggers and Hanmer2015), the 26 cantons began to sequentially introduce postal voting over a period of almost 30 years, starting in 1978 with Basel-Landschaft and ending with Ticino in 2005. The sequential roll-out of postal voting took place in two phases (see Table A.1 in the Appendix). In the first phase, postal voting remained limited to those who were unable to vote in person for health-related or important work-related reasons (Luechinger et al., Reference Luechinger, Rosinger and Stutzer2007, 171). In the second phase, all citizens were allowed to vote by mail. Swiss authorities sequentially implemented a convenient version of postal voting by automatically mailing each citizen a ballot that could either be used to vote in person at the polling station or mailed back. The sequential introduction of postal voting reduces concerns about heterogeneity since we observe a large set of voters in the treatment and the control condition who vote on the very same ballot measures. Therefore, a large set of temporal and contextual covariates are constant by design. For example, although turnout and vote choice will depend on the complexity of a ballot measure, this factor does not confound our results because all individuals in our data consider the same propositions at a given point in time. We are not aware of other major changes to Swiss electoral institutions that were timed with the sequential, canton-level introduction of postal voting.Footnote 5
The sequence in which postal voting was introduced was plausibly exogenous to potential confounders such as the content of the ballot propositions. This is because of the pronounced decentralized structure of the Swiss political system in which federal authorities decide on the timing and content of federal referendums while each canton decides whether or not to make postal voting available. Moreover, the Swiss government (Bundesrat) announces which propositions will be put on the ballot only six months before the referendum date. This does not leave enough lead time for cantons to strategically implement postal voting to affect the outcome of a scheduled referendum.
Data
Our canton-level referendum data come from the Swiss Federal Statistical Office and covers all federal referendums from 1981 to 2009. This includes both salient foreign policy decisions, such as the referendum on Switzerland's membership in the United Nations (1986, 2003), participation in the European Economic Area (1992), and several bilateral agreements with the European Union (2000, 2005) as well as important domestic policy choices, including several referendums on welfare programs (1993, 2004, 2008), immigration (1988, 1996, 2000), and the protection of gay rights (2005). Turnout in referendums varies substantially. For example, turnout was 42 percent on 9 February 2003 when the Swiss decided whether to expand direct-democratic rights and how to reform public hospital financing. In contrast, turnout reached 89 percent on 6 December 1992 when a majority of Swiss voters rejected membership to the European Economic Area.
Our individual-level data draws on the VOX telephone surveys which are conducted directly after each federal referendum on a representative sample of the adult population (FORS, 2012).Footnote 6 In total, our data comprises 79,041 respondents who considered over 200 ballot propositions from 1981 to 2009.Footnote 7 The variables include reported turnout, vote choice, and a large set of sociodemographic and political covariates. The appendix provides detailed information about the coding and measurement of these variables.
The mobilization effect of postal voting
We first estimate the average mobilization effect of postal voting using actual referendum data in combination with a difference-in-differences design. Against this behavioral, aggregate-level benchmark we establish our ability to replicate the overall mobilization effect when analyzing our survey data. Before turning to the difference-in-differences estimates, we probe the plausibility of the parallel trends assumption which is a key identifying assumption in the difference-in-differences design.
Parallel trends assumption: placebo tests
An advantage of the institutional context in which we estimate the impact of postal voting on turnout in federal referendums is that voters in cantons that practiced postal voting and voters in cantons that did not practice postal voting decided on the exact same ballot propositions largely within the same time frame. Therefore, many potential sources of heterogeneity such as the complexity of the ballot measure, changes in the domestic political climate, and variation in geopolitical conditions will be held constant by design. At the same time, the credibility of this research design in identifying a causal effect ultimately relies on the parallel trends assumption. This assumption requires that turnout in the cantons that introduced postal voting would have evolved similarly to turnout in the cantons that had not (yet) introduced postal voting. Although it is impossible to test this assumption directly since it involves a counterfactual outcome that remains unobserved, we can assess its plausibility by exploring trends in turnout prior to the availability of postal voting. This placebo test is typically implemented by comparing trends in the outcome variable one period before the intervention. Since we have a much longer time series, we are able to assess the plausibility of the parallel trends assumption on a larger set of pre-treatment periods.
Figure 1 plots the turnout dynamics in treated and untreated cantons over event time using official, canton-level referendum data. The event of interest is the introduction of postal voting (${\rm event\ time} = 0$ ). We find that average turnout levels, averaged across five consecutive referendums, evolve almost perfectly parallel in the period prior to the availability of postal voting. Even when going further back in time, the two time series still follow the same pattern. This is reflected in the pre-treatment difference-in-differences. As Figure 1 shows, these placebo effects are very close to zero throughout the pre-treatment period. The stability observable in this placebo test means that turnout in treated and control units evolved similarly even when assessing up to five pre-treatment periods which is equivalent to about seven years before the introduction of postal voting. This adds to the plausibility of the assumption that in the absence of postal voting, turnout would have followed the trend observable in the control cantons that did not offer postal voting. We also re-estimate the placebo effects in a linear regression model that includes canton and year fixed effects. These results are reported in Appendix Table A.2 and again suggest that the placebo effects were zero and, if anything, slightly negative prior to the electoral reform. We conclude that assuming parallel trends seems plausible in our application.
Average turnout in referendums by postal voting before and after the introduction of postal voting, 1981–2009 (canton-level referendum data). Note: Dots indicate average turnout in five consecutive referendums (with 95 percent confidence intervals) for the pre-treatment and treatment period in cantons with postal voting versus cantons without postal voting. The figure also shows the effect of postal voting (difference-in-differences) in percentage points with 95 percent confidence intervals. Event time = 0 is the period in which postal voting became effective.

Estimating the mobilization effect
We now estimate the mobilization effect of postal voting using our survey data. One concern with this analysis could be that individuals will over-report turnout in the post-referendum survey. At the same time, over-reporting would be unlikely to affect our results if the level of over-reporting was constant over time. We explore whether this is the case by plotting reported and observed turnout in referendums. Figure A.1 in the Appendix shows the results. We find that, although there exists considerable variation in both reported and observed turnout, the two series move nearly perfectly in parallel which means that their difference is almost time-invariant. Second, over-reporting would not be a cause for concern if it was equally prevalent in both treatment and control groups as comparing those two groups would then remain valid. To test this assumption we regress the difference in reported and observed turnout on the postal voting treatment indicator. The coefficient on the postal voting variable is statistically insignificant which means that we cannot reject the null hypothesis of the difference in reported and observed turnout in the treatment group being the same as in the control group. This adds confidence in the validity of our research design. In addition, Cassel (Reference Cassel2003) documents that in the context of purely correlational studies, over-reporting only affects results related to a small set of turnout predictors such as marital status and occupation, none of which are of interest in our study. Finally, we note that the post-referendum polls were not about postal voting, which means that individuals were unlikely to be primed to answer the survey questions from the perspective of that institutional change.
We first estimate the average mobilization effect of postal voting by regressing canton-level turnout on our postal voting treatment indicator and include a full set of canton fixed effects. As can be seen from Model 1 in Table A.3, turnout in referendums increases by 4 percentage points on average. The effect is quite precisely estimated and remains unchanged when we add socio-demographic controls and year fixed effects (see the Appendix for a detailed description of all variables). The results remain virtually identical when estimated using individual-level data (see Appendix Table A.4).
This mobilization effect is equivalent to about 225,000 additional voters per referendum and consistent with previous estimates (Luechinger et al., Reference Luechinger, Rosinger and Stutzer2007; Hodler et al., Reference Hodler, Luechinger and Stutzer2015). The turnout increase seems also sizeable when benchmarked against results reported in get-out-the-vote studies. For example, Brady and McNulty (Reference Brady and McNulty2011) conclude “that changing polling places in Los Angeles County reduced turnout by a substantial 1.85% among those who had their polling places changed” (p. 128).
Decomposing the mobilization effect of postal voting
How does postal voting affect the turnout probabilities of different voter groups? To answer this question we first partition our individual-level data into theoretically meaningful political and sociodemographic subsets. Second, for each of these subsets we estimate the effect of postal voting on an individual's turnout decision using a probit regression in which we model turnout as a function of the postal voting treatment indicator. We also add a full set of canton and referendum-day fixed effects. This group-specific approach in which we estimate the correlation between postal voting and turnout for a specific group is preferable over a multiple regression model that would simultaneously control for all other sociodemographic and political characteristics. This is because our goal is to assess how postal voting mobilizes along a specific dimension while allowing for the possibility that it also affects the composition of turnout along one or several other dimensions. In contrast, a multiple regression model that includes other individual-level covariates as “controls” would answer a different question, i.e., how strongly postal voting would affect the turnout probability of individuals with a specific characteristic (e.g., high income) assuming all other characteristics remain constant. We want to avoid this ceteris paribus condition since changes in electoral institutions can affect the composition of turnout along several dimensions simultaneously which means that all other characteristics are not constant.
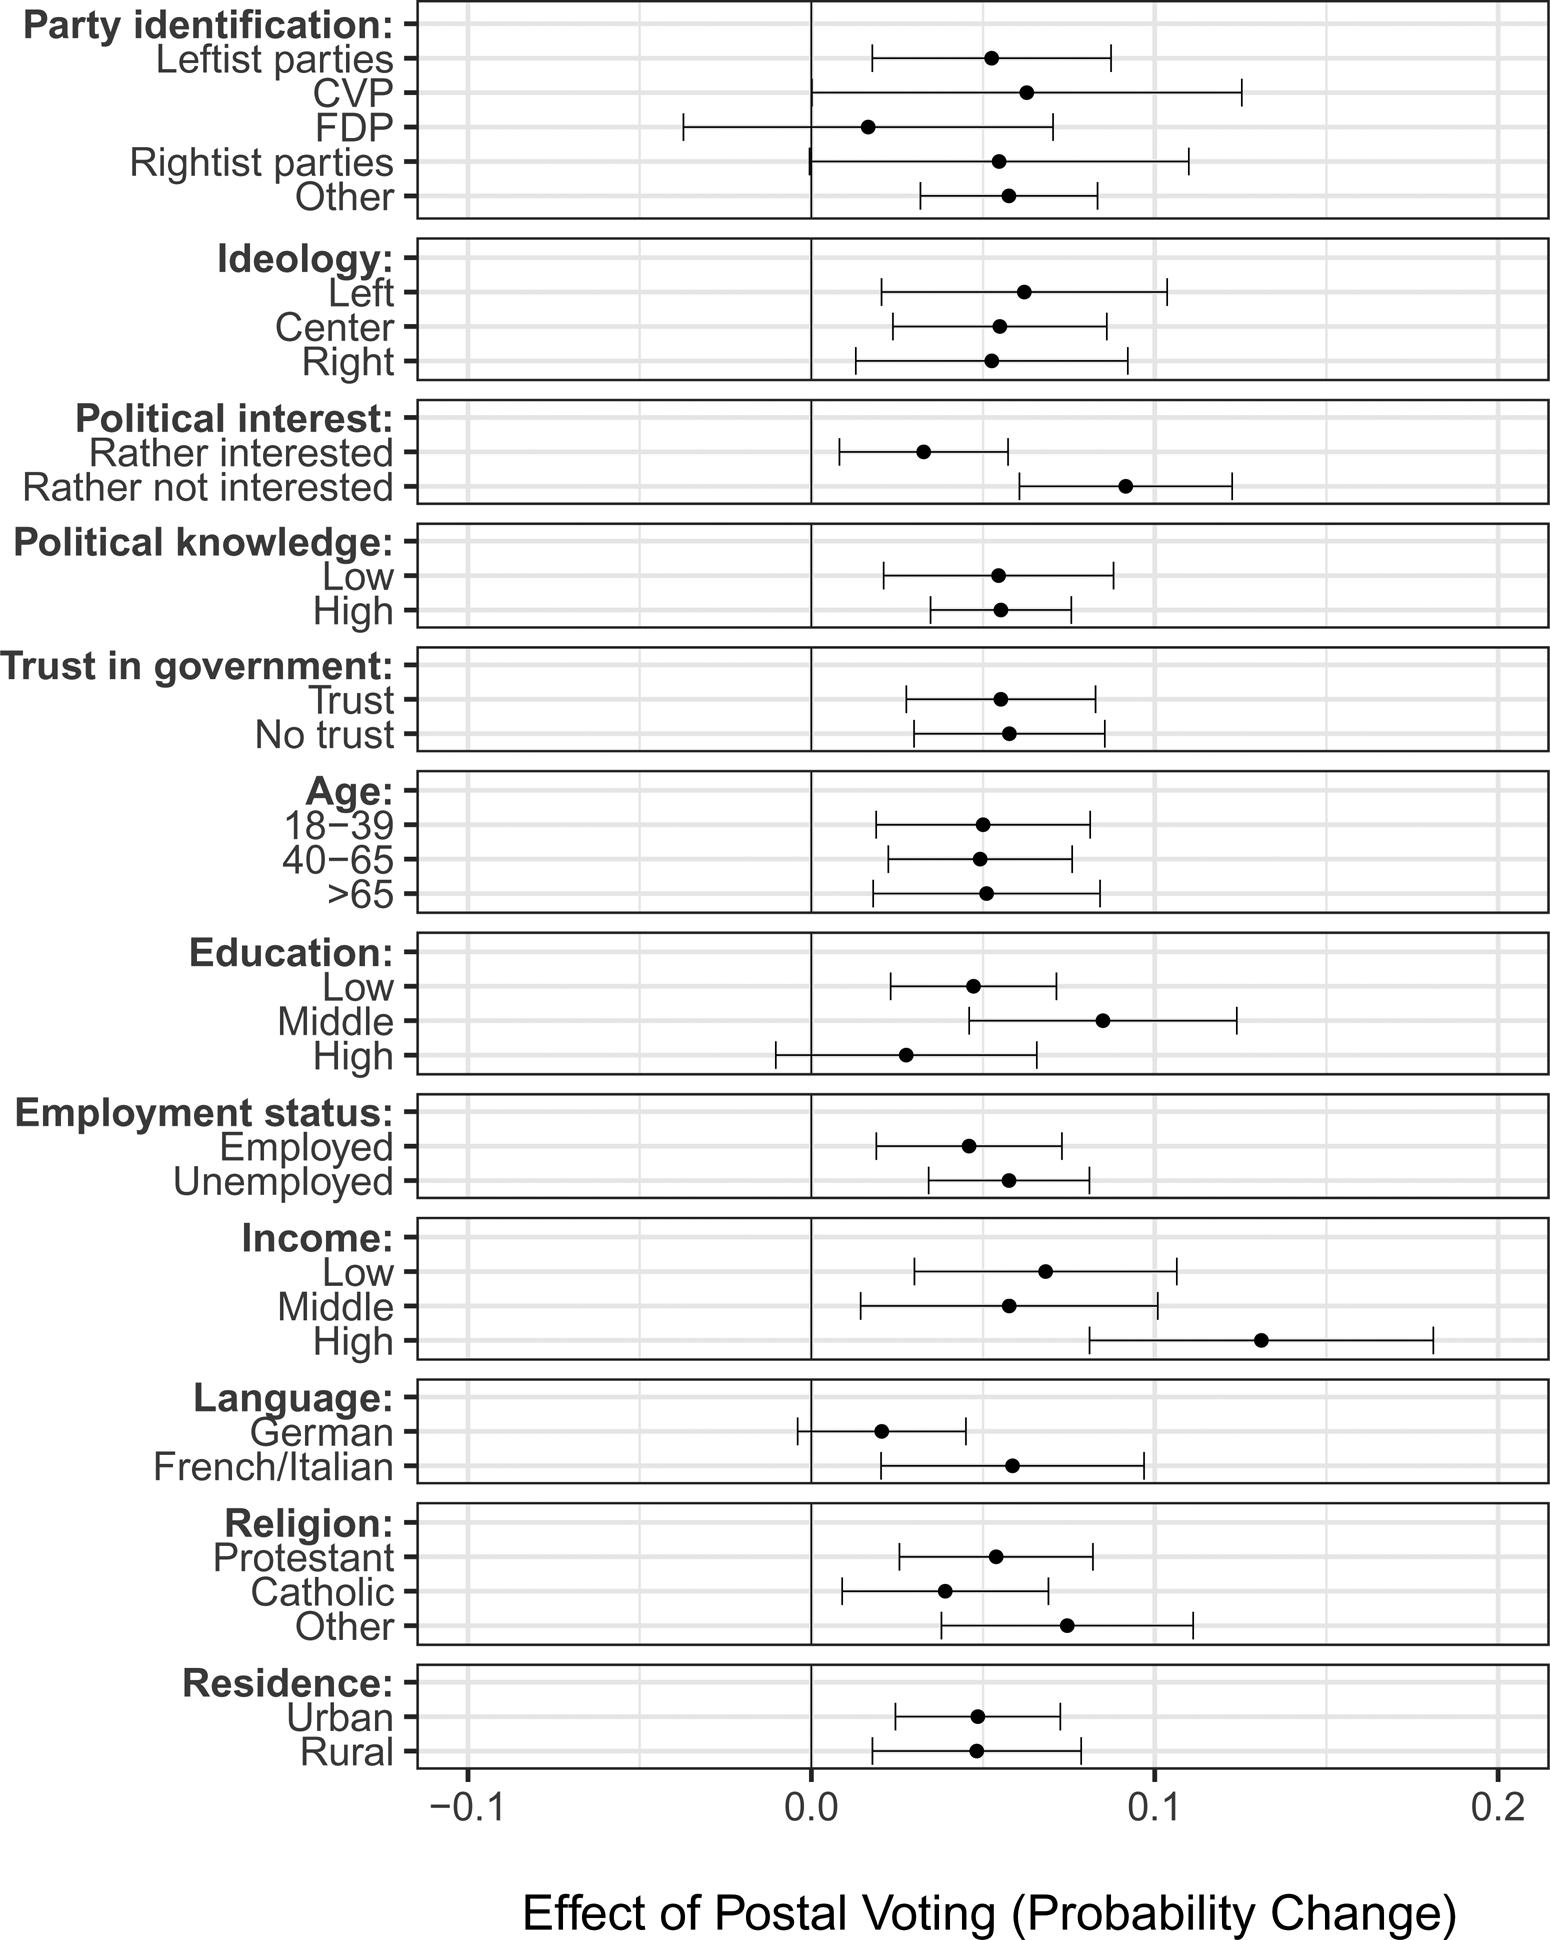
Figure 2 reports the results from these estimations. The confidence intervals allow us to gauge whether postal voting significantly mobilizes a specific subgroup. We find that postal voting significantly mobilizes individuals who identify with leftist parties. On average, these voters have a 5 percentage points higher turnout probability under postal voting. We estimate roughly similar effects for individuals who feel attached to the centrist CVP and rightist parties. In contrast, the availability of voting-by-mail does not systematically increase turnout among those who identify with the FDP. The results from additional analyses suggest that these partisan-specific mobilization effects do not significantly differ from each other. When examining the impact of postal voting on the ideological composition of turnout, we find a significantly positive and almost uniform impact on different ideology groups. On average, individuals placing themselves on the left of the ideological spectrum have a 6 percentage points higher probability of voting and this effect remains virtually identical when considering individuals in the center and on the right. Consistent with the visual impression, additional tests confirm that these mobilization effects do not vary systematically across ideological camps.
The effects of postal voting on the probability of turnout in referendums (individual-level data). Note: The dots indicate how the introduction of postal voting affects the probability of turnout together with 95 percent confidence interval (horizontal error bars). Estimates are based on probit regressions of an individual's turnout decision on a dummy variable that indicates the availability of postal voting and a full set of canton and referendum-day fixed effects. Each estimation is carried out separately for each of the sociodemographic and political subgroups. Standard errors are clustered by referendum day. Leftist parties include Social Democratic Party, Greens, Progressive Organizations of Switzerland, “Frauen macht Politik,” and Alliance de Gauche. Rightist parties include Swiss People's Party, Freedom Party, Ticino League, and Swiss Democrats. The sample sizes vary between 670 and 6,042 respondents per referendum day. Total ${\rm N} = 79,\; 041$ respondents who considered 239 ballot propositions on 81 referendum days in the period 1981–2009.

Does postal voting mobilize citizens who tend to have little interest in politics and are poorly informed about the issues at stake? Figure 2 shows that we estimate a small but significant effect of about 3 percentage points for the politically interested. For the politically disinterested we find a significant effect of about 8 percentage points. This latter estimate is significantly greater than the turnout increase we observe among those interested in political matters which supports the conjecture that postal voting more strongly mobilizes individuals with low levels of political interest. However, this does not imply that the citizens mobilized by postal voting are also less politically knowledgeable: we follow (Hodler et al., Reference Hodler, Luechinger and Stutzer2015, p. 155) and measure objective political knowledge using two quiz items. The first question asks respondents to name the title of each ballot measure. The second question asks respondents to roughly describe the content of each ballot proposition. We code respondents as knowledgeable if they answer both questions correctly. We find an almost identical effect of about 5 percentage points for both more and less knowledgeable individuals. In terms of formal education we find that postal voting significantly increases citizens with low (5 percentage points) and medium levels of education (8 percentage points). Additional tests indicate that the latter estimate is significantly different from the effect we estimate for the highly educated.
Next we evaluate how postal voting affects the propensity to vote by levels of income. The results suggest that postal voting significantly increases political participation among all income groups, although the effect sizes differ. Turnout under postal voting increases by 7 percentage points among low earners and 5 percentage points among individuals with medium incomes. For high earners, however, this effect more than doubles (13 percentage points) and this estimate is also significantly different from those for the two lower income groups.Footnote 8 This suggests that, although postal voting systematically increases civic engagement among all income groups, it has the most pronounced impact on those with high incomes.
The finding that postal voting mobilizes both less interested individuals and high earners may seem counterintuitive because one would expect these two groups to be almost mutually exclusive. The joint distribution of these groups, however, does not support this assumption. Although the two variables correlate, we find that even in the highest income category about 26 percent describe themselves as not being very interested in politics while for those in the lowest income category this figure is 41 percent.
Finally, we find significant, but uniform mobilization effects when exploring the impact of postal voting on the turnout composition in terms of trust in government (6 percentage points), age (5 percentage points), employment status (4 to 6 percentage points), religious denomination (4 to 7 percentage points), and place of residence (5 percentage points). Postal voting also increases turnout among citizens from French- and Italian-speaking regions (6 percentage points). This effect is not statistically distinguishable from the turnout increase we estimate for German-speaking respondents.
Mapping the composition of turnout
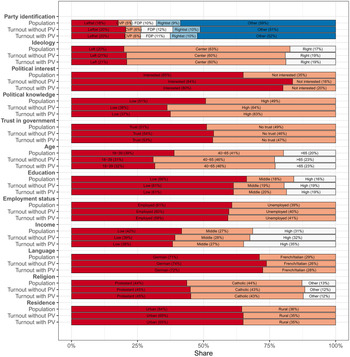
The results above provide information about the group-specific mobilization effects of postal voting. However, we still have to compute and map the resulting composition of turnout in terms of each subgroup's share with and without postal voting. This information is also needed to assess whether electoral institutions such as postal voting increase or decrease representational inequality. We implement this comparison by using the estimates from our main models and computing predicted levels of turnout for each subgroup as described above. For illustrative purposes, consider the composition of turnout by political interest. The data suggests that 35 percent of those who vote report are not particularly interested in politics while 65 percent of all voters indicate to be politically interested. Our estimates indicate that turnout among politically disinterested citizens increases from 26 to 35 percent. For individuals interested in politics turnout increases from 73 to 76 percent. This means that the share of low interest individuals in the composition of turnout without postal voting is $( 0.35\times 0.26) /( 0.35\times 0.26 + 0.65\times 0.73) = 0.16$ . In contrast, the share of low interest voters with postal voting is $( 0.35\times 0.35) /( 0.65\times 0.76 + 0.35\times 0.35) = 0.20$
 . We compute the corresponding quantities for all subgroups analogously and report them in Figure 3 along with the voting-eligible population as a benchmark.
The composition of turnout with and without postal voting (individual-level data). Note: This plot shows the shares of political and sociodemographic subgroups in the population and in the composition of turnout without postal voting and with postal voting and in voting-eligible population. Turnout composition estimates are based on each group's size and the group-specific effects reported in Figure 2. CVP, Christian Democratic People's Party; FDP, Free Democratic Party.

How does postal voting affect the make-up of turnout in terms of its ideological and partisan composition? Despite the significant and sizable increase in aggregate-level turnout, we find that postal voting leaves the shares of different partisan identifiers almost unaffected. For example, in the voting-eligible population, individuals identifying with leftist parties account for 18 percent of all partisans. When examining the partisan composition of turnout, we find that 20 percent support leftist parties without postal voting and this quantity remains unchanged under postal voting. We also find small or no effects for voters who identify with one of the other parties. Our results on the ideological composition of turnout are consistent with these patterns. Our estimates suggest that the population of eligible voters comprises about 20 percent leftist individuals, 63 percent place themselves in the center of the ideological left-right dimension, and 17 percent are located on the right. Turnout with and without postal voting quite closely mirrors this distribution. Thus, the availability of voting by mail leaves the ideological composition of turnout virtually unchanged.
Higher turnout could particularly mobilize voters with low levels of political interest and knowledge. Our results suggest that–as shown in the computation above–postal voting decreases the share of voters who are interested in political issues from 84 percent to about 80 percent. Yet the share of politically knowledgeable voters stays virtually unchanged after the introduction of postal voting and continues to remain substantially higher than in the voting-eligible benchmark population (51 percent). This suggests that higher turnout does not necessarily imply that those who vote will be less politically knowledgeable. Instead, the finding is consistent with a theory of civic engagement in which citizens who are mobilized to participate politically become more informed about the issues at stake.
The policy consequences of postal voting
A central question in the study of electoral reforms is whether institutional change actually has policy consequences (Fowler, Reference Fowler2013). This question is important even if each of the shifts in the sociodemographic and ideological composition of turnout appear modest because a combination of the effects we have identified could still add up to notable changes in electoral support for specific political agendas. To explore the policy consequences of postal voting we simulate the outcomes of close referendums with and without postal voting. We first use a probit regression to model whether an individual supported a ballot measure as a function of a theoretically relevant set of political (ideological orientation, party identification, trust in government, political interest) and sociodemographic (age, education, employment, gender, religious denomination, place of residence, and language) variables. We perform this estimation separately for each of the 239 referendums and keep the set of predictors the same in all estimations. We then compute the number of coefficients that are significant at the 10 percent level as a share of the total (239) estimated coefficients. The appendix describes our approach in detail and Figure A.2 reports the results. We find that variables such as party identification, ideology, and trust in government tend to be significant predictors of vote choice in referendums. We use this information about the correlates of vote choice to predict the level of support for each ballot measure without postal voting by multiplying each constituent's share in the composition of turnout with the corresponding coefficient from the estimated vote choice equation. Second, we predict the level of support under postal voting analogously but now factor in changes in the composition of turnout. We focus on ballot measures that have been accepted or rejected within an 8 percentage points margin. It seems unlikely that the effects we document could be decisive for any ballot measures that received much higher or much lower levels of electoral support. This leaves us with 22 ballot measures for which we simulate the share of yes votes with and without postal voting.Footnote 9
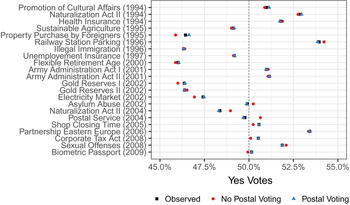
Figure 4 reports the results along with the observed yes share for each ballot proposition. While we believe these point predictions to be interesting and informative, we note that they are associated with various types of uncertainty that remain difficult to quantify because the results rely on two different sets of estimated parameters and also rest on assumptions about the intertemporal and cross-sectional stability of our estimates.
The policy consequences of postal voting in close referendums (individual-level data). Note: This plot shows the observed and predicted yes shares with and without postal voting for the 22 closest out of 239 ballot propositions ($50 +\!\! /\!\!-4$ percentage points). The dashed vertical line indicates the 50 percent threshold. The predicted yes shares are based on probit models of an individual's vote choice (see text for details). Total ${\rm N} = 79, 041$
 respondents who considered 239 ballot propositions on 81 referendum days in the period 1981–2009.

We find that most referendum outcomes remain unaffected by the introduction of postal voting. In other words, in most close referendums the introduction of postal voting does not turn a rejected ballot measure into one that receives majority support, or alternatively, transforms a winning proposition into one that would be rejected. However, for some extremely conflictual ballot propositions, postal voting may have been pivotal. In 2002, the anti-immigrant initiative “Against Asylum Abuse” launched by the right-wing Swiss People's Party barely missed majority support (49.9 percent). By that time virtually all cantons had introduced postal voting. Without postal voting, this proposition would likely have passed (50.2 percent). The availability of voting by mail may also have been decisive in the case of the postal service initiative which demanded a denser net of post offices (2004). Under postal voting the initiative received 49.8 percent yes votes while we predict that without postal voting support would have reached 50.6 percent. A third ballot measure for which the changes in the composition of turnout due to postal voting would probably have been consequential is the referendum on the introduction of biometric passports in 2009. In total, 50.1 percent of voters supported the proposition. Without postal voting, however, the referendum may have been rejected. Overall, postal voting appears to have potentially been consequential for three out of 22 close referendums (out of 239 ballot propositions in total). It seems unlikely it had an impact on other referendums whose outcomes were less close.
Conclusion
Voting is a costly activity and these costs are felt differently across groups that hold different policy preferences and vary in their ability to make political choices. Given these asymmetries the implementation of electoral reforms that decrease the costs of voting should be informed by how they affect representational inequality. We address this question by innovating a research design that allows scholarship to assess how an electoral reform affects the multidimensional composition and representativeness of turnout. We apply this approach to study whether the introduction of postal voting improves or worsens the representativeness of turnout in direct legislation. By exploiting the sequential introduction of postal voting in Switzerland and analyzing large amounts of individual-level data we break down the overall turnout increase due to postal voting into its political and sociodemographic components.
We find that postal voting increases overall turnout by 5 percentage points on average, a magnitude that appears sizeable if compared to the effects of much more invasive get-out-the-vote measures (Gerber et al., Reference Gerber, Green and Larimer2008). When exploring potential heterogeneity in this effect we find significant and largely uniform increases across a large set of political and sociodemographic groups. At the same time, postal voting more strongly activates citizens who are less interested in politics, high earners, and individuals with low and medium levels of education.
To evaluate the impact of postal voting on the representativeness of turnout, we map in detail the share of different voter groups without and with postal voting and benchmark this information against the voting-eligible population. The results indicate that the consequences of postal voting on representational inequality are limited. Moreover, when we simulate the effects of postal voting on the outcomes of direct-democratic choice, we find that postal voting has negligible effects on actual referendum outcomes. These findings seem consistent with previous evidence for the United States (Highton and Wolfinger, Reference Highton and Wolfinger2001; Citrin et al., Reference Citrin, Schickler and Sides2003; Martinez and Gill, Reference Martinez and Gill2005) and Canada (Rubenson et al., Reference Rubenson2007). At the same time, these previous contributions have attempted to simulate how electoral outcomes are affected by universal turnout which is an extreme counterfactual that has not been observed in these contexts. In contrast, we simulate the effect of a much smaller, but observable turnout increase due to postal voting using estimates from a causal inference framework.
Our results offer implications for policymakers and suggest avenues for future research. First, they lessen existing concerns about how making voting more convenient may affect the quality of direct-democratic choice since we document that postal voting has largely uniform effects on turnout across a large set of constituencies. Consequently, policymakers interested in increasing civic engagement across sociodemographic, religious, and language groups may find postal voting a particularly attractive instrument. Second, we have examined the effect of a specific electoral institution that decreases the costs of voting on the multidimensional composition of turnout and the cumulative evidence begins to suggest a notable degree of heterogeneity in how individuals respond to electoral reforms. These effects may depend on institutional design features such as their specificity (e.g., poll taxes that disproportionately hurt the poor) and seem conditional on whether they alter the costs of voting (e.g., relocation of polling places, literacy tests) or the costs of non-voting (e.g., fining or socially shaming non-voters). Third, we believe that subsequent research can employ our approach to generate meaningful estimates of how reforms affect the multidimensional composition of turnout in both elections and referendums.
Finally, given the large set of electoral reforms available to policymakers, future work may begin to explore how the implementation of a sequence of reforms affects electoral behavior. For example, even if the impact of a single reduction in the costs of voting remains modest, the combination of several institutional changes over time could ultimately have noteworthy effects on electoral outcomes. We believe that subsequent research would benefit from a systematic study of how the design and combination of electoral reforms affects the composition of turnout and, in turn, public policy.
Supplementary material
To view supplementary material for this article, please visit https://doi.org/10.1017/psrm.2020.20.
Acknowledgments
We acknowledge financial support from the Swiss National Science Foundation (Grant # IZSEZ0_186479/1) and the University of St. Gallen (GFF).