INTRODUCTION
The World Health Organization (WHO) defines genetically modified organisms (GMOs) as those organisms in which the genetic material has been altered in a way that does not occur naturally (WHO 2002). Soybean (Glycine max L.) is one of the most important oil- and protein-producing crops globally. Genetically modified (GM) soybean has made rapid strides in recent decades and the GM cultivation area is increasing year by year. Many agronomically important traits including improvement of herbicide and drought/salt stress tolerance (Konduru et al. Reference Konduru, Kruse, Kalaitzandonakes and Stacey2008; Seo et al. Reference Seo, Sohn, Noh, Jung, An, Donovan, Somers, Kim, Jeong, Kim, Kim, Lee, Choi, Moon, Kim and Cheong2012), enhancement of resistance to insects and diseases (McPherson & MacRae Reference McPherson and MacRae2009; Cunha et al. Reference Cunha, Tinoco, Pancoti, Ribeiro and Aragão2010), and improvement of quality and nutritional value (Ishimoto et al. Reference Ishimoto, Rahman, Hanafy, Khalafalla, El-Shemy, Nakamoto, Kita, Takanashi, Matsuda, Murano, Funabashi, Miyagawa and Wakasa2010; Kim et al. Reference Kim, Chronis, Juergens, Schroeder, Hyun, Jez and Krishnan2012) have been introduced into soybean by genetic modification. The Roundup Ready® (RR) soybean, which incorporates a gene from the bacteria Agrobacterium tumefaciens conferring resistance to the glyphosate-based Roundup® herbicide was the first RR crop to be introduced into markets in 1996. It rapidly displaced conventional soybeans because of advantages for crop management and yields. Of the global area of 90 million ha of soybean grown in 2010, an impressive 73·3 million ha were RR® soybean (James Reference James2010).
Despite the widely recognized benefits of GM organisms, not all global markets fully accept GM products for various reasons, such as the introduction of new allergens, weediness, transfer of antibiotic resistance genes in bacteria, modification of environmental biodiversity, etc. (Bakshi Reference Bakshi2003). Particularly in the case of crop-to-crop gene flow, as more transgenic cultivars become available, the contamination of conventional cultivars with transgenes and the unintended combination of transgenes through natural hybridization will become increasingly problematic.
Gene flow is a natural phenomenon and can occur via pollen, seed and vegetative propagules. Gene flow via pollen can occur in all crops, even those that are considered to be self-pollinated, because all have low levels of out-crossing. Gene flow via seed or vegetative propagules occurs when they are moved naturally or by humans during crop production and commercialization. There are many factors that influence gene flow; therefore, it is difficult to prevent or predict. Soybean is an annual, highly self-fertile, self-pollinating species. Pollination occurs either in the bud stage or before the flowers completely open. Soybean pollen is too heavy for wind transport; however, pollination by honey bees, thrips species and predatory Hemiptera has been shown to increase the possibility of out-crossing (Erickson Reference Erickson1975; Yoshimura et al. Reference Yoshimura, Matsuo and Yasuda2006). The cultivated soybean usually shows an out-crossing rate of <0·01 (Chiang & Kiang Reference Chiang and Kiang1987); however, the rate exceeds 0·025 in particular cultivars under favourable conditions (Ahrent & Caviness Reference Ahrent and Caviness1994). For instance, Yoshimura et al. (Reference Yoshimura, Matsuo and Yasuda2006) evaluated the natural out-crossing rates for conventional soybeans cultivated adjacent to GM glyphosate-tolerant soybeans under field conditions during a 4-year period in Japan: they observed that a total of 107 846 progeny of 2772 plants harvested from conventional varieties had improved glyphosate herbicide tolerance. Consequently, out-crossing with adjacent GM crops would definitely affect the seed purity of a non-GM crop variety, and probably affect international trade of non-GM crops and influence local markets if the crops are destined for GM-free or ‘organic’ products (Rong et al. Reference Rong, Song, Su, Xia, Lu and Wang2005).
Many countries have set regulations for the identification, quantification and appropriate labelling of products containing GM organisms. To monitor and identify the presence and amount of GM organisms in agricultural crops and in the products derived from them, a rapid, accurate and inexpensive method for GM detection is urgently required. Up to now, multiple approaches such as polymerase chain reaction (PCR) (Abdullah et al. Reference Abdullah, Radu, Hassan and Hashim2006; Dörries et al. Reference Dörries, Remus, Grönewald, Grönewald and Berghof-Jäger2010), enzyme-linked immunosorbent assay (ELISA) (Liu et al. Reference Liu, Su, Xu, Long, Zhou and Song2004), microarrays (Wang Reference Wang2000), electrophoresis (Obeid et al. Reference Obeid, Christopoulos and Ionnou2004), mass spectrometry (Ocaña et al. Reference Ocaña, Fraser, Patel, Halket and Bramley2007) and chromatographic protein profiles (García et al. Reference García, García, García-Ruiz, Gómez, Cifuentes and Marina2009) have been developed to analyse and/or detect the presence of GM organisms in food products. However, most of these laboratory-based analysis methods are destructive, time-consuming, expensive and impossible for rapid on-site measurements. Moreover, because only a few seeds can be taken per analysis, the accuracy of the method becomes dependent on the sampling procedure. The distribution of GM seeds in a conventional batch of any grain can create a sampling error of up to 20% (Hübner et al. Reference Hübner, Waiblinger, Pietsch and Brodmann2001).
Multispectral imaging is an emerging technology integrating both the conventional imaging and spectroscopy techniques, which obtains both spatial and spectral information from the target objects simultaneously. This method is non-destructive, simple, rapid and requires no sample pre-treatments, making it more suitable for on-line process monitoring and quality control (Dissing Reference Dissing2011; Feng & Sun Reference Feng and Sun2012). Recently, this technique has been employed to evaluate food safety and quality including detection of contaminants (Park et al. Reference Park, Lawrence, Windham and Smith2004), spoilage identification (Christiansen et al. Reference Christiansen, Carstensen, Papadopoulou, Chorianopoulos, Panagou, Nychas, Cummins, Frías and Valdramidis2011; Dissing et al. Reference Dissing, Papadopoulou, Tassou, Ersbøll, Carstensen, Panagou and Nychas2013), constituent analysis (Lleó et al. Reference Lleó, Barreiro, Ruiz-Altisent and Herrero2009; Dissing et al. Reference Dissing, Nielsen, Ersbøll and Frosch2011) and also quality evaluation (Gøtterup et al. Reference Gøtterup, Olsen, Knøchel, Tjener, Stahnke and Møller2008; Daugaarda et al. Reference Daugaarda, Adler-Nissen and Carstensen2010; Christiansen et al. Reference Christiansen, Carstensen, Møller and Nielsen2012; Rød et al. Reference Rød, Hansen, Leipold and Knøchel2012; Løkke et al. Reference Løkke, Seefeldt, Skov and Edelenbos2013; Liu et al. Reference Liu, Liu, Lu, Ma, Chen, Yang and Zheng2014). In addition, multispectral imaging was originally applied to detection of soybean rust and differentiation of soybean and weed species (Gray et al. Reference Gray, Shaw, Gerard and Bruce2008; Cui et al. Reference Cui, Zhang, Li, Hartman and Zhao2010). However, there is no research reported about the application of multispectral imaging technique for rapid and high-throughput detection of transgenic soybean seeds. Moreover, chemometric methods are suitable for classifying the mass data set from transgenic and non-transgenic samples, such as visual assessment of the score plot and loading plot provided by principal component analysis (PCA) and partial least squares discrimination analysis (PLSDA) as well as least-squares support vector machines (LS-SVM) and back propagation neural network (BPNN), respectively. These profiling approaches have been proved to be effective in identifying and distinguishing the differences and similarities between the main compositions of transgenic and non-transgenic plants (Xie et al. Reference Xie, Ying and Ying2009; Jiao et al. Reference Jiao, Si, Li, Zhang and Xu2010; Lee & Choung Reference Lee and Choung2011).
The objective of the present study focused on applying a multispectral imaging technique for rapid and high throughput discrimination of conventional and glyphosate-resistant (Roundup Ready®) soybean seeds and their hybrid descendants. The specific goals include: (1) studying the feasibility of multispectral imaging technique to distinguish conventional and glyphosate-resistant soybean seeds and their hybrid descendants, (2) comparing the discrimination performance of different chemometric methods, including PLSDA, LS-SVM and BPNN models to classify the conventional and glyphosate-resistant soybean seeds and their hybrid descendants.
MATERIALS AND METHODS
Soybean seeds samples
Conventional soybean seeds (Wandou 28), glyphosate-resistant GM soybean seeds (Roundup Ready® soybean DP4546RR, Monsanto Canada Inc.), and their hybrid descendants (DP4546RR × Wandou 28) were provided by the Institute of Rice Research, Anhui Academy of Agricultural Sciences, Hefei, China. The samples were stored in sealed plastic bags at 4 °C until use.
Spectra collection and pre-treatment
Intact samples of 200 conventional (Wandou 28) and 200 glyphosate-resistant (DP4546RR) soybean seeds and 200 their hybrid descendants (DP4546RR × Wandou 28) were analysed by a multispectral imaging system, respectively. The multispectral imaging analysis was performed using the VideometerLab equipment (Videometer A/S, Hørsholm, Denmark) which acquired the multispectral images at 19 different wavelengths from the visual region to the lower wavelengths of the NIR region and the detailed information of the measured wavelength were 405, 435, 450, 470, 505, 525, 570, 590, 630, 645, 660, 700, 780, 850, 870, 890, 910, 940 and 970 nm. A schematic illustration of the whole setup is shown in Fig. 1. The acquisition system recorded the surface reflections with a standard monochrome charge coupled device chip nested in a Point Grey Scorpion camera (Point Grey Research GmbH, Ludwigsburg, Germany). The object of interest is placed inside the integrating sphere with a matt white coating to ensure that the light is scattered evenly with a uniform and diffuse light (Ljungqvist et al. Reference Ljungqvist, Frosch, Nielsen and Ersbøll2013). At the rim of the sphere, light-emitting diodes (LEDs) are positioned side by side, distributing the LEDs of each wavelength evenly across the whole perimeter to avoid shadows and specular reflections. Firstly, the system was calibrated radiometrically using both a diffuse white and a dark target. Following this, the light system could be modified based on the type of object to be recorded. The system was geometrically calibrated with a geometric target to ensure pixel correspondence for all spectral bands. Each multispectral image consisted of 19 separate images, which were recorded at 19 different wavelengths. It should be noted that, in image analysis, to segment the mass images into distinct regions is an important and difficult pre-processing step. Image segmentation was performed using the VideometerLab software version 2.12.23. To remove the image background, all items except the soybean seeds were removed by canonical discriminant analysis (CDA) (Cruz-Castillo et al. Reference Cruz-Castillo, Ganeshanandam, MacKay, Lawes, Lawoko and Woolley1994) and segmented using a simple threshold. Morphological features, including area (mm2), length (mm), width (mm), roundness, hunter L*, a*, b* values of soybean seed were all extracted from the image analysis and processing.
Principal setup of the multispectral imaging system. (a) Illustration of the principle of imaging with an integrating sphere ensures uniform illumination. (b) The light emitting diodes (LEDs) located in the rim of the sphere ensures narrowband illumination (colour online) .

Chemometrics: multivariate analysis
In the present study, three classes (conventional and glyphosate-resistant soybean seeds, and their hybrid descendants) were defined. Multivariate analysis including PCA, PLSDA, LS-SVM and BPNN were used in the present study to classify and screen these three classes. All chemometric analyses and statistics were performed using the commercial software Matlab 2009 (Mathworks Inc., Natick, MA, USA), Origin 8·5 and Weka 3·7.
Principal component analysis
Principal component analysis is a common multivariate statistical modelling and analysis tool to obtain a parsimonious representation of multivariate data. In the present study, the dimensions of the data matrix from soybean seeds samples were reduced and the main information in the spectra and morphological features recorded was extracted to get an overview using PCA. The final results of PCA consisted of score plots to visualize the contrast among different samples and loading plots to detect and interpret sample patterns, groupings, similarities or differences.
Partial least squares discrimination analysis
Partial least squares discrimination analysis is a powerful mathematical approach considered for a large number of applications in qualitative and quantitative analysis. The core of the PLSDA approach is the use of partial least squares regression, which operates a bilinear decomposition of both the X-and Y-spaces, under the assumption that a relationship between the two internal spaces exists, to compute the model parameters. It employs the fundamental principle of PCA but further rotates the components (latent variables (LVs)) by maximizing the covariance so that the LVs explain the relevant variations. In most cases, this ensures that the significant variations are retained in the first few LVs. The leave-one-out cross-validation procedure was used during the calibration step. In the present study, each sample was assigned a dummy variable 1, 2 or 3 as a reference value, an arbitrary number indicating whether the sample belonged to a particular group or not. The spectral data from glyphosate-resistant soybean seeds were assigned a value of 1, those from conventional soybean seeds 2 and those of the hybrid soybean seeds 3. Therefore, the glyphosate-resistant sample would be classified correctly if the value was <1·5; otherwise the sample was treated as incorrect. The conventional sample would be classified correctly if the value was between 1·5 and 2·5, and their hybrid sample would be classified correctly if the value was >2·5.
Least squares-support vector machines
Least squares-support vector machine (LS-SVM) is a learning algorithm used for classification and regression tasks proposed by Cortes & Vapnik (Reference Cortes and Vapnik1995). It has been effectively used to perform multivariate function estimation or non-linear classification. Compared with other analysis methods, SVM can learn in high-dimensional characteristic space with fewer training variables or samples and details of the LS-SVM algorithm can be found in previous reported research (Devos et al. Reference Devos, Ruckebusch, Durand, Duponchel and Huvenne2009; Xie et al. Reference Xie, Ying and Ying2009). The LS-SVM model can be expressed as:
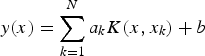 $$y(x) = \sum\limits_{k = 1}^N {a_k K(x,x_k ) + b}$$
where K(x, x k) is the kernel function, x k is the input vector, α k is the Lagrange multiplier called support value and b is the bias term.
The selection of kernel function and the optimum kernel parameters are crucial in LS-SVM. Normally, the attainment and efficiency of kernel function depend largely on individual cases. Therefore, the kernel function should be chosen and used carefully. Here, a radial basis function (RBF) with Gaussian function was used as the kernel function that handled non-linear relationships between the spectra and target attributes and was able to reduce the computational complexity of the training procedure, giving a good performance under the general smoothness assumptions. There are just two parameters (γ, σ 2) needed for LS-SVM. The regularization parameter γ determined the trade-off between minimizing the training error and model complexity. The parameter σ 2 was the bandwidth and implicitly defined the non-linear mapping from input space to some high dimensional feature space. The optimum value of the parameters that should be used for the model to produce a high accuracy was obtained using cross-validation by leave-one-out procedure during the calibration step.
Back propagation neural network
A BPNN is a type of non-linear neural network that can be adopted to solve a variety of classification and regression problems more accurately than linear techniques. Also, BPNN is one of classic feed-forward neural networks, and in the current paper the steepest gradient descent algorithm was used as the learning algorithm. A three-layer BPNN which included an input layer, a hidden layer and an output layer was introduced. The network consisted of m input nodes, l hidden nodes and n output nodes. The input, hidden, output and target output vectors were denoted by x, h, o and t, respectively; {v ij} denoted the weight between the hidden node i and the output node j and {w ij} denoted the weight between the input node i and the hidden node j. Depending on the actual and expected output vectors, energy function was defined as:
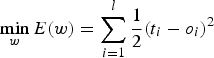 $$\mathop {\min} \limits_w E(w) = \sum\limits_{i = 1}^l {\displaystyle{1 \over 2}} (t_i - o_i )^2$$
The objective is to minimize the energy function. If the value between actual output and expected output is greater than the set threshold value, the weight matrix is updated by minus gradient as follows:
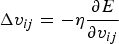 $$\Delta v_{ij} = - \eta \displaystyle{{\partial E} \over {\partial v_{ij}}}$$
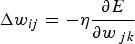 $$\Delta w_{ij} = - \eta \displaystyle{{\partial E} \over {\partial w{}_{\,jk}}}$$
Leave-one-out cross-validation procedure was used during the calibration step. Several network architectures were tested by varying the number of neurons in the hidden layer with different initial weights. The optimal parameters of the hidden nodes, the goal error and iteration times were determined by the least prediction error.
RESULTS
Spectroscopic analysis
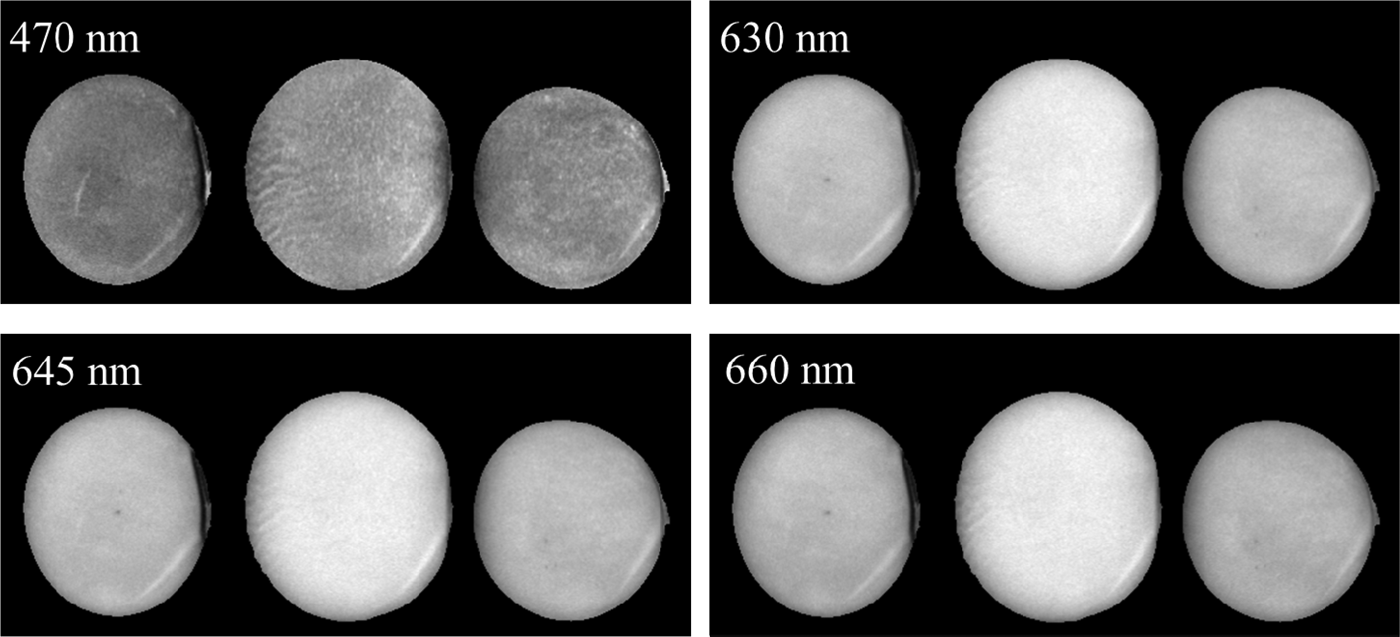
The spectra were collected over the range of 405–970 nm including the visible and the lower wavelengths of NIR region. Figure 2 shows the average spectra of 200 conventional (Wandou 28) and 200 glyphosate-resistant (DP4546RR) soybean seeds and 200 of their hybrid descendants (DP4546RR × Wandou 28) as the whole dataset. Clearly, the general trend of all spectra was very similar, except for some subtle alterations of the spectra, reflecting the differences between the hundreds of physical and chemical components in soybean seeds that were represented by the spectral bands and seed colour of the samples. It was mostly the surface of the soybean seeds measured by VideometerLab. The difference in the visible range was due to the colour feature of the samples over the entire visible colour spectral range. Furthermore, differences in the near infrared (NIR) region could be attributed to chemical differences among conventional and glyphosate-resistant soybean seeds and their hybrid descendants. Figure 3 shows the images of the most relevant wavelengths for discriminating conventional and glyphosate-resistant soybean seeds and their hybrid descendants. Since there are many components in soybean seeds, it is difficult to identify the spectral difference based on chemistry. In addition, the compositional differences were observed in both the visible and NIR ranges, which could be utilized for qualitative classification. This phenomenon could arise from a number of sources; therefore, the multivariate classification models were used.
Average spectra from the multispectral images of conventional (Wandou 28) and glyphosate-resistant (DP4546RR) soybean seeds and their hybrid descendants (DP4546RR × Wandou 28). Vertical bars represent standard deviations from two hundreds measurements (colour online) .
Images of the most relevant wavelengths for discriminating glyphosate-resistant (DP4546RR, left) and conventional (Wandou 28, middle) soybean seeds and their hybrid descendants (DP4546RR × Wandou 28, right).
The PCA was performed initially to examine the qualitative difference of conventional and glyphosate-resistant soybean seeds and their hybrid descendants in principal component (PC) space. All the spectra of 200 conventional and 200 glyphosate-resistant soybean seeds and 200 their hybrid descendants were used for PCA. Figure 4 shows the three-dimensional PC score plot using the first three score vectors, PC1, PC2 and PC3 were derived from the spectral data and the combined spectral and morphological features data of the samples. The initial three factors, which account for most of the spectral variations (97·37 and 94·29% for the spectral dataset and the combined spectral and morphological features dataset, respectively), were used to make differentiation clearer. It was found that the conventional and glyphosate-resistant soybean seeds were clearly separate from their hybrid descendants in the three-dimensional PCA space with the combined spectral and morphological features data. These results suggested that discrimination among conventional and glyphosate-resistant soybean seeds and their hybrid descendants was possible and that different spectral attributes of samples were associated with the characteristics of the samples. Furthermore, a feature weighting algorithm (ReliefF) was used to identify the dominant features. The results showed that the top five dominant features were hunter a* and b*, area, and the spectral bands at 660 and 470 nm. It is worth mentioning that both spectral bands and shape features were important in discrimination of conventional and glyphosate-resistant soybean seeds and their hybrid descendants.
Three dimensional score plot of the first three principal components for conventional (Wandou 28) and glyphosate-resistant (DP4546RR) soybean seeds and their hybrid descendants (DP4546RR × Wandou 28) with the spectral data set (a), and the combined spectral and morphological features data set (b). The classification was clear between the three groups of the DP4546RR (*), Wandou 28 (□) and DP4546RR × Wandou 28 soybean seeds (◇), indicating that the spectra among the three groups had quite different factors (colour online).
Classification analysis
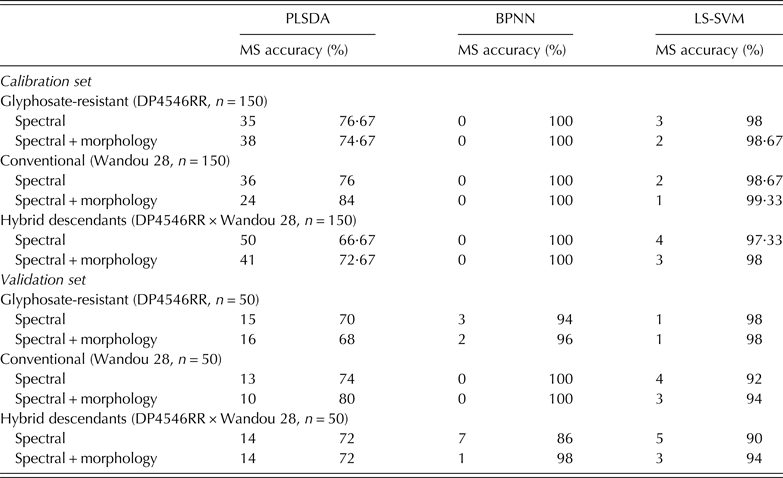
For PLSDA, the number of LVs was found to be eight, based on the minimum classification error. Figure 5 shows predictions of soybean seed types using the PLSDA model with spectral data (Fig. 5(a)), and the combined spectral and morphological features data (Fig. 5(b)) in a validation set. The results suggested that the PLSDA model combined with multispectral imaging obtained enough information for discrimination between conventional and glyphosate-resistant soybean seeds and their hybrid descendants’ samples. The discrimination results are listed in Table 1. The averages of predictive accuracies were 72 and 73·33% using the spectral data and the combined spectral and morphological features data, respectively. Although the discrimination performance could be improved using the combined spectral and morphological features data, the accuracy was too low to be used in the application.
Plot of actual v. calculated values of conventional (Wandou 28) and glyphosate-resistant (DP4546RR) soybean seeds and their hybrid descendants (DP4546RR × Wandou 28) using PLSDA model with the spectral data set (a), and the combined spectral and morphological features data set (b) in validation set. (*) DP4546RR soybean seeds; (□) Wandou 28 soybean seeds; (◇) DP4546RR × Wandou 28 soybean seeds (colour online).
Comparison of discrimination performance obtained with PLSDA, LS-SVM and BPNN methods with the spectral data and the combined spectral and morphological features data
PLSDA: partial least squares discriminant analysis; BPNN: back propagation neural network; LS-SVM: least squares-support vector machines; MS: misclassified samples.
In the BPNN method, by adjusting the optimal parameters of the hidden nodes many times, the goal error and iteration times were determined to be 20, 1 × 10⁻⁸ and 800, respectively. With these optimal parameters, the soybean seeds were well classified using the combined spectral and morphological features data. In the validation set, the misclassified numbers were 2, 0 and 1, and the respective accuracies were 96, 100 and 98% for glyphosate-resistant and conventional soybean seeds and their hybrid descendants.
In the stage of model development using LS-SVM with RBF kernel, the crucial step was the optimization of the meta-parameters γ and σ 2 because their values determined the boundary complexity and the prediction performance. The optimal combination of (γ, σ 2) for soybean seeds discrimination was found at the value of (4, 0·0625) on the spectral data set, and (2, 0·0625) on the combined spectral and morphological features data set, respectively. The discrimination results are also listed in Table 1. Similar to PLSDA and BPNN models, the LS-SVM model with the combined spectral and morphological features data produced better predictive accuracies than that with the spectral data. The predictive accuracies in the validation set were 98, 94 and 94% for glyphosate-resistant and conventional soybean seeds and their hybrid descendants with the combined spectral and morphological features data, respectively.
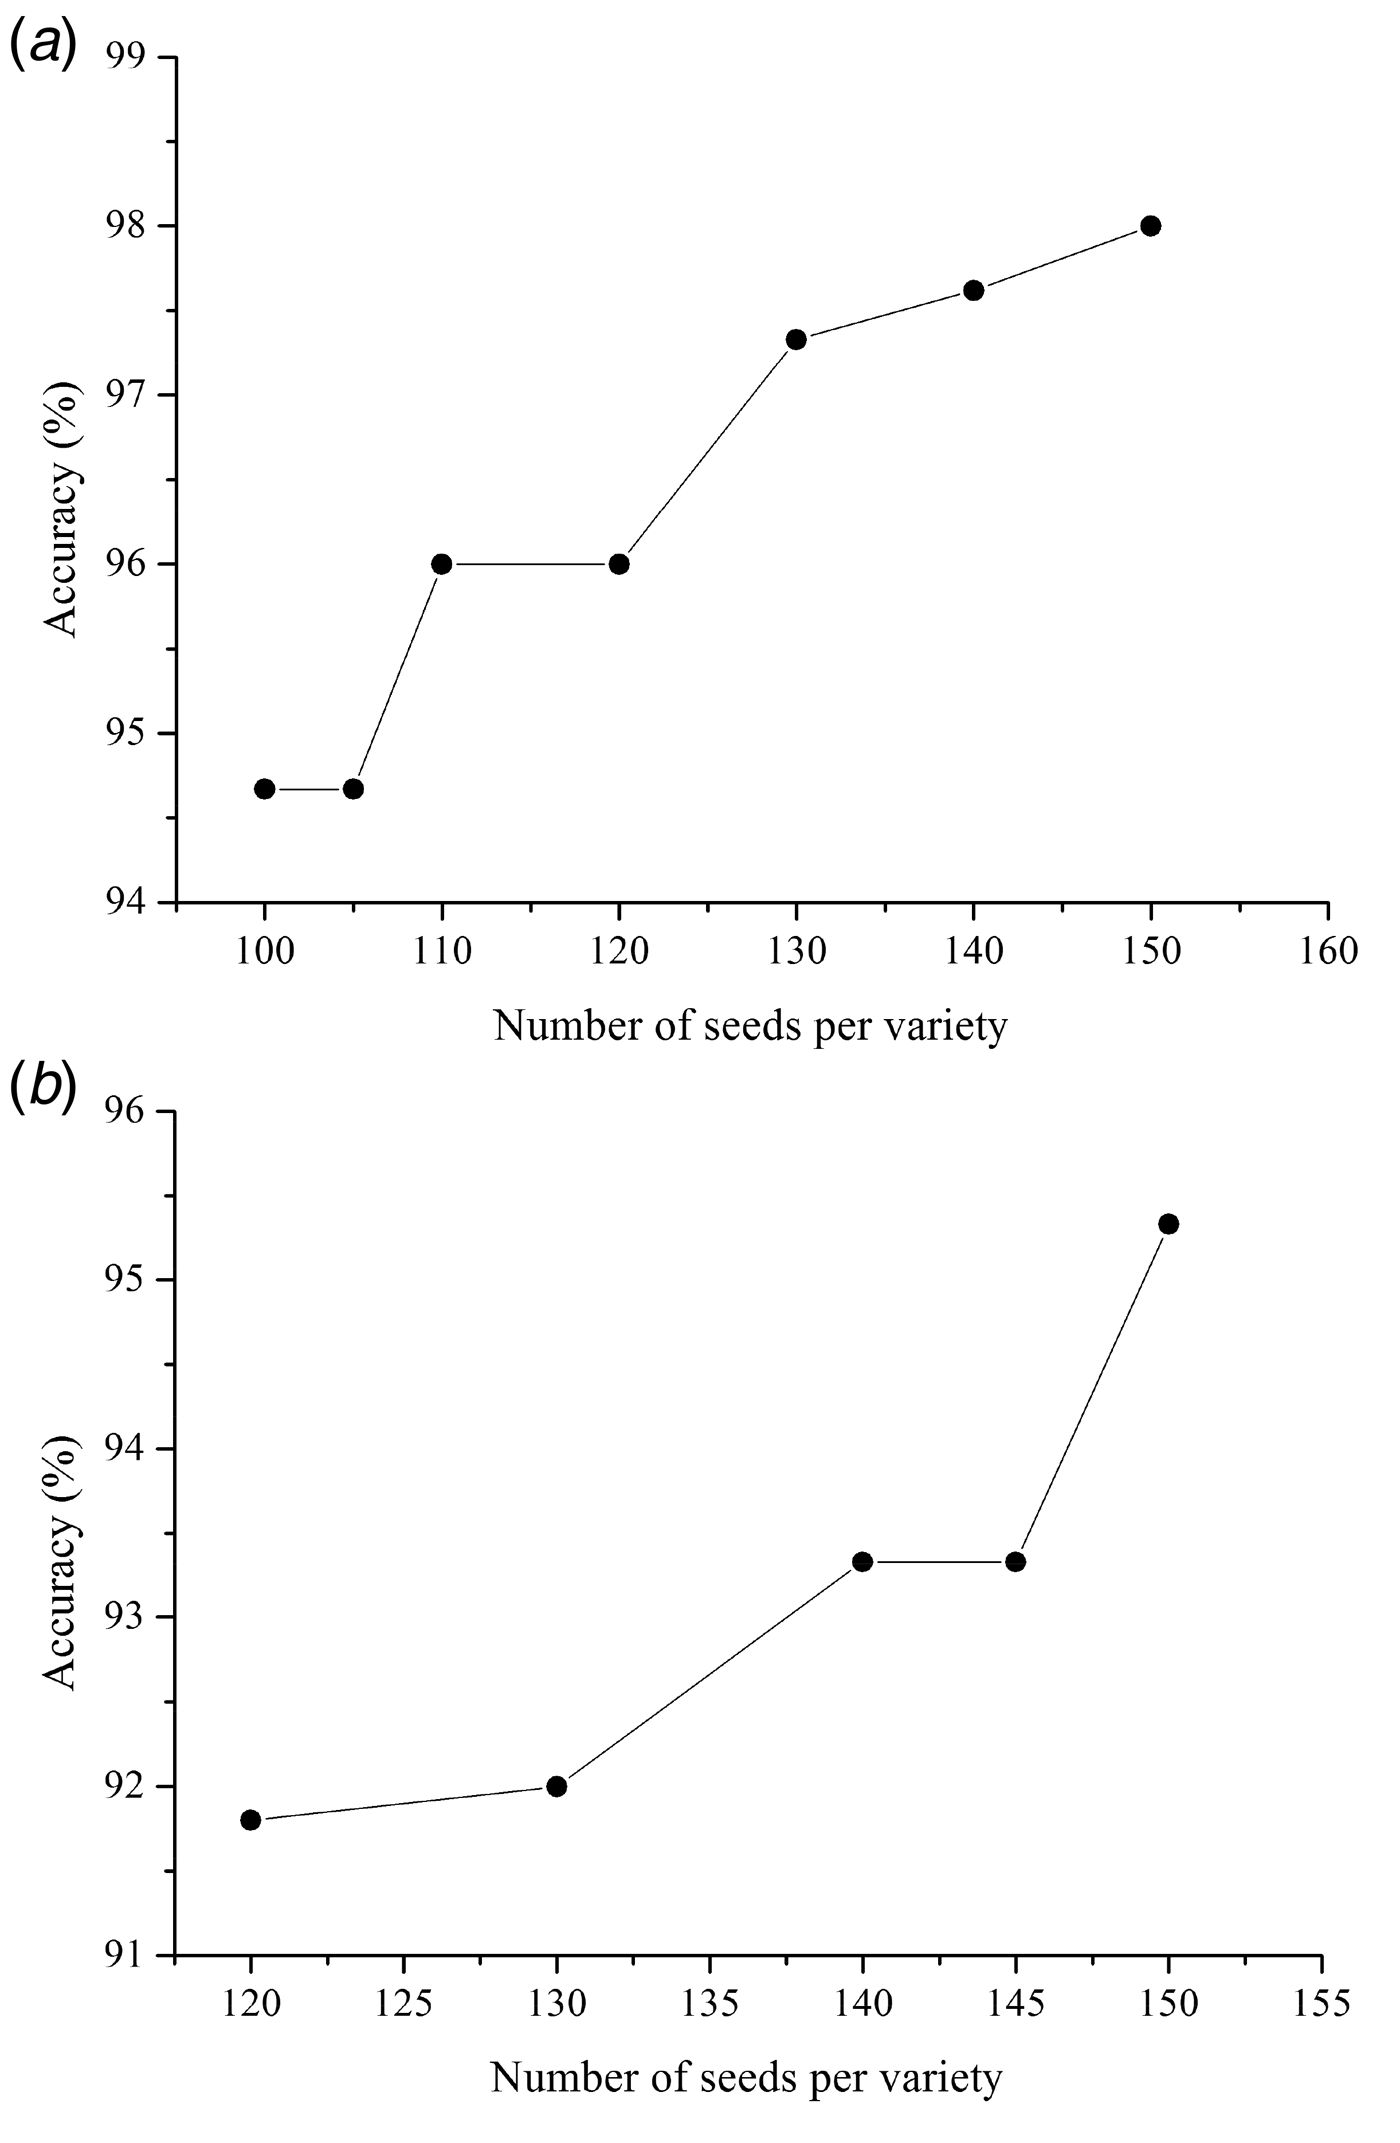
As seen from Table 1, the discrimination performances using different chemometric methods were also compared and the accuracy results obtained from the calibration set and validation set were summarized accordingly. Detailed comparison based on accuracies showed that BPNN was the best chemometric method for discrimination of conventional and glyphosate-resistant soybean seeds and their hybrid descendants with the combined spectral and morphological features data. In the calibration set, the misclassified numbers were both 0 and the respective accuracies were both 100% using the BPNN model with the spectral data and the combined spectral and morphological features data. The discrimination performance by PLSDA for glyphosate-resistant, conventional and their hybrid soybean seeds was the lowest. In the validation set, the discrimination performance by BPNN for conventional and glyphosate-resistant soybean seeds and their hybrid descendants was the best and 98% accuracy was achieved with the combined spectral and morphological features data. Furthermore, Fig. 6 shows the classification accuracies v. number of seeds per variety in calibration set using BPNN and LS-SVM models with the combined spectral and morphological features data. As seen from Fig. 6, the minimum number of seeds per variety that were required to be analysed in order to reach 95% accuracy were 110 and 150, using BPNN and LS-SVM models, respectively.
Classification accuracies v. number of seeds per variety in calibration set using BPNN (a) and LS-SVM (b) models with the combined spectral and morphological features data.
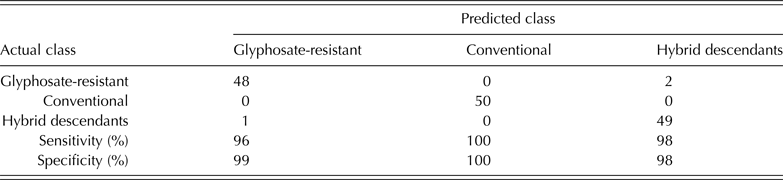
In order to analyse which classes were more easily confused with others, BPNN was first selected to assess its classification performance for differentiating three classes of soybean seeds (conventional, glyphosate-resistant soybean seeds and their hybrid descendants) using a confusion matrix. Table 2 lists the observation numbers, sensitivity and specificity of each class on the combined spectral and morphological features data set. In general, all the sensitivities and specificities were higher than 96% and only very few samples were misclassified. The biggest misclassification was observed between glyphosate-resistant soybean seeds and hybrid descendants, with 4% samples of glyphosate-resistant soybean seeds being misclassified as samples of hybrid descendants. As for LS-SVM, the biggest confusion was also observed between glyphosate-resistant soybean seeds and hybrid descendants with 6% (the confusion matrix was not shown here). As for PLSDA, the misclassification was relatively high and more samples were misclassified (the confusion matrix was not shown here). Clearly, BPNN had a better classification performance compared to LS-SVM and PLSDA, especially for the multiclass and complex classification.
Confusion matrix detailing the multi-class classification results of glyphosate-resistant and conventional soybean seeds and their hybrid descendants using BPNN method for the combined spectral and morphological features data set
DISCUSSION
In the present study, differences among conventional and glyphosate-resistant soybean seeds and their hybrid descendants could be grouped precisely. The best chemometric method for discrimination of conventional and glyphosate-resistant soybean seeds and their hybrid descendants with the combined spectral and morphological features data was BPNN, while the discrimination performance by PLSDA was the lowest. It is worth mentioning that PLSDA, although used extensively in chemometrics, did not perform always as well as LS-SVM and BPNN, at least for this particular case (Acevedo et al. Reference Acevedo, Jiménez, Maldonado, Domínguez and Narváez2007). A previous study by Roussel et al. (Reference Roussel, Hardy, Hurburgh and Rippke2001) introduced the use of near-infrared spectroscopy for detection of Roundup Ready® soybeans, but their measurements were carried out on bulk samples. The threshold or percentage of sample impurity was unknown. The small spectral differences suggested that low-level mixtures would not be identifiable by bulk sample methods. A recent paper by Lee & Choung (Reference Lee and Choung2011) analysed the feasibility of using near-infrared reflectance (NIR) spectroscopy for determining herbicide-resistant GM soybean seeds and reporting high accuracy (97%). However, the model they used was not validated with independent samples. Very recently, Agelet et al. (Reference Agelet, Gowen, Hurburgh and O'Donell2012) also studied the feasibility of using three NIR technologies for discrimination between conventional and Roundup Ready® soybeans, however, the accuracies were lower than those using visible light together with NIR radiation (Lee & Choung Reference Lee and Choung2011). While previous studies have utilized NIR spectroscopy successfully, it does not contain spatial information (i.e. seed size, length, width and roundness), which is important for discrimination of transgenic soybean seeds. Furthermore, the results from the ReliefF method showed that area was more important than length/width and roundness in discrimination of conventional and glyphosate-resistant soybean seeds and their hybrid descendants. And the contribution rates of area, length/width and roundness were 16·91, 4·44 and 0·01%, respectively.
CONCLUSIONS
The novelty of the current paper is the use of multispectral imaging technique combined with different chemometric methods, including PCA, PLSDA, LS-SVM and BPNN to discriminate conventional and glyphosate-resistant soybean seeds and their hybrid descendants. Meanwhile, the spectral data or the combined spectral and morphological features data were also the key factors for the rapid screen. The present study demonstrated that differences among conventional and glyphosate-resistant soybean seeds and their hybrid descendants did exist and could be grouped clearly. Multispectral imaging combined with different chemometric methods had been proved to be a very powerful tool for classifying conventional and glyphosate-resistant soybean seeds and their hybrid descendants. The BPNN model using the combined spectral and morphological features data was proved to have the best calibration and validation abilities with accuracy up to 98%. In conclusion, the current proof-of-concept method to classify conventional and glyphosate-resistant soybean seeds and their hybrid descendants using multispectral imaging and chemometric methods was realized successfully with very high accuracy. The use of multispectral imaging combined with chemometric methods for screening transgenic soybean seeds was a very attractive platform and had the potential to be widely used in rapid and on-site screening for its non-destructive, simple and no pre-treatments required.
This study was supported by the National Key Technologies R&D Programme (2012BAD07B01), the Anhui Province Key Technologies Research & Development Program (2013AKKG0798), the Specialized Research Fund for the Doctoral Program of Higher Education (20120111110024), the Fundamental Research Funds for the Central Universities (2012HGCX0003), the Excellent Young Teachers Program of Hefei University of Technology (2013HGQC0041), and the Postdoctoral Science Foundation of Hefei University of Technology (2013HGBH0031).