Introduction
Meat tenderisation results from the weakening of the myofibrillar structures and associated proteins and has been attributed to endogenous proteolytic enzymes. Research into proteases involved in post mortem proteolysis has predominantly focused on calpains and cathepsins, with the calpain system being considered to be a major contributor to meat tenderisation (Sentandreu et al., Reference Sentandreu, Coulis and Ouali2002). However, it has been suggested that meat tenderisation is a multienzymatic system and other proteases such as proteasome and caspases could also contribute (Ouali et al., Reference Ouali, Herrera-Mendez, Coulis, Becila, Boudjellal, Aubry and Sentandreu2006). The cysteine protease family of caspases is primarily associated with apoptosis, functioning in both cell disassembly (effector caspases, such as 3, 6 and 7) and in initiating this disassembly in response to pro-apoptotic signals (initiator caspases, such as 8, 9 and 12) (Thornberry and Lazebnik, Reference Thornberry and Lazebnik1998). Once activated, caspases target and specifically cleave a number of substrates including cytoskeletal proteins such as vimentin, desmin and spectrin that have an important structural role (Wang, Reference Wang2000).
In all the meat animals, the process of exsanguination deprives all cells and tissues of nutrients and oxygen. It has therefore been suggested that muscle cells have no alternative but to engage towards cell death (Herrera-Mendez et al., Reference Herrera-Mendez, Becila, Boudjellal and Ouali2006). Caspases are expressed in varying proportions in different skeletal muscles (Kemp et al., Reference Kemp, Bardsley and Parr2006a). Their activity changes during the post mortem conditioning period and preliminary data indicate that there is a relationship between caspase activity and meat tenderness as determined by shear force (Kemp et al., Reference Kemp, Parr, Bardsley and Buttery2006b). The objective of this study was to further investigate the potential role of caspases in meat tenderisation by determining if recombinant caspase 3 could degrade myofibrillar proteins.
Materials and methods
Myofibril isolation and preparation
A single sample of porcine longissimus dorsi (LD) muscle was dissected from the carcass within 15 min of slaughter and myofibrils were subsequently prepared according to the procedure of Goll et al. (1974). Myofibrils were stored in 50% glycerol and 100 mM NaCl at −20°C. Prior to incubation reactions, myofibrils were prepared by washing three times in a mixed salt solution (MSS: 12 mM NaCl, 12.6 mM MgSO4·7H20, 70 mM KH2PO4, 3.4 mM NaOH, 64.2 mM KOH, 11.1 mM H2SO4, 132 mM lactic acid, 100 mM 2-(N-Morpholino)ethanesulfonic acid (MES); the pH was adjusted to 5.8 with 1 M MES, 4°C). After the third wash, myofibrils were resuspended in MSS with 1.3 mM CaCO3. This buffer was designed to simulate the post mortem conditions in the muscle according to Winger and Pope (Reference Winger and Pope1981). The protein concentration of the myofibrils was determined using the Bradford assay (Bio-Rad, Hemel Hempstead, UK).
Purification of recombinant caspase 3
A pET-23 recombinant protein expression vector containing a cDNA insert encoding full-length human caspase 3 was a kind gift from Henning R. Stennicke (Nova Nordisk, Bargværd, Denmark). This vector contains a poly-histidine tag located at the C-terminus of caspase 3 cDNA insert, thereby allowing the expressed protein to be tagged. Recombinant caspase 3 (rC3) was expressed in Escherichia coli BL21 (DE3) cells, with expression induced by the addition of 0.2 mM isopropyl-beta-D-thiogalactopyranoside (IPTG). The type of recombinant caspase isoform produced is dependent on the incubation conditions. Incubation for 45 min at 30°C with 0.2 mM IPTG will yield the pro-caspase 3 isoform, whilst incubating for 3 h will yield the cleaved active isoform. This enables both types of caspase 3 to be expressed and eliminates any pre-activation step that is required if the active isoform is needed (Stennicke and Salvesen, Reference Stennicke and Salvesen1999). Following induction at 30°C for 3 h, rC3 was purified using the ÄKTA Explorer liquid chromatography system (GE Healthcare Life Sciences, Little Chalfont, UK) fitted with a 1 ml HisTrap HP affinity column (GE Healthcare Life Sciences) according to the procedure by Stennicke and Salvesen (Reference Stennicke and Salvesen1999). The HisTrap HP affinity column purifies the histidine tagged rC3 using immobilized metal ion affinity chromatography. In brief, the column was equilibrated with 5 column volumes of Buffer A (100 mM NaCl, 100 mM Tris, pH 8.0) before the cell lysate was applied to the column at a flow rate of 28 ml/h. Non-specifically bound material was washed off with 50 column volumes of Buffer B (500 mM NaCl, 20 mM imidazole, 100 mM Tris, pH 8.0). rC3 was eluted off the column with a 20 column volume linear imidazole gradient (0 to 200 mM) in Buffer A and 1 ml fractions collected. An aliquot of 100 μl of each fraction was taken and an equal volume of 2× SDS buffer (125 mM Tris-HCl pH 6.8, 4% (w/v) SDS, 10% glycerol, 10% beta-mercapotethanol, 0.01% (w/v) bromophenol blue) was added. Fractions were analysed by SDS-PAGE and the gel was Coomassie stained (0.2% Coomassie Blue, 0.2% amido black, 10% isopropanol, 10% acetic acid) for 15 min and then destained with changes of 10% acetic acid until bands could be visualised. Fractions containing rC3 were pooled and stored in 100 μl aliquots at −80°C (Stennicke and Salvesen, Reference Stennicke and Salvesen1999).
Purified rC3 activity was determined using Apo-One Homogeneous Caspase 3/7 assay (Promega, Southampton, UK) and a 1 : 1 volume ratio of caspase reagent to purified rC3 was used for the assay. Fluorescence was measured at an excitation wavelength of 485 ± 20 nm and an emission wavelength of 530 ± 25 nm on a FluoStar galaxy spectrometer (BMG Labtechnologies, Aylesbury, UK) every 5 min for 5 h to determine the rate of the reaction. A range of standards containing 0 to 100 μM of rhodamine 110 reference standard (Invitrogen, Paisley, UK) was used to quantify the fluorescence generated (as recommended by Promega). Protein concentration of purified rC3 was determined using a Bradford assay (Bio-Rad). One unit of rC3 was defined as the amount of enzyme that cleaved 2.94 mM rhodamine 110 substrate/min per μg purified protein.
Effect of increasing concentrations of rC3
Aliquots of 5 mg of isolated myofibrils were incubated with 1, 2, 5, 10 and 20 units of rC3. All myofibril incubation reactions were carried out in a total volume of 500 μl, adjusted to by the addition of MSS buffer. Controls were set up containing no rC3 and 10 units of rC3 with Ac-DEVD-CHO (Sigma, Poole, UK), the caspase 3-specific inhibitor to a final concentration of 0.1 μg/μl. To ensure that any proteolysis observed could not be attributed to endogenous calpain activity, 5 mM ethylenediaminetetraacetic acid (EDTA) was added to specific control reactions with and without 10 units of rC3. In addition 50 μl semi-purified porcine skeletal muscle calpastatin (using the heated calpastatin extraction protocol, as described by Kent et al., Reference Kent, Veiseth, Therkildsen and Koohmaraie2005) was also added to a myofibril aliquot containing 10 units of rC3. Activity of the isolated calpastatin was 7.87 × 10⁷ units of fluorescence/kg tissue as defined by Sensky et al. (1996). Reactions were incubated with a total of 700 units of semi-purified calpastatin. All reactions were incubated at 37°C for 24 h. After incubation, myofibrils were centrifuged at 6000 × g for 3 min at 4°C. The supernatant was removed and the pellet resuspended in 100 μl MSS with 1.3 mM CaCO3. Aliquots of supernatant and resuspended pellet samples were taken for determination of protein concentration using the Bradford assay (Bio-Rad). Samples were prepared for SDS-PAGE by the addition of an equal volume of 2 × SDS buffer.
Effect of incubation temperature
Aliquots of 5 mg myofibrils with either 1 unit or 10 units of rC3 were incubated at 25, 15 and 4°C for 24 h, to mimic the change in carcass temperature during the post mortem conditioning period. After incubation, samples were prepared for SDS-PAGE as described above.
Effect of incubation time
Aliquots of 5 mg myofibrils with either 1 unit or 10 units of rC3 were incubated at 4°C for 0, 1, 2 and 5 days. Control incubations of 5 mg of myofibrils containing no rC3 were incubated at 4°C for 0, 1, 2 and 5 days. After incubation, samples were prepared as before.
SDS-PAGE and immunoblotting
The incubated myofibrillar protein samples in 2 × SDS buffer were prepared for SDS-PAGE analysis by boiling for 5 min to denature the proteins before centrifuging at 15 000 × g for 3 min. Either 20 μg of resuspended pellet protein or 30 μg supernatant was loaded onto 12.5% SDS-PAGE gels. The gels were electrophoresed on a vertical dual-plate unit (Fisher, Loughborough, UK) at a constant of 200 V for 1 h in 1 × SDS buffer (0.025 M Tris, 0.192 M glycine, 0.1% (w/v) SDS. The separated proteins were either transferred onto a polyvinylidene difluoride (PVDF) membrane (GE Healthcare Life Sciences) by Western blotting (Towbin et al., Reference Towbin, Staehelin and Gordon1979) using a Trans-blot cell with plate electrodes (Bio-Rad) containing Western blot buffer (0.4 M glycine, 0.025 M Tris, 5% (v/v) isopropanol) at a constant current of 350 mA for 2 h or Coomassie stained. Western blots were immunoprobed with either anti-human caspase 3 polyclonal antibody diluted 1 : 2000 (Merck Biosciences, Nottingham, UK) or anti-chicken desmin polyclonal antibody diluted 1 : 500 (Sigma Aldrich, Poole, UK). Protein bands were detected using the enhanced chemiluminescence (ECL) detection system (GE Healthcare Life Sciences). The chemiluminescence was captured on ECL Hyperfilm (GE Healthcare Life Sciences) and the resulting bands were quantified using a Fluor S Max multi-imager (Bio-Rad) producing digital images of the bands using its CCD 32-bit cooled video camera. The digital image was analysed using Quantity One software (Bio-Rad) enabling densitometry to be performed on the digital image. On the Coomassie SDS-PAGE gels the intensity of the identified bands in each lane were expressed relative to the alpha-actinin band intensity.
Protein identification
Specific myofibrillar proteins were identified based on the description by Porzio and Pearson (Reference Porzio and Pearson1977) of a SDS-PAGE separation of myofibril proteins and also Precision Plus Protein Standard (Bio-Rad) was used to identify proteins’ molecular weights. A number of protein bands that appeared to result from degradation were excised from the Coomassie-stained gels using a scalpel blade and sent for analysis to the Biopolymer Synthesis And Analysis Unit at the Queens Medical Centre, University of Nottingham, UK. Protein bands were analysed using MALDI-TOF (Matrix-Assisted Laser Desorption Ionisation-time of flight) mass spectrometry (Waters Corporation, MA, USA) and identification by peptide mass mapping was performed using the database search program MASCOT PMF (Matrix Science Ltd, London, UK).
Data analysis
Statistical analysis between caspase 3/7 activities of the samples was performed using ANOVA with Genstat for Windows (version 7.2) (Hemel Hempstead, UK).
Results and discussion
Purification and determination of rC3 activity
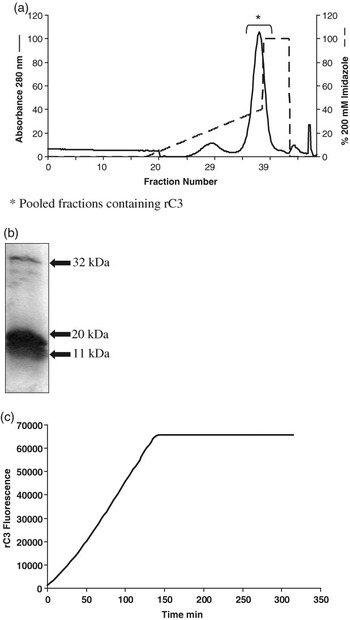
The trace of the 280 nm absorbance measured on the ÄKTA Explorer liquid chromatography system showed that absorbance peaked between column volumes 35 and 40 (Figure 1a). These fractions were subsequently analysed by SDS-PAGE and Coomassie staining and both the inactive 32 kDa isoform and the active 20 and 11 kDa isoforms of caspase 3 were detected and these fractions pooled together (Figure 1b). Coomassie staining confirmed that the pooled fractions were homogenous with no other proteins detected other than the inactive and active isoforms of rC3. Pro-caspase 3 is a 32-kDa peptide and during the process of activation, peptide fragments of 20 to 17 and 11 kDa are generated (Liu et al., Reference Liu, Chang and Yang2005). Coomassie staining indicated that rC3 was predominantly present in the active isoforms. The predominance of the active isoform was expected as protein expression was induced for 3 h with IPTG to yield the active isoform of rC3 (as described by Stennicke and Salvesen, Reference Stennicke and Salvesen1999). The specific rC3 activity of the pooled fractions was measured and the initial rate of reaction determined as 479 units of fluorescence generated/min (Figure 1c). The fluorescence generated was calibrated and quantified by comparison with standard concentrations of a rhodamine 110 reference standard, a caspase 3-specific fluorescent substrate. The 479 units of fluorescence were determined to be equivalent to 3.15 μM of rhodamine 110 substrate. This was subsequently adjusted to the protein concentration of rC3 present in the sample. One unit of rC3 was therefore determined as the amount of enzyme that cleaved 2.94 mM of rhodamine 110 substrate/min per μg purified protein.
(a) Absorbance (280 nm) of eluted fractions of bacterial lysate containing expressed rC3, purified using ÄKTA Explorer liquid chromatography system fitted with HisTrap HP affinity column and eluted with a linear gradient of 0 to 200 mM imidazole in Buffer A. Flow rate: 28 ml/h. Fraction volume: 1 ml. Pooled fractions are indicated (b) SDS-PAGE (12.5%) loaded with 10 μg of pooled elution fractions containing purified rC3. Molecular weights of inactive and active isoforms of rC3 are indicated. (c) rC3 proteolytic activity, used to determine the initial rate of reaction, the amount of fluorescence generated is directly proportional to the amount of cleavage from its pro-isoform to its active isoform.

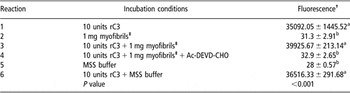
To determine if there was any affect of the MSS buffer and the myofibrillar proteins on rC3 activity, a series of incubation reactions were performed: (1) 10 units of rC3 (2) 1 mg myofibril proteins (3) 10 units of rC3 + 1 mg myofibril proteins (4) 10 units of rC3 + 1 mg myofibrils + Ac-DEVD-CHO (final concentration of 0.1 μg/μl) (5) 50 μl MSS buffer (6) 10 units of rC3 + 50 μl MSS buffer, an equal volume of Caspase 3/7 reagent was added to each reaction and the fluorescence measured (Table 1). Results indicated that there was no apparent endogenous caspase 3/7 activity in isolated myofibrils, rC3 was active in the presence of myofibrils and this activity could be inhibited using the caspase-specific inhibitor Ac-DEVD-CHO. Caspase 3/7 activity in reactions 1, 3 and 6 were found to be significantly higher than that in reactions 2, 4 and 5, which contained no rC3 or rC3 activity was inhibited (P < 0.001). Furthermore the activity of rC3 was not affected by the MSS buffer indicating that there was caspase 3 activity in an incubation which was not at the optimal pH 7.4 for available rC3 (pH of MSS buffer was 5.8) (Table 1). This could therefore suggest that caspases can remain active over a wide range of pH, which would be important and necessary if caspases are to maintain their proteolytic activity in muscle post mortem, where muscle pH decreases from around 7 to 5.3–5.8 (Smulders et al., Reference Smulders, Toldra, Flores and Prieto1992).
Effect of MSS buffer, myofibrils and caspase inhibitor Ac-DEVD-CHO on recombinant caspase 3 activity determined using Apo-One Homogeneous Caspase 3/7 assay

†The amount of fluorescence (arbitrary units) generated is directly proportional to the quantity of substrate cleaved and therefore the caspase activity.
‡Myofibrils were resuspended in mixed salt solution (MSS) buffer, pH 5.8.
Values are expressed as mean (n = 3) ± s.e.
Values with different superscript letters are significantly different.
Effect of increasing concentration of rC3 on myofibril degradation
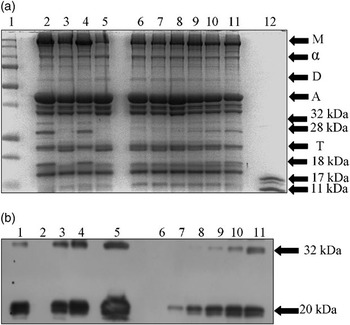
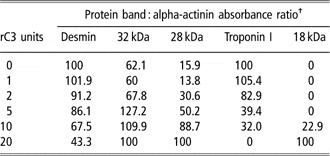
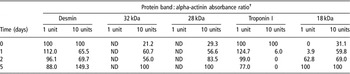
Caspases are highly selective in the substrates that they target and cleave. Whilst most proteins contain sites that are susceptible to protease activity, because of the specificity of the position of the amino acid residues required; Asp in the P1 and the P4 position for caspases, the peptides generated by their actions are limited and provide ‘fingerprints’ of their activity (Wang, Reference Wang2000). The specificity of the amino acid sequence motif required by caspases is a safety mechanism, enabling controlled caspase activation and cleavage and preventing any inappropriate cellular destruction (Fuentes-Prior and Salvesen, Reference Fuentes-Prior and Salvesen2004). Differences in the patterns of myofibrillar proteins separated by SDS-PAGE were observed in myofibril samples incubated with rC3 for 24 h at 37°C in comparison to those incubated without rC3 (Figure 2a). These differences were presumably caused by rC3-mediated proteolysis of the myofibril proteins whilst being incubated at pH 5.8. In a study examining the effect of incubating μ-calpain with myofibril proteins and their identification of proteolysis by SDS-PAGE, the degradation of desmin and troponin I bands was described (Geesink and Koohmaraie, Reference Geesink and Koohmaraie1999). Using similar SDS-PAGE analysis of myofibril protein degradation products, the overall effect of increasing concentrations of rC3 was the decrease in band intensities at 55 kDa and 22 kDa and the appearance of degradation products at approximately 32, 28 and 18 kDa (Figure 2a). The 55 and the 22 kDa bands were initially identified as the cytoskeletal proteins desmin and troponin I, respectively, on the basis of their molecular weights and also upon comparison with SDS-PAGE reports by Whipple et al. (Reference Whipple, Koohmaraie, Dikeman, Crouse, Hunt and Klemm1990); Geesink and Koohmaraie (Reference Geesink and Koohmaraie1999); Lametsch et al. (Reference Lametsch, Roepstorff, Moller and Bendixen2004) and Hwang et al. (Reference Hwang, Park, Kim, Cho and Lee2005), who identified similar patterns. Similar to the approach of Lametsch et al. (Reference Lametsch, Roepstorff, Moller and Bendixen2004) and Hwang et al. (Reference Hwang, Park, Kim, Cho and Lee2005) MALDI-TOF peptide mapping was subsequently carried out and this analysis confirmed these two bands to be desmin and troponin I. The degradation peptides at 32, 28 and 18 kDa were also identified by MALDI-TOF analysis and were found to result from alpha-actin, troponin T and myosin light chain 3 proteolysis, respectively. Previously, Ho et al. (Reference Ho, Stromer and Robson1994) also identified troponin T to be degraded during post mortem skeletal muscle studies in bovine LD. The relative changes in the bands’ intensity induced by incubation with rC3 are shown in Table 2. In order to normalise for the protein load on SDS-PAGE within each lane, the values for band intensity are expressed relative to the alpha-actinin band intensity, this assumes that alpha-actinin is not degraded by caspase-mediated proteolysis (Table 2). Alpha-actinin is generally resistant to proteolysis, particularly to those proteases involved in post mortem tenderisation (Taylor et al., Reference Taylor, Geesink, Thompson, Koohmaraie and Goll1995). Overall increasing the quantity of rC3 present enhanced the degradation of bands identified by MALDI-TOF analysis as desmin and troponin I and lead to the appearance of degradation products at 32, 28 and 18 kDa, corresponding to result from alpha-actin, troponin T and myosin light chain 3 proteolysis. The changes in these specific bands were not detected in myofibrils incubated without rC3 or with the caspase 3-specific inhibitor Ac-DEVD-CHO (Figure 2a, lanes 3 and 5). These observations corresponded to the caspase 3/7 activity reactions which showed there was no endogenous caspase activity and rC3 activity could be inhibited by the caspase-specific inhibitor Ac-DEVD-CHO (Table 1).
Effect of incubating myofibrils with increasing concentrations of rC3 at 37°C for 24 h. (a) SDS-PAGE (12.5%) loaded with 20 μg of the pellet fraction of incubated myofibrils, lane 1: molecular weight standard proteins, lane 2 : 10 units of rC3 + 5 mM EDTA, lane 3: no rC3 + 5 mM EDTA, lane 4 : 10 units of rC3 + 50 μl semi-purified calpastatin, lane 5 : 10 units of rC3 + Ac-DEVD-CHO (0.1 μg/μl), lanes 6 to 11 correspond to myofibrils incubated with 0, 1, 2, 5, 10 and 20 units rC3, respectively, lane 12 : 10 units of non-incubated rC3. (b) Representative Western blot loaded with 20 μg of the pellet fraction of incubated myofibrils probed for caspase 3, lane 1 : 10 units of rC3 + 5 mM EDTA, lane 2: no rC3 + 5 mM EDTA, lane 3 : 10 units of rC3 + 50 μl semi-purified calpastatin, lane 4 : 10 units of rC3 + Ac-DEVD-CHO (0.1 μg/μl), lane 5 : 10 units of rC3, lanes 6 to 11 correspond to myofibrils incubated with 0, 1, 2, 5, 10 and 20 units of rC3, respectively. The major immuno-reactive bands for caspase 3 are indicated. Abbreviations: M = myosin heavy chain; α = α-actinin; D = desmin; A = actin; T = troponin-I.

Protein levels of bands identified by SDS-PAGE in myofibrils subjected to incubation with different levels of rC3 at 37°C for 24 h

†Figures are expressed as percentage of densitometry units of bands from Coomassie-stained SDS-PAGE relative to 0 units for Desmin, and Troponin I and 20 units for 32, 28 and 18 kDa degradation products.
The degradation of myofibrillar proteins was also observed in myofibril samples incubated with rC3 and either 5 mM EDTA or crude calpastatin extract (Figure 2a lanes 2 and 4, respectively). The endogenous calpain inhibitor calpastatin (50 μl of semi-purified crude extract) was included in the myofibril incubations to try to ensure any degradation found could not be attributed to the actions of any residual calpain in the samples. Calpastatin is also a known caspase substrate and has been reported to be degraded to 75 and 30 kDa fragments by both caspases 3 and 7 (Wang et al., Reference Wang, Posmantur, Nadimpalli, Nath, Mohan, Nixon, Talanian, Keegan, Herzog and Allen1998). Caspase activity and the degradation of calpastatin in early apoptosis are thought to compromise plasma membrane and cytoskeletal integrity, resulting in increase of intracellular Ca2+ levels and calpain activation (Wang, Reference Wang2000). The interaction between calpain and caspase protease system is multifaceted; Neumar et al. (Reference Neumar, Xu, Gada, Guttmann and Siman2003) reported that human neuroblastoma cells over-expressing calpastatin not only inhibited calpain activity but also up-regulated caspase activity and accelerated apoptosis. The exact mechanism behind this up-regulation remains unclear. In the current study, it appears that co-incubation of calpastatin and myofibrils with rC3 induced an increase in band intensities of the 32, 28 and 18 kDa cleavage products (Figure 2a, lane 4). Similarly, in myofibril samples co-incubated with rC3 and 5 mM EDTA band intensities of the degradation products also appeared to be more intense, in particular the 32- and 28-kDa peptides (Figure 2a lane 2) in comparison to myofibrils incubated without EDTA. Assessment of band intensities using densitometry showed a fourfold increase in the band intensity of the 28-kDa peptide and a twofold increase in the band intensity of the 32-kDa peptide in myofibrils incubated with either calpastatin or EDTA and rC3 in comparison to those incubated with just rC3. In a study by McGinnis et al. (Reference McGinnis, Gnegy, Park, Mukerjee and Wang1999), incubation of human neuroblastoma cells with the Ca2+ chelator EGTA exhibited increased caspase activity and apoptosis, whilst calpain activity was inhibited. It is therefore plausible to speculate that EDTA may have a similar effect in myofibrils, increasing the ability of caspase 3 to mediate protein degradation. Inhibiting the calpains by including EDTA and calpastatin in the myofibril incubation reactions suggests that the 32-, 28- and 18-kDa peptides are not products of calpain-mediated proteolysis. Although both the studies by McGinnis et al. (Reference McGinnis, Gnegy, Park, Mukerjee and Wang1999) and Neumar et al. (Reference Neumar, Xu, Gada, Guttmann and Siman2003) were performed in human neuroblastoma cells, in which apoptotic events are well characterised, it is becoming widely accepted that caspase-mediated apoptosis occurs under a number of conditions in skeletal muscle (for review see Tews, Reference Tews2005). The apparent increased proteolysis observed in the myofibrils incubated with calpain inhibitors accentuates the complexity of post mortem proteolysis and suggests that meat tenderisation could be multienzymatic and further investigation is therefore needed to understand the mechanisms behind it.
Western blots probed with the anti-caspase 3 antibody detected immunopositive bands at 32 and 20 kDa that could correspond to the inactive and active isoform (Figure 2b). The 11 kDa active isoform is not recognised by this antibody (Merck Biosciences). Caspase 3 was detected in all the myofibril samples incubated with rC3, as expected the higher the concentration of rC3 in the incubation samples, the greater the protein levels of caspase 3 detected by Western blotting. More importantly, the inclusion of EDTA, calpastatin and Ac-DEVD-CHO inhibitor did not appear to have any effect on caspase 3 protein levels. Purified rC3 (10 units) was used as a positive control.
Effect of temperature on myofibril degradation
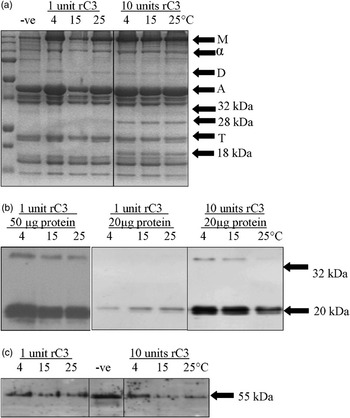
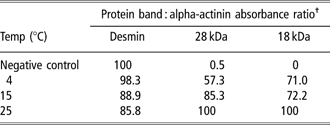
During the post mortem conditioning period the carcass temperature decreases from 37°C to 4°C (Savell et al., Reference Savell, Mueller and Baird2005). Incubation reactions with commercially available rC3 are recommended to occur at 37°C pH 7.4, as this is presumably when enzyme activity is at an optimum. It was therefore of interest to determine if rC3 would be active both at pH 5.8 and lower temperatures (analogous to those in a cooling carcass) and whether the degradation patterns observed in the increasing concentration of rC3 experiment also occurred at lower temperatures. Myofibrils incubated with 10 units of rC3 at 4°C, 15°C and 25°C (Figure 3a, lanes 6 to 8) showed visibly high levels of protein bands produced as a result of protein degradation in comparison the samples incubated with 1 unit of rC3 (Figure 3a, lanes 3 to 5). With changes in the desmin band and the appearance of troponin T and myosin light chain 3 degradation products at approximately 28 and 18 kDa detected, when compared relative to the alpha-actinin band (Table 3).
Effect of myofibrils incubated with high and low concentrations of rC3 at 4, 15 and 25°C for 24 h. (a) SDS-PAGE (12.5%) loaded with 20 μg of the pellet fraction of incubated myofibrils. (b) Representative Western blot loaded with either 50 or 20 μg of the pellet fraction of incubated myofibrils probed for caspase 3. (c) Representative Western blot loaded with 30 μg of the supernatant fraction of the incubated myofibrils probed for desmin. Negative controls were incubated with no rC3 at 37°C for 24 h. The major immuno-reactive bands for caspase 3 and desmin are indicated. Abbreviations: M, myosin heavy chain; α, α-actinin; D, desmin; A, actin; T, troponin-I.

Protein levels of bands identified by SDS-PAGE of myofibrils subjected to incubation with 10 units of rC3 at different incubation temperatures for 24 h
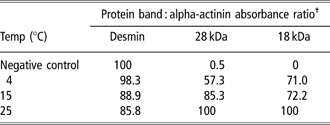
†Figures are expressed as percentage of densitometry units obtained from bands on Coomassie-stained SDS-PAGE relative to the negative control for Desmin, and 25°C for 28 and 18 kDa degradation products.
Negative control is myofibril samples incubated without rC3 at 37°C.
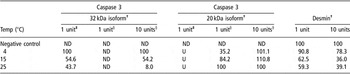
Caspases are expressed as proenzymes and are activated by the removal of the prodomain (Earnshaw et al., Reference Earnshaw, Martins and Kaufmann1999). The isoform of the recombinant caspase is dependent on the length of incubation with IPTG. In this experiment, expression of rC3 was induced for 3 h to yield the active caspase 3 isoform. However, SDS-PAGE and Western blot analysis showed that the inactive isoform of caspase 3 was also present, although to a much lesser extent (Figure 1b). Western blots were probed for caspase 3 to determine whether temperature had any effect on the activation of rC3 as indicated by changes in the caspase 3 immunopositive bands at 32 and 20 kDa. In the myofibril samples incubated with 10 units of rC3, protein levels of the inactive 32 kDa isoform were found to decrease as temperature increased, suggesting that there was more activation from its pro-isoform to its active isoform at higher temperatures (Figure 3b, lanes 7 to 9). This pattern was also observed in the myofibrils incubated with lower concentrations of rC3 but was only visible when the quantity of total protein loaded onto the gel was increased from 20 to 50 μg (Figure 3b, lanes 1 to 3). Western blots loaded with 20 μg of myofibril samples incubated with 1 unit of rC3, showed protein levels of the active 20 kDa isoform of caspase 3 were lower at 4°C than at 25°C (Figure 3b, lanes 4 to 9). This may indicate that there was less cleavage of caspase 3 from its pro-form to its active form as the temperature decreased, although this was not apparent in myofibrils with 10 units of rC3 (Table 2). This was not noticeable in Western blots loaded with 50 μg of myofibril sample as the increased protein quantity required for detection of the inactive 32 kDa caspase 3 isoform in the samples resulted in saturation of the signal from the band representing the active 20 kDa isoform (Table 4). In a similar study by Koohmaraie et al. (Reference Koohmaraie, Schollmeyer and Dutson1986) μ-calpain activity at 4°C was found to be 24% to 28% of that at 25°C and was also capable of causing myofibrillar degradation and does not need to be at its optimum activity level to cause proteolysis.
Protein levels of caspase 3 and desmin in myofibrils subjected to different incubation temperatures with 1 or 10 units of rC3

ND = not detectable.
U = unquantifiable, band signal saturated by increased protein concentration.
†Figures are expressed as percentage of densitometry units obtained from Western blots relative to 4°C for the 32 kDa isoform, 25°C for the 20 kDa isoform and the negative control for Desmin.
‡Data from Western blots loaded with 50 μg of myofibril protein.
§Data from Western blots loaded with 20 μg of myofibril protein.
Values are not comparable across blots.
Negative control is myofibril samples incubated without rC3 at 37°C.
An increase in desmin degradation was observed in myofibrils incubated with increasing concentrations of rC3 and also increasing temperatures, as detected by Coomassie staining. The intermediate filament protein desmin is part of cytoskeletal structure of skeletal muscle, cross-linking myofibrils at the Z-disc as well as linking myofibrils to the sarcolemma via costameres and is susceptible to post mortem proteolysis (Taylor et al., Reference Taylor, Geesink, Thompson, Koohmaraie and Goll1995). Western blot analysis was therefore performed to determine if desmin was cleaved by rC3 under the experimental incubation conditions. The myofibril supernatant was used for desmin analysis due the detection of non-specific products and high background levels found with the pellet samples. Western blot analysis detected a band at 55 kDa that corresponds to desmin. The rate of desmin degradation varies between muscles and also between the same muscle in different animals, with faster degradation occurring in tender muscle in comparison to muscle classified as tough (Hopkins and Thompson, Reference Hopkins and Thompson2002). Western blot analysis showed that there was an increased disappearance of the desmin band with increasing temperatures for myofibril samples incubated with either 1 unit or 10 units of rC3. The isolated myofibrils incubated at 25°C had approximately twice as much desmin degradation in comparison to those incubated at 4°C (Figure 3c, Table 4).
Although few differences were observed by Coomassie staining on overall myofibril degradation, Western blot analysis showed that temperature did have an effect on both the cleavage of pro-caspase 3 into its active isoform and also on the extent of desmin degradation, with increased caspase activation and desmin proteolysis detected in myofibrils incubated at higher temperatures. However, an important observation was that whilst rC3 was apparently more active at higher temperatures it was still active and capable of causing myofibrillar degradation at 4°C.
Effect of incubation time on myofibril protein degradation
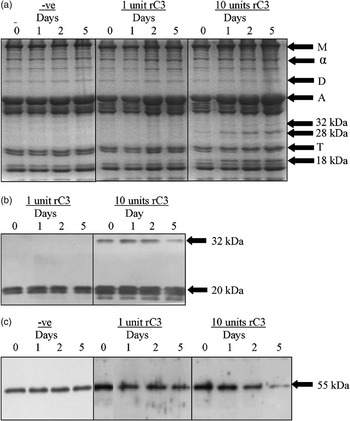
The recommended conditioning period for pork is between 5 and 10 days (Warriss, Reference Warriss2000). Myofibrils were incubated with either 1 unit or 10 units of rC3 at 4°C, pH 5.8 for a period of up to 5 days to try and replicate the in situ post mortem muscle conditions in vitro. Reactions were terminated after 1, 2 and 5 days, with one sample stopped as soon as the incubation was set up (0 days). Myofibril incubation reactions with time were also set up without rC3 to ensure any degradation that was observed could not be attributed to incubation alone. Incubation of myofibrils with rC3 over 5 days at 4°C resulted in visible differences in the bands detected by SDS-PAGE. In the myofibrils incubated with 1 unit of rC3, there was a clear increase in intensity, relative to alpha-actinin, in a band at approximately 18 kDa from 2 days, identified to occur from degradation of myosin light chain 3 (Figure 4a and Table 5), which were presumably generated by rC3-mediated proteolysis. In comparison, in the myofibrils incubated with 10 units of rC3 the degradation patterns were much more pronounced and there were distinct changes in a number of bands relative to alpha-actinin (Figure 4 and Table 5). This is not unexpected, if rC3 is responsible for the proteolysis of myofibrillar proteins observed more degradation would be detected in the reactions containing increased concentrations of rC3, providing the substrate did not become limiting. The 18 and 28 kDa degradation products were detectable from the start of the incubation, suggesting that the action of high concentrations of caspases on myofibril degradation is relatively rapid (Figure 4 and Table 5). Caspase activation is known to occur quickly with the period from apoptotic stimuli to caspase activation happening in approximately 10 min and once committed cell death is inevitable. Although initiation of activity may be rapid, the time between the initial apoptotic trigger to complete cellular destruction can take hours or even days (Green, Reference Green2005). In these studies, myofibrils were incubated with rC3 predominantly in its active isoform and therefore its effects on myofibrillar proteins can occur immediately as it does not require activation. Apoptosis is translationally regulated process permitting immediate and selective changes in protein levels and therefore no new transcription synthesis is required for complete cellular destruction (Holcik and Sonenberg, Reference Holcik and Sonenberg2005). Consequently, it can be assumed that the proteolysis observed in vitro is also happening in vivo. The band identified as troponin-I, by its molecular weight and MALDI-TOF peptide mapping, appeared almost completely degraded after 2 days of incubation (Figure 4a) and when compared, relative to alpha-actinin, it was not detectable by densitometry after 1 day when myofibrils were incubated with 10 units of rC3 (Figure 4 and Table 5). The caspase-mediated myofibril degradation patterns observed with time are similar to those shown by Geesink and Koohmaraie (Reference Geesink and Koohmaraie1999) in bovine myofibrils incubated with μ-calpain, who found the appearance of protein degradation products in the 28 to 32 kDa region after 1 day of incubation and the degradation of troponin-I after 2 days. A major qualitative difference between our observations and those of Geesink and Koohmaraie (Reference Geesink and Koohmaraie1999) was the presence of a peptide at approximately 18 kDa, which was identified to arise from myosin light chain 3 degradation. However, the degradation of myosin light chains has been has been related to pig meat quality (Lametsch et al., Reference Lametsch, Roepstorff, Moller and Bendixen2004; Hwang et al., Reference Hwang, Park, Kim, Cho and Lee2005). The detection of a myosin light chain degradation product in myofibrils incubated with caspases and not in reactions incubated with calpains is not unsurprising as myosin light chain has previously been identified as a caspase substrate (Fischer et al., Reference Fischer, Janicke and Schulze-Osthoff2003). In the myofibril samples incubated with 10 units of rC3, there appeared to be an increase in the 28 kDa troponin T degradation product and the 18 kDa myosin light chain degradation peptide with time (Figure 4a lanes 9 to 12), suggesting increased rC3-mediated proteolysis. In comparison, there was no apparent degradation in the myofibril samples incubated for 5 days at 4°C with no rC3 added (Figure 4a), indicating that rC3 was responsible for the degradation observed and that the process of incubation alone had no visible detrimental affects on the myofibrils.
Effect of myofibrils incubated with high and low concentrations of rC3 for 0, 1, 2 and 5 days at 4°C. (a) SDS-PAGE (12.5%) loaded with 20 μg of the pellet fraction of incubated myofibrils. Negative control: myofibrils incubated with no rC3. (b) Representative Western blot loaded with 20 μg of the pellet fraction of incubated myofibrils probed for caspase 3. (c) Representative Western blot loaded with 30 μg of the supernatant fraction of the incubated myofibrils probed for desmin. The major immuno-reactive bands for caspase 3 and desmin are indicated. Abbreviations: M, myosin heavy chain; α, α-actinin; D, desmin; A, actin; T, troponin-I.

Protein levels of bands identified by SDS-PAGE of myofibrils subjected to incubation with 1 or 10 units of rC3 over time at 4°C

ND = not detectable.
†Figures are expressed as percentage of densitometry units obtained from bands on Coomassie-stained SDS-PAGE relative to 0 days for Desmin, and Troponin I and 5 days for 32, 28 and 18 kDa.
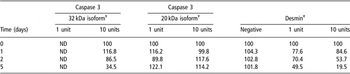
The effect of incubation time on caspase 3 is shown in Figure 4b. There was little difference in protein levels of the active 20 kDa caspase 3 isoform detected by Western blotting across the incubation period for myofibrils incubated with either high or low concentrations of rC3. However, in the myofibrils incubated with high concentrations of rC3, protein levels of the inactive 32 kDa isoform of caspase 3 were found to decrease across the incubation period. This would suggest that the inactive 32 kDa isoform of caspase 3 is being cleaved and activated into the proteolytically active isoform with time (Table 6). Caspase 3 protein levels were shown to be affected by incubation temperature (Figure 3b and Table 4), with more inactive isoform present in myofibrils incubated at lower temperatures (Figure 3b, lanes 7 to 8). However, increasing the incubation time appears to compensate for the decreased activity at 4°C allowing more caspase cleavage from the inactive isoform and therefore presumably enabling more proteolysis to occur.
Protein levels of recombinant caspase 3 and desmin in myofibrils incubated with 1 or 10 units of rC3 over time at 4°C

ND = not detectable.
†Figures are expressed as percentage of densitometry units obtained from Western blots relative to 0 days.
Negative = negative control myofibrils incubated without rC3 at 4°C.
Desmin is involved in linking Z-disk to Z-disk in the myofibrillar lattice. The degradation of desmin is thought to significantly contribute to tenderisation (Hopkins and Taylor, Reference Hopkins and Taylor2004; Geesink et al., Reference Geesink, Kuchay, Chishti and Koohmaraie2006). Research by Koohmaraie et al. (Reference Koohmaraie, Shackelford, Wheeler, Lonergan and Doumit1995) found that in lambs carrying the callipyge phenotype, which is associated with increased levels of calpastatin and increased meat toughness, there was a reduction in the degradation of a number of myofibrillar proteins including desmin in comparison to normal lambs, suggesting its importance with regard to meat tenderness. In this study, Western blot analysis for desmin showed that protein levels of desmin decreased in myofibril proteins incubated with rC3 across the time course (Figure 4c, Table 6). Approximately half the total desmin detected in the supernatant of the myofibrillar incubations was degraded by 2 and 5 days in myofibrils incubated with high and low levels of rC3, respectively (Table 6). Desmin degradation by calpain has been shown to occur within 1 day in ovine LD (Veiseth et al., Reference Veiseth, Shackelford, Wheeler and Koohmaraie2004) and in bovine semimembranosus (Taylor et al., Reference Taylor, Geesink, Thompson, Koohmaraie and Goll1995) at pH 8.3 and 7.0, respectively, with both groups showing significant loss of desmin at the end of the incubation periods. Although desmin degradation was not as rapid in myofibrils incubated with rC3 in comparison to those studies with calpain, the rC3 incubations were performed at a lower pH than those of calpain, which may affect rC3 activity. To date, there is no data on the effect of pH on the stability and proteolytic activity of caspases; however, it has been speculated that as caspases are neutral peptidases their activity will be affected by muscle acidification in a similar way to calpains (Sentandreu et al., Reference Sentandreu, Coulis and Ouali2002).
Conclusions
This study has demonstrated evidence that human rC3 is capable of causing degradation of porcine myofibrillar proteins. Recombinant caspase 3 is still active and causes proteolysis of myofibrils in post mortem conditions of 4°C and pH 5.8. Upon incubating for up to 5 days, there was increased degradation of desmin and troponin I and also the appearance of a number of peptides that could result from proteolysis of myosin light chain 3, alpha-actin and troponin T, as detected by SDS-PAGE and MALDI-TOF analysis. Proteolysis of desmin by rC3 over time was also detected by Western blot analysis. The identification that the 28 kDa degradation product was from troponin T proteolysis as detected by Coomassie staining, is an important observation as troponin T is extensively hydrolysed in the post mortem conditioning period (Ho et al., Reference Ho, Stromer and Robson1994) and its degradation has been shown to positively correlate to tenderness (Huff-Lonergan et al., 1996). Additionally, the myofibrillar protein degradation patterns observed and the degradation of desmin detected by Western blot analysis are similar to those observed in myofibrils incubated with μ-calpain (Taylor et al., Reference Taylor, Geesink, Thompson, Koohmaraie and Goll1995; Geesink and Koohmaraie, Reference Geesink and Koohmaraie1999). These findings therefore strengthen the hypothesis that caspases could contribute to post mortem proteolysis and meat tenderisation is a multienyzmatic process.
Acknowledgements
This work has been supported by studentships from the Biotechnology and Biological Sciences Research Council (BBSRC), UK (C. M. Kemp).