INTRODUCTION
Coffee is an important cash crop in the highlands of East Africa. In 2009, it was ranked among the two most important export crops in Burundi, Democratic Republic of Congo, Tanzania, Rwanda and Uganda (Food and Agriculture Organization (FAO), 2011). In Uganda, the largest producer of coffee in the region (FAO, 2011), the value of coffee exported was estimated to be 11% of the total value of all commodities exported in 2009 (International Coffee Organization (ICO), 2011). Arabica (Coffea arabica) and Robusta (Coffea canephora), the two coffee types grown, were estimated to contribute 27% and 73%, respectively, of the total volume of coffee exported from Uganda in 2010 (Uganda Coffee Development Authority (UCDA), 2010). Coffee yields in 2009 in Uganda, in terms of green bean, were estimated to average 0.6 t ha−1 year−1 (FAO, 2011), but higher yields of 1.5 and 3.0 t ha−1 year−1 are possible for Arabica and Robusta, respectively, in small holdings (Marsh, Reference Marsh2007).
Nutrient depletion is severe in the East African region (Stoorvogel et al., Reference Stoorvogel, Smaling and Janssen1993), as use of nutrient input is inadequate or minimal (Bekunda, Reference Bekunda1999). The high costs of fertiliser and the heterogeneity of production environments are among the challenges to fertiliser use in the region (Mwangi, Reference Mwangi1997). Hence, poor soil fertility is a major constraint to coffee production in the region (e.g. Stephens, Reference Stephens1967; Wortmann and Kaizzi, Reference Wortmann and Kaizzi1998).
Targeting fertiliser recommendations to existing nutrient deficiencies would improve crop response to fertiliser and hence increase the likelihood of fertiliser use. The Diagnosis and Recommendation Integrated System (DRIS) (Beaufils, Reference Beaufils1973) and the Compositional Nutrient Diagnosis (CND) (Parent and Dafir, Reference Parent and Dafir1992) are among the methods used to diagnose nutrient imbalances in crops. Both methods take nutrient interactions into consideration. DRIS is based on dual ratios of nutrients, while CND is based on row-centered log ratios where each nutrient is adjusted to the geometric mean of all nutrients and to a filling value (Rd).
The DRIS norms for diagnosing nutrient imbalances have been developed for Arabica (e.g. Farnezi et al., Reference Farnezi, Silva and Guimarães2009) and Robusta coffee (e.g. Partelli et al., Reference Partelli, Vieira and Martins2006) in South America. The DRIS and CND norms specific to Arabica and Robusta coffee in Africa do not exist. Although critical nutrient levels determined from data collected from some African countries exist (Harding et al., Reference Harding, Malavolta, Samper, Snoeck, Krishnamurthy Rao, Danimihardja, Robinson and Wichmann1992), studies on nutrient imbalances in coffee in Uganda have been based on soil fertility status, symptoms of nutrient deficiencies in plants (e.g. Esilaba et al., Reference Esilaba, Byalebeka, Delve, Okalebo, Ssenyange, Mbalule and Ssali2005), fertiliser trials (e.g. Stephens, Reference Stephens1967) and soil nutrient balances (e.g. Wortmann and Kaizzi, Reference Wortmann and Kaizzi1998), and not on foliar nutrient mass fractions.
The objectives of this study were (i) to derive and compare the CND and DRIS norms for Arabica and Robusta coffee, and (ii) to investigate the significance and direction of nutrient interactions using data derived from a wide range of agro-ecologies in Uganda. The norms will be compared with those developed in previous studies. Nutrient interactions will be investigated using principal component analysis (PCA).
MATERIALS AND METHODS
Study area
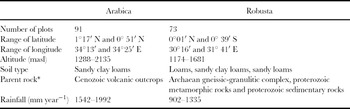
The study was conducted in 164 plots in the Arabica growing region around Mt. Elgon in east Uganda and Robusta growing region in west Uganda in 2006–2007 (Table 1). Agriculture is rainfed and the East African Meteorological Department (1963) generalised the rainfall pattern as bimodal with the highest rainfall from March to May and September to November.
Location and characteristics of Arabica and Robusta coffee growing regions.

*Source: Schlüter (Reference Schlüter2008).
The study was conducted in 41 Arabica mono-crop, 50 Arabica–banana intercrop, 39 Robusta mono-crop and 34 Robusta–banana intercrop fields. Among the selected plots, 15 Arabica mono-crops, 20 Arabica intercrops, 22 Robusta mono-crops and 18 Robusta intercrops were plots that received N at a rate of 184 g tree−1 year−1, while the rest were control plots. Because of variability in coffee tree densities, the resulting amounts of fertiliser were 392 ± 97 (average ± standard deviation (SD)), 321 ± 94, 190 ± 28 and 156 ± 43 kg N ha−1 year−1 in Arabica mono-crops, Arabica intercrops, Robusta mono-crops and Robusta intercrops, respectively.
Data collection
A total of two to three visits were made to each plot, at intervals of four to six months, to collect data through measurements, observations and structured farmer interviews. Spacing between coffee trees was determined by measuring the distances from five randomly selected trees to the nearest four trees. Average population densities of coffee trees ha−1 were then estimated from average tree spacing. Farmers provided information on number of trees plot−1. Farmers estimated parchment yields of Arabica and ‘Kiboko’ (dried coffee cherries) yields of Robusta harvested, both in kg plot−1 year−1, during the study period. Yield tree−1 was calculated based on coffee yield plot−1 year−1 and tree population plot−1. As recommended for parchment coffee and dried coffee cherry in the International Coffee Agreement of 2007 (ICO, 2007), conversion factors of 0.8 and 0.5 were used for Arabica and Robusta, respectively, to convert kilogram of parchment and kiboko coffee to kilogram of green coffee.
Using the sampling method recommended by FAO (2006), eight to 10 trees were randomly selected and 20 pairs of leaves were picked from each tree at mid-height. Analytical methods used are described by Okalebo et al. (Reference Okalebo, Gathua and Woomer2002). Total N was assessed colorimetrically after Kjeldahl digestion with sulphuric acid, and selenium as a catalyst. Available P and extractable cations (K, Ca and Mg) were extracted using the Mehlich-3 extraction solution (Mehlich, Reference Mehlich1984), P was measured colorimetrically using the molybdenum blue method, K was measured using a flame photometer, while the other cations were determined using an atomic absorption spectrophotometer.
Analytical approach
Although nutrient mass fractions in high-yield sub-populations for Arabica have been known to differ between seasons (Partelli et al., Reference Partelli, Vieira, Carvalho and Filho2007), it was assumed that the data of this study could be used because these were averages of samples taken at several times over a period of one year.
The selection of the high-yield sub-population and the calculation of CND norms were based on the methods outlined by Khiari et al. (Reference Khiari, Parent and Tremblay2001a), which have been used for crops such as sweet corn (Khiari et al., Reference Khiari, Parent and Tremblay2001b), potato (Khiari et al., Reference Khiari, Parent and Tremblay2001c) and banana (Wairegi and van Asten, Reference Wairegi and van Asten2011). Row-centered log ratios, denoted as V x for nutrient X, are computed for nutrients and Rd, where d is the number of nutrients under consideration, as outlined by Parent and Dafir (Reference Parent and Dafir1992). The observations are ranked in a decreasing yield order, and the yield cut-off computed is based on the Cate–Nelson procedure (Khiari et al., Reference Khiari, Parent and Tremblay2001a). The highest yield cut-off value among nutrients and the Rd computations can then be selected as the lowest yield in the high-yield sub-population.
Means for yield and foliar nutrient mass fractions in the high-yield sub-populations were compared between the two coffee types using the t-test for independent samples.
The CND norms (means and standard deviations of row-centered log ratios) were computed based on the high-yield sub-population, while the CND indices and nutrient imbalance indices (CND r 2) were computed for both low- and high-yield sub-populations (Khiari et al., Reference Khiari, Parent and Tremblay2001a). For each nutrient, means for row-centered log ratios in the high-yield sub-populations were compared between the two coffee types using the t-test for independent samples. The DRIS norms were computed based on the high-yield sub-population, while the indices and nutrient imbalance indices (NII) (the sum of absolute values of separate nutrient indices) were computed for both low- and high-yield sub-populations (Walworth and Sumner, Reference Walworth and Sumner1987). Relationships between CND and DRIS were explored using regressions. The coefficient of determination (R 2) depicted the closeness of this relationship.
Since PCA was easier to interpret for row-centered log ratios than for DRIS indices (Parent et al., Reference Parent, Isfan, Tremblay and Karam1994), it was performed on row-centered log ratio nutrient values for both low- and high-yield sub-populations to further explore nutrient interactions. To obtain maximum relationships between standardised variables, the principal components (PCs) were varimax-rotated (Vandamme et al., Reference Vandamme, Scheys and Lamberts1978). PCs showing eigenvalues ≤ 1 were considered non-significant (Guttman, Reference Guttman1954) and were not considered further. The PC loadings having values greater than the selection criteria (SC) were given significance. The selection criterion was calculated as follows (Ovalles and Collins, Reference Ovalles and Collins1988):
SC = 0.5/(PC eigenvalue)0.5.
Selection of high-yield sub-population was carried out using Microsoft Office Excel 2003. The t-tests, calculation of norms and indices, regression and PCA analyses were carried out using SPSS for Windows, release 11.0.0, standard version (SPSS Inc., Chicago, IL, 1989–2001).
RESULTS
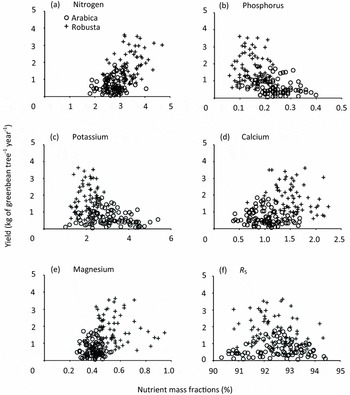
Yield ranged from 0.1 to 1.8 kg tree−1 for Arabica and from 0.5 to 3.6 kg tree−1 for Robusta (Figure 1). Foliar N, P, K, Ca, Mg and R 5 of Arabica ranged from 1.82–4.05%, 0.11–0.40%, 1.03–5.40%, 0.38–1.69%, 0.26–0.53% and 90.33–94.42%, respectively, and those of Robusta from 2.32–4.70%, 0.06–0.25%, 1.26–3.06%, 0.66–2.25%, 0.28–0.95% and 90.81–94.32%. As nutrient mass fractions increased, there was a gradual increase in the maximum reported yield, until a peak was reached. Further increases in nutrient mass fractions subsequently led to a gradual decrease in maximum yield.
Relationship between foliar nutrient mass fractions (%) and coffee yield (kg tree−1 year−1).

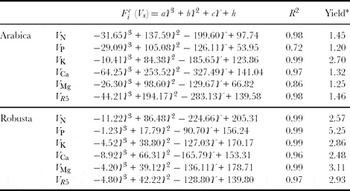
For both Arabica and Robusta, the relationship between cumulative variance function and yield tree−1 was cubic (figure not presented). The highest inflection points (−b/3a) were 2.7 (V K) and 5.25 (V P) for Arabica and Robusta, respectively (Table 2). However, although the theory of CND recommends that the highest inflection point be used to partition the low-yield sub-population from the high-yield sub-population, the populations, 1.20 kg and 2.48 kg, which were the lowest inflection points for Arabica and Robusta, respectively, were used. This allowed for the inclusion of 12.1% and 20.5% of all observations for Arabica and Robusta, respectively, in the high-yield sub-population. García-Hernández et al. (Reference García-Hernández, Valdez-Cepeda, Murillo-Amador, Beltrán-Morales, Ruiz-Espinoza, Orona-Castillo, Flores-Hernández and Troyo-Diéguez2006) partitioned their data below the highest inflection point because the point was above the data range.
Cumulative variance function [Fic(Vx)] for row-centered ratios and yield (kg of green bean tree−1 year−1) at point of inflection for Arabica and Robusta coffee.

*Yield at inflection point = −b/(3a).
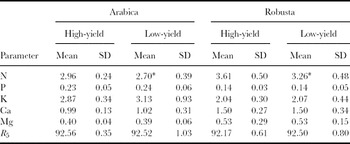
For both Arabica and Robusta, high-yield sub-population had significantly higher (p < 0.05) N compared with low-yield sub-population (Table 3). Average mass fractions of other nutrients did not differ significantly (p < 0.05) between the two sub-populations. For high-yield sub-population, Robusta coffee had significantly higher (p < 0.001) N, Ca and Mg and lower (p < 0.001) P and K than Arabica coffee.
Means and standard deviations (SD) of nutrient mass fractions (%) for high- and low-yield sub-population for Arabica and Robusta coffee.

*Significant difference (p < 0.05) between high- and low-yield sub-populations of the same coffee type.
The means for all nutrient mass fractions and filling value, for high-yield subpopulation, differ significantly (p < 0.05) between coffee types.
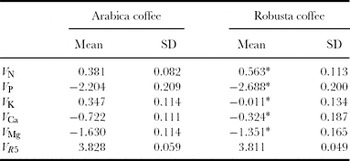
The CND norms, i.e. means and standard deviations, of V N, V P, V K, V Ca, V Mg and VR 5 for high-yield sub-populations are presented in Table 4. Arabica had significantly (p < 0.001) lower V N, V Ca and V Mg and higher (p < 0.001) V P and V K means than Robusta. The means for VR 5 did not differ significantly (p < 0.05) between the two coffee types. These norms were used to estimate nutrient indices for N, P, K, Ca, Mg, R 5 and CND r 2 values.
Compositional nutrient diagnosis (CND) norms expressed as means and standard deviations (SD) of row-centered log ratios for Arabica and Robusta coffee, for d = 5 nutrients.

*Significant difference (p < 0.001) between coffee types for a nutrient.
All nutrient ratios for high-yield sub-populations, except Mg/N, N/Mg, P/K, K/P, Ca/Mg and Mg/Ca, differed significantly (p < 0.05) between the two coffee types (data not presented). Nutrient ratios for P/N, K/N and Ca/N in Arabica coffee, and K/N in Robusta coffee were significantly higher (p < 0.05) in low-yield sub-population than in high-yield sub-population.
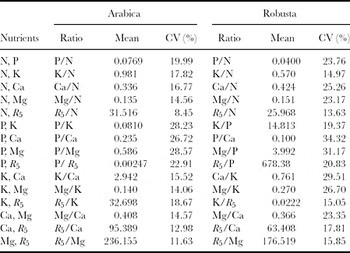
The DRIS norms, i.e. means and CVs of the selected nutrient ratios, for high-yield sub-populations for both coffee types are presented in Table 5. These norms were used to calculate nutrient indices and nutrient imbalance indices.
Diagnosis and Recommendation Integrated System (DRIS) norms for dual ratios from five nutrients in high-yield sub-populations for Arabica and Robusta coffee.

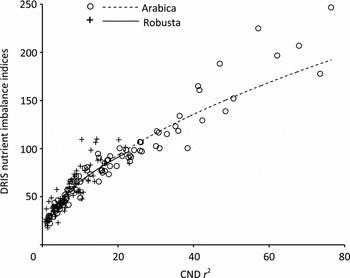
All regressions relating CND to DRIS indices were linear for all nutrients (data not presented). The R 2 for regressions ranged between 0.97 and 0.99 for Arabica, and 0.75 and 0.99 for Robusta. The regression lines relating nutrient imbalance indices for DRIS (NII) to CND r 2 suggested ‘power’ relationships with R 2 of 0.95 and 0.76 for Arabica and Robusta, respectively (Figure 2).
Relationship between CND r 2 and Diagnosis and Recommendation Integrated System (DRIS) nutrient imbalance indices (NII). The dotted and continuous lines are regression lines for Arabica and Robusta, respectively, with R 2 of 0.95 and 0.76, respectively.

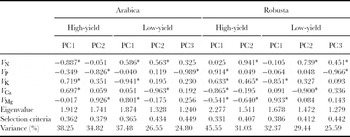
The significant PCs identified in each PCA conducted for high- and low-yield sub-populations had eigenvalues adding up to 3.653 and 4.442, respectively, explaining 73.07% and 88.83% of total variance for Arabica (Table 6). For Robusta, high- and low-yield sub-populations had eigenvalues adding up to 3.788 and 4.429, respectively, explaining 76.58% and 87.40% of total variance. For both high- and low-yield sub-populations in the two coffee types, the five nutrients had significant loadings in at least one PC.
Parameters of principal component analysis (PCA) derived from row-centered log ratios of high- and low-yield sub-populations of Arabica and Robusta coffee in Uganda.

*Significant loading.
DISCUSSION
The higher N, Ca and Mg and lower P and K in the reference population for Robusta compared with Arabica (Table 3) justify the need to develop separate norms for the two coffee types. This is further supported by differences in CND norms (Table 4), nutrient ratios and correlations in nutrient ratios (Table 6) between the two coffee types. The difference in the highest coffee yields attained (1.8 kg tree−1 for Arabica and 3.6 kg tree−1 for Robusta; Figure 1) and the difference in the coffee yields used to identify the reference populations (1.20 and 2.48 kg of green coffee tree−1 for Arabica and Robusta coffee, respectively; Table 2) also seem to support the need for cultivar-specific norms.
Differences in nutrient concentrations between the two coffee types have been also reported in other studies. The higher N than K for Robusta (59%) but not Arabica (–3%) is in agreement with observations made in other studies on coffee. In the literature reviewed by the International Fertilizer Industry Association (IFA) (1992), N was much higher than K in coffee leaf litter for Robusta than Arabica (78% vs. 3%). The higher K in Arabica than Robusta (2.87% vs. 2.04%) could be partially due to higher extractable K in soil in Arabica region than in Robusta region (1.49 vs. 0.83 cmolc kg−1) (data not presented). However, foliar N was greater in Robusta than Arabica but total soil N was greater in Arabica region than Robusta region (0.21% vs. 0.17%). The difference in rainfall between the two regions (1542–1992 mm year−1 and 902–1335 in Arabica and Robusta growing regions, respectively) could have also contributed to differences in nutrients in leaves between the two regions. Studies on banana have reported relationships between foliar nutrients and rainfall amount (Smithson et al., Reference Smithson, McIntyre, Gold, Ssali, Night and Okech2004) and distribution (Ssali et al., Reference Ssali, McIntyre, Gold, Kashaija and Kizito2003). Hence, norms developed under one set of conditions may not be applicable for other conditions (Reis and Monnerat, Reference Reis and Monnerat2002).
The DRIS norms derived in this study (Table 5) are not in full agreement with those derived elsewhere. For example, the population used to derive norms for Arabica by Arizaleta et al. (Reference Arizaleta, Rodriguez and Rodriguez2002) had lower K (1.35%) and higher Ca (1.94%) than the high-yield sub-population in our study (2.87% and 0.99% for K and Ca, respectively) but N, P and Mg showed less variation (N, P and Mg were 3.23%, 0.15% and 0.47%, respectively in that study, and 2.96%, 0.23% and 0.40%, respectively in our study). Also, compared with our study, the sub-population used to derive norms for Robusta by Partelli et al. (Reference Partelli, Vieira and Martins2006) had lower N (2.76% vs. 3.61%), K (1.67% vs. 2.04%) and Mg (0.35% vs. 0.53%), while other nutrients showed less difference (P and Ca averaged 0.16% and 1.35%, respectively in that study, and 0.14% and 1.50%, respectively in our study).
Close relationship between CND and DRIS norms (Figure 2) suggests that differences between both approaches are minimal. This close relationship has been reported in studies on annual crops, for example on tomato (Parent et al., Reference Parent, Karam and Visser1993), carrot (Parent et al., Reference Parent, Isfan, Tremblay and Karam1994) and sweet corn (Khiari et al, Reference Khiari, Parent and Tremblay2001b), as well as on banana (Wairegi and van Asten, Reference Wairegi and van Asten2011), a perennial. The two approaches, therefore, seem equally good in diagnosing nutrient imbalances.
The negative N–K interactions in both high- and low-yield sub-populations for Arabica, N–Ca interactions in both sub-populations for Arabica and low-yield sub-population for Robusta, and N–Mg interactions in high-yield sub-population for Robusta, suggested by the PCA (Table 6), could be due to greater uptake of N as NH4+ than NO3−. For example, interactions between N and K tend to be negative and for NH4+ form and positive for NO3− form of N (Zhang et al., Reference Zhang, Niu, Zhang, Chen, Li, Yuan and Xie2010). Supplying NH4+ rather than NO3− can cause deficiency in Ca and Mg (Haynes and Goh, Reference Haynes and Goh1978). The negative K–Mg interactions in both sub-populations for both coffee types and K–Ca interactions in the high-yield sub-population of Robusta could have been due to competition for entry into plants among cations (White, Reference White and Marschner2012). However, it is difficult to explain positive Ca–Mg interactions in Arabica coffee.
Antagonism between K and Mg in coffee has been reported by Harding et al. (Reference Harding, Malavolta, Samper, Snoeck, Krishnamurthy Rao, Danimihardja, Robinson and Wichmann1992) and Paulo and Furlani (Reference Paulo and Furlani2010). Increased deficiency of Ca and Mg in coffee leaves of Robusta on application of NPK fertiliser (Ojeniyi, Reference Ojeniyi1985) suggests possible negative interactions between the fertiliser and Ca and Mg. Also, studies on other crops have reported antagonism between N and K (e.g. García-Hernández et al., Reference García-Hernández, Valdez-Cepeda, Murillo-Amador, Nieto-Garibay, Beltrán-Morales, Magallanes-Quintanar and Troyo-Diéguez2004; Pietz et al., Reference Pietz, Peterson, Hinsely, Ziegler, Redborg and Lue-Hing1982), P and Mg and P and Ca, and positive relation between Ca and Mg (García-Hernández et al., Reference García-Hernández, Valdez-Cepeda, Murillo-Amador, Nieto-Garibay, Beltrán-Morales, Magallanes-Quintanar and Troyo-Diéguez2004, Reference García-Hernández, Valdez-Cepeda, Murillo-Amador, Nieto-Garibay, Beltrán-Morales, Magallanes-Quintanar and Troyo-Diéguez2006).
Lack of uniformity in nutrient norms (Table 4) and nutrient interactions (Table 6) between the two coffee types suggests that fertiliser requirements for the two coffee types could differ. The negative interaction between N and K for Arabica (Table 6) could be of special importance because compared with other nutrients N and K are taken in large quantities (Harding et al., Reference Harding, Malavolta, Samper, Snoeck, Krishnamurthy Rao, Danimihardja, Robinson and Wichmann1992). Despite the importance of K, fertiliser recommendations for Robusta coffee in Uganda suggest use of N (UCDA, 2009a) and do not include other nutrients. Although recommendations for Arabica suggest use of a compound fertiliser containing 15%, 6% and 12% of N, P and K, respectively (UCDA, 2009b), ranking of nutrient indices for each plot (data not presented) suggest that the most limiting nutrients differed among plots. Also, it is likely that some yields may have been limited by constraints other than nutrients under consideration. Hence, fine-tuning these recommendations to address the most limiting deficiencies, and ensuring that other growth factors are not limiting, could make use of fertiliser more beneficial.
CONCLUSIONS
Comparison of nutrient mass fractions between Arabica and Robusta coffee justified the need for use of cultivar-specific norms in diagnosing nutrient imbalances in coffee. Close relationship between nutrient imbalances derived using the DRIS and CND norms indicated that both approaches were equally good in diagnosing nutrient imbalance. Nutrient interactions suggest that basing fertiliser recommendations on nutrient imbalances diagnosed using DRIS or CND can increase productivity of Arabica and Robusta coffee profitably. Lack of uniformity in both nutrient norms and nutrient interactions between Arabica and Robusta coffee strongly indicates that nutrient requirements differ for the two coffee types. Differences in growth conditions and nutrient norms for the two coffee types suggest that diagnosing nutrient imbalances can be improved by using localised nutrient norms. Interactions between major nutrients clearly demonstrate the need to take into consideration nutrient interactions when using fertiliser to target nutrient deficiencies. The norms presented in this study may not only be important in Uganda but may also be important in other East African countries (e.g. Rwanda, Tanzania, Kenya and Burundi), where coffee is a major cash and export crop, especially for conditions similar to those under which the norms presented in this study were developed. Investing in research aimed at addressing nutrient requirements in coffee would obviously increase coffee production. This would improve the economies of the East African countries through increase in coffee exports and foreign currency earnings.
Acknowledgements
The authors are grateful to the host farmers on whose plots the data were collected. We also thank David Mukasa for support with data collection, Symon Wandiembe for suggestions and support with some statistical aspects of this paper, National Agricultural Research Organization (NARO) for laboratory analysis of soil and foliar samples and Godfrey Taulya for support with quality maintenance of laboratory results. This research was funded by USAID through Agricultural Productivity Enhancement Program (APEP).