Advancing paternal age has been identified as a risk factor for (neuro)psychiatric disorders, such as schizophrenia (Malaspina et al., Reference Malaspina, Harlap, Fennig, Heiman, Nahon and Feldman2001; Miller et al., Reference Miller, Messias, Miettunen, Alaraisanen, Jarvelin and Koponen2010), bipolar disorder (Frans et al., Reference Frans, Sandin, Reichenberg, Lichtenstein, Langstrom and Hultman2008; Menezes et al., Reference Menezes, Lewis, Rasmussen, Zammit, Sipos and Harrison2010), and autism spectrum disorders (Hultman, Sandin, Levine, Lichtenstein, & Reichenberg, Reference Hultman, Sandin, Levine, Lichtenstein and Reichenberg2010; Lundstrom et al., Reference Lundstrom, Haworth, Carlstrom, Gillberg, Mill and Rastam2010; Reichenberg et al., Reference Reichenberg, Gross, Weiser, Bresnahan, Silverman and Harlap2006). For example, compared to offspring of men aged 25–29, offspring of men aged 50 or older have a relative risk of 1.66 of being diagnosed with schizophrenia (Miller et al., Reference Miller, Messias, Miettunen, Alaraisanen, Jarvelin and Koponen2010). Further, advancing paternal age negatively affected general social abilities in a controlled study on mice (Smith et al., Reference Smith, Kember, Mill, Fernandes, Schalkwyk and Buxbaum2009). Human studies also suggest that advancing paternal age is associated with poorer social skills (Weiser et al., Reference Weiser, Reichenberg, Werbeloff, Kleinhaus, Lubin and Shmushkevitch2008) and performance in intelligence tests (Malaspina et al., Reference Malaspina, Reichenberg, Weiser, Fennig, Davidson and Harlap2005). There is an association between psychiatric disorders and violence (e.g., Arseneault, Moffitt, Caspi, Taylor, & Silva, Reference Arseneault, Moffitt, Caspi, Taylor and Silva2000; Bo, Abu-Akel, Kongerslev, Haahr, & Simonsen, Reference Bo, Abu-Akel, Kongerslev, Haahr and Simonsen2011). To date, there have been no studies on the possible effects of advancing paternal age on offspring criminality.
The main causal hypothesis to explain these associations is mutational errors (point mutations, copy number variations, and chromosome breakage; Crow, Reference Crow1999) in spermatogenesis that accumulate as males age. In humans most new mutations originate in the male germ line (Crow, Reference Crow1999). This is because males' germ cells undergo a greater number of divisions than females'; females' germ cells undergo 24 divisions whereas males' continuously divide during life at approximately 20–30 divisions per year, resulting in approximately 600 divisions by the age of 40 (Crow, Reference Crow1999). At each cell division there is a probability of new mutations; therefore, the number of new mutations is likely to increase with the fathers' age at conception. Other biological explanations, such as faulty epigenetic regulation, have also been suggested (Perrin, Brown, & Malaspina, Reference Perrin, Brown and Malaspina2007). We use the phrase “de novo mutations” to collectively refer to these effects. Rare copy number variants have been associated with schizophrenia (Sebat, Levy, & McCarthy, Reference Sebat, Levy and McCarthy2009), and there is support for de novo mutations' involvement in sporadic cases of schizophrenia (Xu et al., Reference Xu, Roos, Levy, van Rensburg, Gogos and Karayiorgou2008) as well as autism (Sebat et al., Reference Sebat, Lakshmi, Malhotra, Troge, Lese-Martin and Walsh2007). An alternative plausible explanation for the association between advancing paternal age and psychosocial functioning is that males who have children at later ages also carry risk factors for mental illness (see, e.g., Petersen, Mortensen, & Pedersen, Reference Petersen, Mortensen and Pedersen2011).
Schizophrenia and bipolar disorder have substantial polygenic components where many variants contribute (Purcell et al., Reference Purcell, Wray, Stone, Visscher, O'Donovan and Sullivan2009); similar results have recently been found for human intelligence (Davies et al., Reference Davies, Tenesa, Payton, Yang, Harris and Liewald2011). If the de novo mutations hit the genome relatively randomly, it is plausible that these mutations affect one or many of these genes. Thus, de novo mutations might negatively affect general cognitive functioning and possibly lead to more severe effects such as mental illnesses and/or violent crime. Further, there is a general genetic susceptibility for so-called externalizing syndromes such as conduct disorder, adult antisocial behavior, and substance abuse/dependence (Kendler, Prescott, Myers, & Neale, Reference Kendler, Prescott, Myers and Neale2003). In addition, common genes and/or shared environment account for some of the associations among schizophrenia, substance abuse, and violent criminal convictions (Fazel, Langstrom, Hjern, Grann, & Lichtenstein, Reference Fazel, Langstrom, Hjern, Grann and Lichtenstein2009) and among bipolar disorder, substance abuse, and violent criminal convictions (Fazel et al., Reference Fazel, Lichtenstein, Frisell, Grann, Goodwin and Langstrom2010; Fazel, Lichtenstein, Grann, Goodwin, & Langstrom, Reference Fazel, Lichtenstein, Grann, Goodwin and Langstrom2010). In sum, because there is an association between mental illnesses and violent crime and this association is at least partly due to common genes, if the de novo mutation hypothesis is correct, there is reason to suspect that there is an association between paternal age and violent criminality.
Early risk factors for antisocial behavior, such as teenage childbearing and adverse fetal environment, have been thoroughly researched, indicating that biological as well as early social factors influence both onset and persistence of antisocial behavior (for an overview, see, e.g., Dodge & Pettit, Reference Dodge and Pettit2003). However, most of the evidence for those risk factors relies on studies of nonrelated individuals (i.e., they are between-family effects). Numerous researchers have noted that strong causal inferences from studies on early risk factors for antisocial behavior requires study designs that investigate if associations are confounded by factors shared within families (D'Onofrio, Rathouz, & Lahey, Reference D'Onofrio, Rathouz, Lahey, Kendler, Jaffee and Romer2011; Fergusson, Reference Fergusson1999; Lahey & Waldman, Reference Lahey, Waldman, Lahey, Moffitt and Caspi2003; Moffitt, Reference Moffitt2005; Rutter, Reference Rutter2007; Thapar & Rutter, Reference Thapar and Rutter2009). This is also consistent with arguments for using rigorous tests of causal inferences in the medical and social sciences (Academy of Medical Sciences Working Group, 2007; Shadish, Cook, & Campbell, Reference Shadish, Cook and Campbell2002). Criminality runs in families (Farrington, Coid, & Murray, Reference Farrington, Coid and Murray2009; Frisell, Lichtenstein, & Langstrom, Reference Frisell, Lichtenstein and Langstrom2011; Frisell, Pawitan, Langstrom, & Lichtenstein, Reference Frisell, Pawitan, Langstrom and Lichtenstein2011), indicating that factors shared within families are responsible for at least part of an individual's criminal propensity. These familial factors might not be measurable (e.g., genetic predisposition), might be impractical to measure for large-scale studies (e.g., emotional neglect during toddlerhood), or may not have been identified yet. Thus, informative research on the association between paternal age at childbearing and offspring antisocial behavior needs to use design features that account for such unmeasured factors.
One study design that could help rule out genetic and environmental familial confounds when exploring early risk factors, such as advancing paternal age, is the comparison of differentially exposed siblings (Donovan & Susser, Reference Donovan and Susser2011; Lahey & D'Onofrio, Reference Lahey and D'Onofrio2010; Rutter, Reference Rutter2007). This design includes multiple levels of analysis information specific to each offspring (e.g., the father's precise age at the conception of each child), as well as information shared by all siblings in the family. The design allows for adequate controlling for unmeasured factors shared by siblings, that is, factors stable across pregnancies. In other words, this approach diminishes bias due to factors that are highly correlated between siblings, for example, family socioeconomic status (SES) at childbirth. However, factors that are only weakly or not correlated between siblings, such as paternal age, are not controlled. To our knowledge, only two studies of advancing paternal age and offspring functioning have attempted to rule out familial confounding; one was on schizophrenia (Petersen et al., Reference Petersen, Mortensen and Pedersen2011) and another was on autism spectrum disorder (Hultman et al., Reference Hultman, Sandin, Levine, Lichtenstein and Reichenberg2010). Both studies found that advancing paternal age was statistically associated with increased offspring risk for illness, but the support specifically for the de novo mutation hypothesis was mixed. Hultman et al. found that advancing paternal age increases risk beyond age at first child, whereas Petersen et al. did not.
When studying causal influences on antisocial behavior, it is also critical to examine outcome heterogeneity. Several researchers have proposed different developmental trajectories of antisocial behavior with varying age of onset and severity (e.g., Farrington, Reference Farrington1992; Hinshaw, Lahey, & Hart, Reference Hinshaw, Lahey and Hart1993; Loeber, Reference Loeber, Lahey and Kazdin1988; Moffitt, Reference Moffitt1993; Patterson, DeBaryshe, & Ramsey, Reference Patterson, DeBaryshe and Ramsey1989; Quay, Reference Quay and Quay1987). It is important to note that current developmental trajectory theories assume that each type of antisocial behavior is differentially influenced by various causal risk factors. For instance, Moffitt's (1993) seminal paper has suggested that adolescence-limited and life-course persistent antisocial behavior might have different etiologies: the former is more socially driven (e.g., peer influences during adolescence), whereas the latter is more biologically determined (e.g., due to neurodevelopmental problems starting at an early age).
We used official records on criminal convictions to study the association between advancing paternal age and offspring violent offending. We used two outcomes: ever committing a violent crime and number of violent crimes. Further, we took advantage of information at multiple levels of analysis to discriminate between different developmental trajectories. We had access to repeated measurements within each individual, as well as multiple assessments within each family, which allowed estimation of a model for both indices of violent offending and sibling comparison analysis to account for familial confounding. Our aims were (a) to study the effects of advancing paternal age on offspring violent crime and (b) to evaluate if the effects were congruent with a causal effect or attributble to familial confounding.
Methods
Databases
We linked several nationwide, longitudinal registries maintained by Swedish government agencies using the unique personal identification number given to all Swedish citizens. We obtained official data on criminal convictions for 1973–2004 from the National Crime Register (held by the National Council for Crime Prevention), and we identified diagnoses of mental illness from the Hospital Discharge Register (National Board of Health and Welfare). The Multi-Generation Register (Statistics Sweden) was used to link individuals to their parents. We obtained household SES from the 1960, 1970, and 1980 National Censuses (Statistics Sweden). The Total Population Register (Statistics Sweden) provided information on gender, birth country, and birth date. The birth date information had monthly resolution and was used to assess age for probands and their parents. We used the Cause of Death and Migration Registers (Statistics Sweden) to handle attrition and calculate time at risk.
Eligibility
Our cohort consisted of individuals born from 1958 through 1979 and who were alive and living in Sweden when reaching 15 years of age, the age of criminal responsibility in Sweden. We also required that the participants' parents were identifiable through the Multi-Generation Register. A total of 3,016,637 individuals born from 1958 to 1979 lived in Sweden according to the Total Population Register; 533,134 (17.7%) of these did not have two identifiable parents in the Multi-Generation Registry (primarily immigrants) and were thus excluded from the study. Another 119,986 individuals (4.0%) were excluded for not living in Sweden when turning 15. Finally, 3,596 individuals (0.1%) were excluded because of inconsistent data on emigration/immigration and/or death date. There were 2,359,921 individuals who remained in the study.
Measures
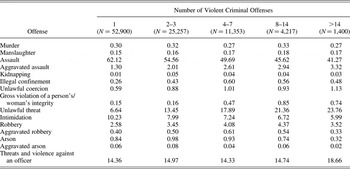
The exposure variable, paternal age at childbirth, was defined as the difference between the father's birth date and the child's birth date. Because birth dates were available by the month, the resulting resolution for paternal age was also in months. Paternal age ranged from 13.5 to 80.4 years (mean = 30.0, 98% were within 19.3–48.9 years). The National Crime Register provided data on violent criminality based on all convictions in the Swedish lower general courts between January 1, 1973, and December 31, 2004. Each conviction may include one or more crimes, each with its own offense code. We linked all convictions to individuals within our study population and defined each crime as violent or nonviolent. Violent crimes included murder, manslaughter, infanticide, assault, kidnapping, illegal confinement, unlawful coercion, gross violation of a person's/woman's integrity, unlawful threat, intimidation, robbery, arson, and threats and violence against an officer (Frisell, Lichtenstein, et al., 2011). Attempted and aggravated versions of offenses were also included whenever applicable. For each individual we considered two outcome measures: (a) ever committed a violent crime and (b) number of violent crimes committed. To elucidate the difference between persistent and less persistent violent offenders, we tabulated the prevalence of various violent crime types stratified by different levels of persistence. The distribution between the different levels of recidivism types did not differ substantially (Table 1). We also used nonviolent crimes in sensitivity analyses. Nonviolent crimes were all crimes not defined as violent crimes.
Percentage of types of violent crimes in Sweden in 1973–2004 among violent offenders born in 1958–1979, by number of violent crimes

Note: Cells represent the percentages of the violent subtype among the total number of offenses. Infanticide was excluded because of too few observations.
We included maternal age at childbirth and child gender as covariates. Based on the Censuses, we also included a measure of SES when the child was between 5 and 15 years old, which was derived from parental occupation and coded into three classes: low (skilled and unskilled workers across all fields), medium (low- and intermediate-position white collar workers) and high (high-position white collar workers and self-employed professionals and entrepreneurs; Frisell, Lichtenstein, et al., 2011). For parity we compared firstborn by mother to later born. We used official crime statistics to construct a dichotomous variable reflecting any paternal conviction from 1973 to 2004 and included a dichotomous variable indicating if the father was born in Sweden. Finally, we constructed a dichotomous variable on whether individuals had a half-sibling. None of the covariates had missing values except for SES (missing rate = 6.6%). However, missing SES data could arise in two different ways: either not answering the census questionnaire or not residing in Sweden at the time of the census. Because answering the censuses was enforced by law, nonanswering might indicate a more general pattern of breaking of social norms. Hence, we chose to use missing values for SES in the analyses because we judged them to be informative.
Because previous research has indicated a connection between paternal age and offspring mental illness, we investigated possible mediating effects of offspring psychiatric problems for the association between advancing paternal age and offspring violent convictions. We created two variables, both with diagnostic codes from the 8th–10th editions of the International Classification of Diseases (ICD): ever diagnosed with bipolar disorder (ICD-8 diagnostic codes 296.1, 296.3, and 296.8; ICD-9 diagnostic codes 296A, 296C, 296D, 296E, and 296W; ICD-10 diagnostic codes F30 and F31) or schizophrenia (ICD-8 and ICD-9 diagnostic code 295, ICD-10 diagnostic code F20) as recorded in the Hospital Discharge Register (1973–2004). These discharge diagnoses were assigned by the attending physician only if a person had been hospitalized overnight.
Statistical methods
Dealing with issues of truncation and censoring (i.e., identifying the time at risk for committing a criminal offense) were essential for the current study because all offspring had not lived through the entire risk period for being convicted of a violent crime. Migration and death were both taken into consideration by subtracting the time from death/first emigration until the end of follow-up from the individual's time at risk. We disregarded any convictions recorded after emigration. We also accounted for the time when convicted offenders were sentenced to incarceration. (We subtracted time as based on the current legislation for the Swedish Prison and Probation service that suggests that any incarceration up to 1 month is fully served whereas two-thirds of longer incarceration sentences are served; see Swedish Penal Code, chap. 26, sect. 6.) Another issue when addressing time at risk is that the risk of criminality differs depending on age (see, e.g., Moffitt, Reference Moffitt1993). More crimes are committed by younger individuals, causing the risk to commit crimes to be associated with age.
We opted for a so-called Poisson hurdle model, described by Min and Agresti (Reference Min and Agresti2005), which separately analyzes “ever being convicted of a violent crime” as a Bernoulli variable (i.e., 0 or 1) and “total number of violent crimes” (given being convicted at least once) as a truncated Poisson variable (i.e., a count greater than 0). In comparison with ordinary survival analysis (i.e., analyzing time until first violent criminal offense) or ordinary Poisson models (i.e., only analyzing the number of crimes), the Poisson hurdle model has three advantages:
1. It takes care of inflation/deflation of zeros in count data (compared to if the data came from an ordinary Poisson process).
2. The model allows us to capture information regarding multiple sentences, thereby providing a way to measure the persistence of criminality (compared to ordinary survival analyses).
3. It fits well with the notion of the etiological difference between ever being convicted and being convicted multiple times as an index of different developmental trajectories of antisocial behavior (Moffitt, Reference Moffitt1993).
The Poisson hurdle model
The model consists of two parts: a Bernoulli part modeling the probability of committing at least one crime, that is, to pass over the hurdle, and a truncated (at zero) Poisson part modeling the number of crimes committed, assuming that at least one has been committed. The first part can be turned around to say that we are modeling the probability to not commit any crimes. The distribution is thus

Here, p ij is the probability of committing (at least) one crime, and μij is the mean parameter in a Poisson distribution indicating the mean number of crimes committed for the ith individual within the jth family (cluster).
One useful property of the Poisson hurdle model is that we can fit each part separately because the likelihood involving p ij and μij is orthogonal (Min & Agresti, Reference Min and Agresti2005). Both parts of the Poisson hurdle model fit within the generalized linear model (GLM) framework.
We chose to model p ij using a complementary log–log link (cloglog) and μij using a log link:

Here, x1ij are covariates for the Bernoulli part and x2ij are covariates for the truncated Poisson part; these must not be the same because the different parts are fitted separately. The ω1ij and ω2ij are offset terms that model the risk over time. The reason for using the cloglog link is that one can view the Bernoulli part as modeling the complement of the probability of observing a zero in a Poisson model with a rate parameter, say λ, independent of the rate parameter in the truncated Poisson part, with a log link. Let Y ij ~ Poisson (ω1ijλij), and the log link log(λij) = x1ijTβ1, then
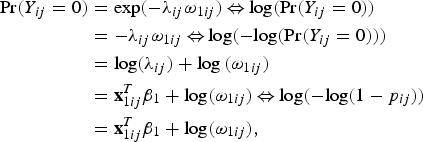
where 1 – p ij = Pr(Y ij = 0). This is reasonable because we view the number of violent criminal offenses as a type of counting process.
Estimation of risk over time
We chose to model the offset variable as ωkij = 1 + q kT ij, k = 1, 2, where T ij is the total time at risk for individual i within family j and q k are parameters estimated from the data (differing between the Bernoulli and truncated Poisson outcomes). By this we capture the elevated risk of being convicted for a violent criminal offense during adolescence (the 1 in the equation), but it allows for variability attributable to differing time at risk (the q kT ij in the equation). However, there are alternative ways of parameterizing the offset term; a standard approach within Poisson regression would be to treat the offset term as ωkij = T ij, which would be appropriate if we considered the risk to be constant over time. Another way is to use an empirical risk estimation from the incidences of criminal offenses per individuals' ages (i.e., 15, 16, … , 46 years). Yet another way to parameterize the offset would be to set it to 1 for all individuals. This would correspond to assuming that criminals committed their offenses quite early in life, and it would not capture variability due to different time at risk. Because we do not know the true shape of the offset term, we performed sensitivity analyses using these different approaches.
Familial confounding
One aim of this study was to take advantage of the multiple levels of the data and account for familial confounding by studying within-cluster/family effects (Begg & Parides, Reference Begg and Parides2003; Donovan & Susser, Reference Donovan and Susser2011; Lahey & D'Onofrio, Reference Lahey and D'Onofrio2010; Rutter, Reference Rutter2007), so we needed to handle clustering of data. We used a generalized estimation equation (GEE) approach to allow for the correlation between family members. Because we are using GEE, all inferences are on a population level. We explicitly modeled within-family effects by comparing the deviation of exposure for siblings from the family mean of exposure. This is in agreement with the de novo mutation hypothesis; the associations are due to new mutations, and these happen continuously over time. For the Bernoulli part we used PROC GLIMMIX in SAS software version 9.2 (for both GLM and GEE model fitting; SAS Institute, 2002–2008); for the truncated Poisson part we wrote an iterative reweighted least squares procedure (Pawitan, Reference Pawitan2001, pp. 394-398) in R (R Development Core Team, 2011) for GEE model fitting, and we used the hurdle function from the PSCL package in R (Zeileis, Kleiber, & Jackman, Reference Zeileis, Kleiber and Jackman2008) for fitting the GLM model. We used Wald-type tests for the significance in regression parameters, and in the GEE models we employed the robust variance estimator (sandwich estimator) for the tests.
Nonviolent crimes
We performed additional analyses on nonviolent crimes as the outcome. For violent crime we fit two main models per outcome measure (ever nonviolent crime and number of nonviolent crimes): a cohort analysis using the actual age in categories (GLM) and a within-family analysis using the deviation of paternal age from mean paternal age within the family (GEE).
Results
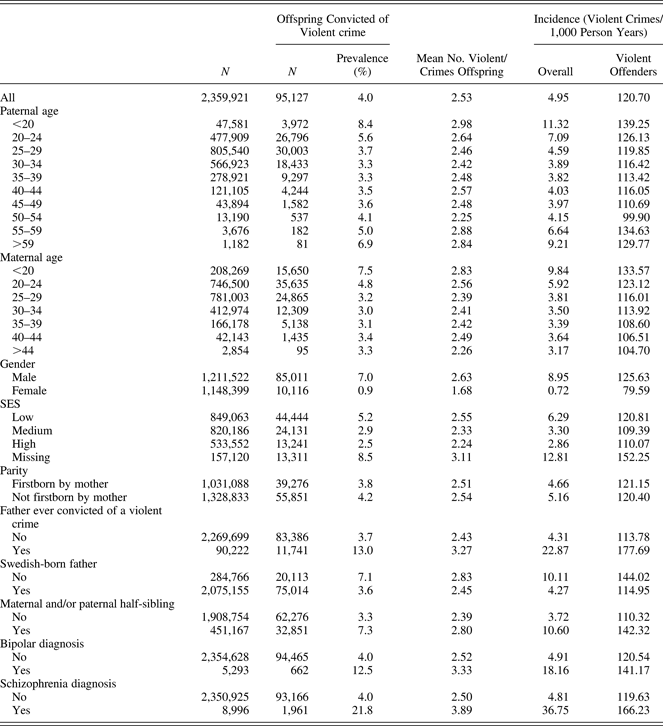
The total number of registered violent crimes in our cohort was 240,699. These were committed by 95,127 (4.0%) individuals (Table 2). The mean number of violent offenses for all violent offenders was 2.53. The incidence was 4.95 violent crimes per 1000 person-years in the general population and 120.70 for the subgroup of offenders.
Descriptive statistics for the study population of 2,359,921 individuals born in Sweden in 1958–1979 who were assessed for violent criminal offending
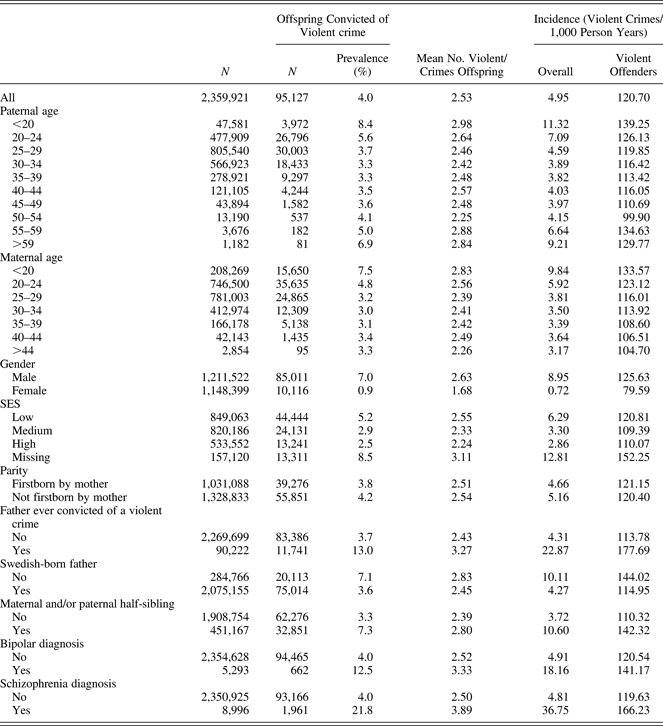
Note: Included are all covariates used in the analyses as well as schizophrenia and bipolar disorder.
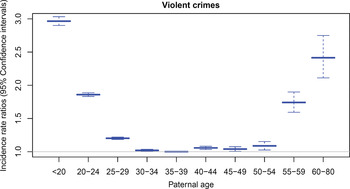
Parental age at childbearing did not have a linear association with the probability of ever committing a crime. The prevalence by paternal age groups went from 8.4% among offspring of fathers below age 20 to 3.3% for offspring of fathers aged 30–34 and 35–39, but it again increased to 6.9% among the oldest fathers (Table 2). This U-shaped pattern is also presented in Figure 1, which shows the incidence by paternal age.
Observed incidence rate ratios of offspring violent criminality as a function of paternal age. Paternal age 35–39 years constituted the reference category. [A color version of this figure can be viewed online at http://journals.cambridge.org/dpp]

Low maternal age had a association to violent crime similar to low paternal age; however, the prevalence in the older age categories did not increase as dramatically as for paternal age (Table 2). For example, the prevalence in age category >44 was only 3.3%, whereas the lowest prevalence of 3.0% was found in the maternal age category of 30–34. Males were much more likely to have committed a violent crime (7.0%) than females were (0.9%). For the SES variable, the missing category had the highest prevalence of offenders (supporting our decision to treat the category as a fixed effect) and then decreased through the low, medium, and high categories. Children who were firstborn (by mother) had a slightly lower prevalence of violent crime (3.8%) than those not firstborn (4.2%). Thirteen percent of children with fathers convicted of a violent criminal offense were themselves convicted, compared to 3.7% of children with fathers not convicted of a violent crime. Having a father not born in Sweden increased the probability of being convicted of a violent crime (7.1% vs. 3.6%) for children of Swedish fathers. Having a half-sibling increased the prevalence of violent criminality to 7.3% versus 3.3% in families with only full siblings. Being diagnosed with bipolar disorder or schizophrenia also increased the risk for violent offending (12.5% for bipolar disorder and 21.8% for schizophrenia) compared to the total population (4.0%), indicating relative risks consistent with previous research (see the systematic reviews in Fazel, Lichtenstein, Grann, et al., 2010; and Fazel et al., Reference Fazel, Langstrom, Hjern, Grann and Lichtenstein2009).
Cohort analyses
Ever committing a violent crime
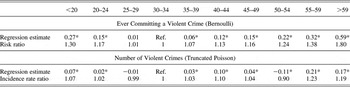
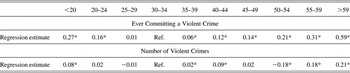
Table 3 displays the paternal age regression estimates from fitted GLMs; the estimated offset was ω1ij = 1 + 0.010T ij. Using 30–34 as a reference category and controlling for all of the covariates (except bipolar disorder and schizophrenia) in the Bernoulli model, paternal age still showed a U-shaped distribution resembling the observed pattern in Table 2; the risk decreased from fathers aged <20 to fathers aged 30–34, followed by a monotonic increase to the oldest age category. When converting the regression coefficient to risk ratios (i.e., the probability of committing a violent offense in the age category divided by the probability in the reference category using the values for the reference categories of the covariates), the risk for the offspring of the youngest fathers (<20 years) was increased by 30% compared to the offspring born to fathers aged 30–34; the risk among the oldest fathers (>59) was increased by 80%. In the models where the offset was treated differently and when controlling for birth period, the shape of the association generally persisted (Appendix A, Table A.1).
Parameter estimates for paternal age categories from cohort analyses using the Poisson hurdle model on 2,359,921 (Bernoulli analysis) and 95,127 (truncated Poisson analysis) individuals assessed for violent criminal offending

Note: Generalized linear model analyses for the two different outcomes adjusted for covariates (treating maternal age as categorical). Offset variable is modeled as 1 + q k × (time at risk). The estimates for “Ever Committing a Violent Crime” are changes per unit in offset for the regression on probability for committing at least one crime using the complementary log–log link. The risk ratio is the probability of committing a violent offense in each age category divided by the probability in the reference category (at the reference categories of the covariates). The estimates for “Number of Violent Crimes” are changes in the regression on the intensity per unit in offset of criminal offenses using the log link. The incidence rate ratio is the incidence rate in each category relative to the incidence rate in the reference category. Ref., reference category.
*p < 0.05.
Number of violent crimes
We proceeded to fit models for the truncated Poisson outcome variable (again with 30–34 years as the reference category; Table 3), the estimated offset was ω2ij = 1 + 0.093T ij. After controlling for the covariates, there was a decrease in the rate of violent crime from age category <20 to age category 25–29. In addition, there seemed to be an increase again after age 25–29, although it was not monotonic and not as clear as for the analyses concerning ever committing a crime. When converting the regression coefficient to incidence rate ratios (i.e., the incidence rate in each category relative to the incidence rate in the reference category), the risk for the offspring of the youngest fathers (<20 years) was increased by 7% compared to the offspring born to fathers aged 30–34 whereas the risk among children to the oldest fathers (>59) was increased by 19%. These observations were also found in the sensitivity analyses where the offset variable was treated differently and when we controlled for birth period (in 5-year intervals; Appendix A, Table A.2).
Maternal age
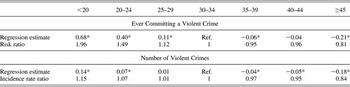
Maternal age did not exhibit the U-shape for offspring risk that paternal age did; instead, the effect was higher in younger maternal age categories and lower in older categories (Appendix A, Table A.3). This pattern was found for ever committing a violent crime and for number of crimes. In the Bernoulli analysis, the regression estimate went from 0.68 in the youngest age category (mothers aged <20 years) to –0.21 in the oldest age category (mothers aged >44 years), corresponding to risk ratios of 1.96 and 0.81, respectively. The figures for the truncated Poisson analysis were 0.14 and –0.18, with corresponding incidence rate ratios of 1.15 and 0.84. These results indicate that the higher risk due to increasing paternal age was not due to the correlation between paternal and maternal age; rather, maternal age may counteract advancing paternal age effects.
We conducted additional analyses stratified on schizophrenia or bipolar disorder diagnoses to elucidate if these diagnoses might mediate the association. If there was a strong mediation of the effect, and no strong confounder between mental illness and violent crime, we would expect a substantial change of the size of the association between paternal age and violent crime. However, the estimates did not change notably in the nonillness group (Appendix A, Table A.4).
In summary, our analyses show that there are significant associations of both young and old paternal age with criminality and that the associations are not attributable to either maternal age or severe psychiatric disorder.
Family-based analyses
Our second aim was to evaluate whether the effects of advancing paternal age were congruent with a causal effect or whether the association was due to familial confounding. We therefore continued with within-family analyses to test if observed patterns were also present among offspring of the same father. Here, the deviance in paternal age at childbirth for a sibling from the mean paternal age for all births within the paternal family was used in the GEE analyses.
Ever committing a violent crime
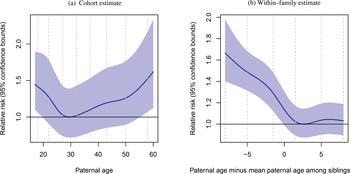
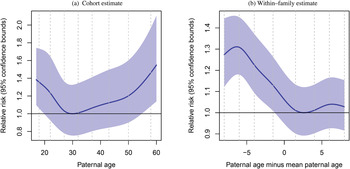
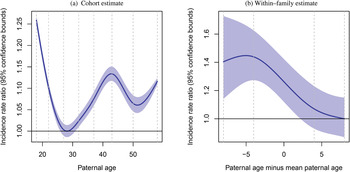
We restricted the data set to individuals with siblings (1,818,657 individuals). Figure 2b plots the fitted splines for the within-family effect; for comparative purposes we included a fitted spline on the cohort effect (i.e., the actual paternal age) in Figure 2a. In the within-family analysis the probability of ever committing a violent crime did not increase with advancing paternal age, but instead decreased (Figure 2b). This is in contrast to the results for the cohort analyses (Table 3, Figure 2a). We therefore conclude that the observed association between advancing paternal age and higher probability of ever committing a violent crime might not be causal. In contrast, the higher probability of committing a violent crime among offspring to younger parents might be causal. As seen in Figure 2b, the within-family effect is almost linear; fitting a linear effect yielded a regression coefficient of –0.039 (p < .0001) per year increase in paternal age.
Analyses for the probability of ever committing a violent crime (Bernoulli outcome). (a) Fitted natural spline from the cohort analysis (generalized linear model) with 95% confidence bounds with paternal age as exposure, and (b) the spline for the within-family effect (generalized estimation equation) with 95% confidence bounds based on the robust variance estimation. The exposure is the deviation of paternal age from mean paternal age within the family. The results were transformed to probabilities and divided by the lowest value in the age span (0.018 for cohort and 0.013 for within family). The vertical dashed lines are the knots in the splines. [A color version of this figure can be viewed online at http://journals.cambridge.org/dpp]

Number of violent crimes
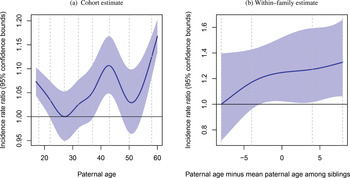
We proceeded to fit a GEE model for the truncated Poisson outcome. We restricted the analysis to individuals with siblings who also committed at least one violent offense (16,709 individuals). We used splines to evaluate the need to fit a nonlinear effect for the within-family effect. Figure 3b plots the fitted splines of within-family effect; for comparative purposes we included a fitted spline on the cohort effect in Figure 3a. The within-family effect was monotonically increasing, and we accepted that a linear effect could be fitted. The linear effect was 0.014, corresponding to an incidence rate ratio of 1.014 per year of paternal age that siblings differ (p = .0006 using the robust variance estimator). To exemplify, on a population level, assuming that two siblings commit violent crimes, at the same number of years at risk for siblings that differ 10 years in age, the younger sibling (i.e., born to an older father) has a mean number of committed crimes that is 1.15 of that of the older sibling. Thus, we conclude that there is an effect of advancing paternal age on the number of violent crimes committed by an offender that is not accounted for by familial confounding.
Analyses of the number of violent crimes committed by violent offenders (truncated Poisson outcome). (a) The fitted natural spline from the cohort analysis (generalized linear model) with 95% confidence bounds with paternal age as exposure, and (b) the spline for the within-family effect (generalized estimation equation) with 95% confidence bounds based on the robust variance estimation. The exposure is the deviation of paternal age from mean paternal age within the family. The results were transformed to rates and divided by the lowest value in the age span (2.10 for cohort and 0.37 for within family). The vertical dashed lines are the knots in the splines. [A color version of this figure can be viewed online at http://journals.cambridge.org/dpp]

Sensitivity analyses
We confirmed our result with a subset of siblings where fathers were aged over 30 and recalculated family mean and deviations according to the subsample (529,030 individuals for Bernoulli analysis and 4,025 individuals for truncated Poisson analysis). The within-family regression estimates were –0.044 (p < .0001) and 0.020 (p = .015) for the Bernoulli and truncated Poisson analyses, respectively. Similarly, we performed analyses with fathers who were under 30 (872,962 for Bernoulli and 8,844 for truncated Poisson); the regression estimates were –0.048 (p < .0001) and 0.019 (p = .036), respectively. Further, we performed additional analyses with a variable indicating if a person had any diagnosis of mental illness (schizophrenia or bipolar disorder), and the regression estimates did not change markedly (Bernoulli: –0.038, p < .0001; truncated Poisson: 0.015, p = .0004).
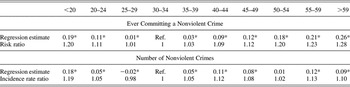
We also performed a set of analyses in which we defined the outcome variable to be nonviolent crimes (Appendix A, Table A.5, Figures A.1 and A.2). In the cohort analyses, we found a similar U-shaped association for both outcome variables. The within-family analyses of ever committing a nonviolent crime gave similar risk estimates compared to the analysis of ever committing a violent crime (Appendix A, Figure A.1b; linear effect regression coefficient = –0.022, p < .0001). The most notable finding was that there was no increase with advancing paternal age in the within-family analysis for the number of nonviolent crimes committed (Appendix A, Figure A.2b; linear effect regression coefficient = –0.032, p < .0001), indicating a different etiology compared to the number of violent crimes.
Discussion
Similar to studies of severe psychopathology (Frans et al., Reference Frans, Sandin, Reichenberg, Lichtenstein, Langstrom and Hultman2008; Hultman et al., Reference Hultman, Sandin, Levine, Lichtenstein and Reichenberg2010; Malaspina et al., Reference Malaspina, Harlap, Fennig, Heiman, Nahon and Feldman2001), we found that advancing paternal age at childbirth was also associated with increased risk of offspring violent criminality. The association of increasing paternal age and higher probability of ever committing a violent crime seemed to be attributable to familial confounding. In contrast, the association remained for the number of violent crimes when we controlled for familial confounding (i.e., in the within-family analyses), suggesting a causal effect. These results thus suggest a different etiology in ever committing a violent crime compared to persistence of violent offending (number of crimes), and it highlights the importance of considering heterogeneity in antisocial behavior. If the de novo mutation hypothesis is correct, then the effect of advancing paternal age on violent crime is biological; if life-course persistent criminality has a stronger biological etiology as claimed by Moffitt and others (Farrington, Reference Farrington1992; Hinshaw et al., Reference Hinshaw, Lahey and Hart1993; Loeber, Reference Loeber, Lahey and Kazdin1988; Moffitt, Reference Moffitt1993; Patterson et al., Reference Patterson, DeBaryshe and Ramsey1989; Quay, Reference Quay and Quay1987), we would expect the pattern of a larger effect on the number violent crimes than on committing any violent crime as found here.
Advancing paternal age and ever committing a violent crime
We found an association between advancing paternal age and offspring risk of ever being convicted of a violent offense. However, when we looked at within-family estimates of paternal age on the probability of committing at least one violent crime, the observed association for older fathers did not persist. We interpret this result as familial factors being responsible for the association. This result highlights the old mantra that association does not mean causation, and it shows the importance of conducting studies in which familial effects are accounted for to avoid incorrect interpretations of associational observations when predicting antisocial behavior (D'Onofrio et al., Reference D'Onofrio, Rathouz, Lahey, Kendler, Jaffee and Romer2011; Moffitt, Reference Moffitt2005).
Advancing paternal age and number of violent crimes
We concluded that advancing paternal age was causally associated with persistence: a higher rate of violent crimes among violent offenders. This is in agreement with earlier findings on the effect of advancing paternal age on offspring risk of mental illness such as schizophrenia (Malaspina et al., Reference Malaspina, Harlap, Fennig, Heiman, Nahon and Feldman2001) and bipolar disorder (Frans et al., Reference Frans, Sandin, Reichenberg, Lichtenstein, Langstrom and Hultman2008). Because this result persisted in within-family analyses, it is consistent with a causal effect. Our finding supports the de novo mutation hypothesis; new mutations in male germ cells might explain the increase in the number of violent crimes among children of older fathers. The monotonically increasing effect (Figure 3b) also supports that the association may arise from continuous accumulation of mutations in male germ cells with advancing paternal age. However, note that in this study we did not measure actual new mutations.
Heterogeneity in criminality
Current theories of developmental trajectories postulate that the trajectories of different developmental types of antisocial behavior are differentially influenced by various causal risk factors. Moffitt (Reference Moffitt1993) and others have distinguished between adolescence-limited and life-course persistent antisocial behavior, and they have suggested that the former is more socially driven (e.g., peer influences during adolescence) whereas the latter is more biological (e.g., due to neurodevelopmental problems starting at an early age). The notion that life-course persistent antisocial behavior might have a stronger biological etiology is also indicated by longitudinal twin studies, which suggest that genetic effects have early onset and persist over time whereas environmental effects seem to be adolescent onset (Silberg, Rutter, Tracy, Maes, & Eaves, Reference Silberg, Rutter, Tracy, Maes and Eaves2007). Thus, if de novo mutations are important for antisocial behaviors, we would expect them to be more important for life-course persistent antisocial behavior in general and for our measure of the number of violent crimes. We believe that our results of a within-family effect of advancing paternal age on repeated violent criminality, in contrast to ever having committed a violent crime, are congruent with the de novo mutation hypothesis, especially because we did not find a within-family effect in the sensitivity analyses of nonviolent crimes.
Maternal age
Our cohort analysis showed no association between advancing maternal age and risk for offspring violent offending; on the contrary, advancing maternal age lowered the risks. Therefore, we believe that the within effect of paternal age is not due to confounding with maternal age.
Younger fathers and violent crime
We examined if advancing paternal age is associated with risk for committing a violent crime. However, our analyses showed nonlinear effects with both young and old paternal age as risk factors for violent criminality. For ever committing a violent crime, the increased risk for younger fathers persisted in the within-family analyses and thus was consistent with a causal effect. Because this was not our original research question, we did not investigate the result further in the current work. However, the results are consistent with some research on the effect of maternal teenage childbearing and criminality in offspring (D'Onofrio et al., Reference D'Onofrio, Goodnight, Van Hulle, Rodgers, Rathouz and Waldman2009; Harden et al., Reference Harden, Lynch, Turkheimer, Emery, D'Onofrio and Slutske2007), although other studies have suggested the association is not causal (Geronimus, Korenman, & Hillemeier, Reference Geronimus, Korenman and Hillemeier1994; Turley, Reference Turley2003). Future quasiexperimental research is needed to more fully understand the mechanisms through which early maternal and paternal age at childbearing influence offspring antisocial behavior.
Mental illness and violent criminality
We also assessed the possible mediation of the association between advancing paternal age at childbearing and offspring criminal convictions by schizophrenia or bipolar disorder. We are aware that conducting analyses with a true mediator as a covariate will not unanimously inform about whether it is a mediator (Glymor & Greenland, Reference Glymor, Greenland, Rothman, Greenland and Lash2008). Yet, we would expect a big change in our estimates if the association was strongly mediated by mental illness. However, our results for the nonill group did not differ much from that including the ill group, leading us to believe that our measure of mental illness does not mediate our association to the extent that we need to separate analyses into mentally ill and nonill groups.
Strengths and limitations
One strength of our study is the large population-based sample. We had total coverage of exposure, outcome, and covariates because official records were used. Using the Poisson hurdle model gave vital information on possible etiological differences between the two violent outcome measures, and we used information from multiple assessments per individual as well as multiple individuals per family. It is important that the study took advantage of information at multiple levels of analysis to conduct sibling-comparison analyses, an approach that can rule out many genetic and environmental factors that might confound the association between advancing paternal age at childbearing and offspring antisocial behavior.
One obvious limitation is confounding of the different time scales and its effect on the association studied. We tried to solve this by testing different models for time at risk; although we chose one of the models, we also performed sensitivity analyses with the others with similar results. In our choice of model for time at risk, each individual starts off at the same risk level and acquires additional risk with time; the additional risk per time is estimated from the data. We chose not to control for birth period; we instead limited the birth period to a 22-year interval where the incidence per age was approximately similar across different birth years.
Treating missing SES as a category might induce bias. However, it was clear that the missing category could not be a mixture of the other categories with regard to outcome, because individuals in this category had a higher risk for violent criminality than in any of the other categories. Therefore, we are confident that our use of missing values as its own category is justified.
Although we used within-family estimates, we cannot disregard the possibility that the effect found could result from unmeasured confounding (Donovan & Susser, Reference Donovan and Susser2011; Lahey & D'Onofrio, Reference Lahey and D'Onofrio2010). The within-family estimation correctly controls for unmeasured confounders shared by siblings; however, nonshared or partly shared confounders can still cause noncausal associations. Examples of such confounders are peer influence during adolescence and childrearing regime (which might have changed between siblings). Similarly, we could not investigate unmeasured mediations. For example, it is possible that our index of mental illness (requiring overnight hospitalization) was too crude to capture a possible causal mediation.
Conclusions
We investigated the association between advancing paternal age and offspring violent criminality in a large Swedish total population sample. By using two different outcome measures, we identified distinct differences in how advancing paternal age affected the risk of ever committing a violent crime and the rate of violent crimes among violent offenders. We compared siblings to rigorously test the strength of our causal inferences. We found an association between higher paternal age and risk of being convicted of at least one violent crime; however, this association was attributable to familial (genetic and environmental) confounds that influence all siblings in the family. Further, we found an association between higher paternal age and the rate of violent criminal convictions among violent offenders. Because this effect persisted when familial confounds were controlled for, it is thus due to factors specific for each offspring in a family and consistent with a causal effect. One hypothesis that tries to explain the effect of paternal age on disadvantageous outcomes is that of de novo mutations in the male germ line. The hypothesis can be investigated by identifying actual de novo mutations. However, the mechanism through which this works is unknown. Thus, further research might focus on finding mediators and mapping the mechanism. In addition to previously mentioned possible mediators (i.e., mental illness and general cognitive functioning), perinatal effects might be of importance.
Appendix A
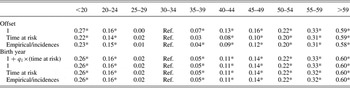
Parameter estimates for paternal age categories from sensitivity analyses using different offset terms for the Bernoulli outcome

Note: Generalized linear model analyses of Bernoulli outcome, adjusted for covariates and using different offsets. Ref., reference category.
*p < .05.
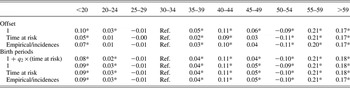
Parameter estimates for paternal age categories from sensitivity analyses using different offset terms for truncated Poisson outcome

Note: Generalized linear model analyses on truncated Poisson outcome, adjusted for covariates and using different offsets. The upper three rows were not adjusted for birth year whereas the lower four rows were adjusted for birth year. Ref., reference category.
*p < .05.
Parameter estimates for maternal age categories from cohort analyses

Note: Generalized linear model analyses for maternal age for the two different outcomes adjusted for covariates (treating paternal age as categorical). Offset variable is modeled as 1 + q × (time at risk). The estimates for “Ever Committing a Violent Crime” are changes per unit in offset for the regression on probability for committing at least one crime using the complementary log–log link. The risk ratio is the probability of committing a violent offense in each age category divided by the probability in the reference category (at the reference categories of the covariates). The estimates for “Number of Violent Crimes” are changes in the regression on the intensity per unit in offset of criminal offenses using the log link. The incidence rate ratio is the incidence rate in each category relative to the incidence rate in the reference category. Ref., reference category.
*p < .05.
Parameter estimates for paternal age categories from sensitivity analyses excluding individuals diagnosed with mental illness

Note: Estimates for individuals without any diagnosis of schizophrenia or bipolar disorder. Generalized linear model analyses for the two different outcomes adjusted for covariates (treating maternal age as categorical). Offset variable is modeled as 1 + q × (time at risk). The estimates for “Ever Committing a Violent Crime” are changes per unit in offset for the regression on probability for committing at least one crime using the complementary log–log link. The estimates for “Number of Violent Crimes” are changes in the regression on the intensity per unit in offset of criminal offenses using the log link. Ref., reference category.
*p < .05.
Parameter estimates for paternal age categories from cohort analyses for nonviolent crimes
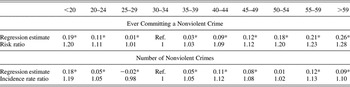
Note: Generalized linear model analyses for the two different outcomes adjusted for covariates (treating maternal age as categorical). Offset variable is modeled as 1 + q k × (time at risk). The estimates for “Ever Committing a Nonviolent Crime” are changes per unit in offset for the regression on probability for committing at least one nonviolent crime using the complementary log–log link. The risk ratio is the probability of committing a nonviolent offense in each age category divided by the probability in the reference category (at the reference categories of the covariates). The estimates for “Number of Nonviolent Crimes” are changes in the regression on the intensity per unit in offset of nonviolent criminal offenses using the log link. The incidence rate ratio is the incidence rate in each category relative to the incidence rate in the reference category. Ref., reference category.
*p < .05.
Analyses for the probability of ever committing a nonviolent crime (Bernoulli outcome). (a) The fitted natural spline from the cohort analysis (generalized linear model) with 95% confidence bounds with paternal age as exposure, and (b) the spline for the within-family effect (generalized estimation equation) with 95% confidence bounds based on the robust variance estimation. The exposure is the deviation of paternal age from mean paternal age within the family. The results are transformed to probabilities and divided by the lowest value in the age span (0.002 for cohort and 0.068 for within family). The vertical dashed lines are the knots in the splines. [A color version of this figure can be viewed online at http://journals.cambridge.org/dpp]

Analyses for the number of nonviolent crimes committed (truncated Poisson outcome). (a) The fitted natural spline from the cohort analysis (generalized linear model) with 95% confidence bounds with paternal age as exposure values, and (b) the spline for the within-family effect (generalized estimation equation) with 95% confidence bounds based on the robust variance estimation. The exposure is the deviation of paternal age from mean paternal age within the family. The results are transformed to rates and divided by the lowest value in the age span (2.54 for cohort and 1.54 for within family). The vertical dashed lines are the knots in the splines. [A color version of this figure can be viewed online at http://journals.cambridge.org/dpp]