It is often advised to “know your audience” before giving a lecture, and this is especially important when we lecture to students. Moreover, knowing your audience is critical in quantitative analysis courses, where it can be especially challenging to teach mostly math-phobic students. But it is in quantitative analysis courses where faculty may know their audience the least. While many subfields in the discipline have implemented pedagogical innovations such as seminar-style discussion, simulations, and even learning communities, quantitative methods courses seem to be the last hold-out for the traditional lecture format.
Unfortunately, the traditional lecture format reaches very few students effectively. Fewer than 12 to 18% of the population learn aurally (Russell Martin & Associates), which means more than 80% of students in the classroom struggle to learn the material, merely because it is spoken rather than written down or taught in a hands-on manner. In addition, traditional quantitative analysis courses, which involve principally derivations, proofs, and algebraic manipulations, are understood best by sensing-thinking learners, which make up only about 30% of the adult male population, and less than 20% of the adult female population (Bayne 1995). Finally, less than 10% of the population have the logical-mathematical intelligence to succeed in a traditional lecture-style methods course (Hibbison 1999).1
All population percentages listed herein vary by year of study and particular variant of the learning styles or multiple intelligences inventory administered.
So, in a traditional quantitative analysis course, the only student optimally poised to succeed must be in the 12–18% of the population that learns aurally
and part of the 20–30% of the population composed of sensing-thinking learners
and part of the less than 10% of the population that has logical-mathematical intelligence. The majority of the class is at a tremendous disadvantage before the instructor has even handed out the syllabus at the first lecture.
But by recognizing that each person (including you, the instructor) processes information differently, and by making our teaching accessible to students of multiple learning styles, we can give all of our students a better chance to succeed. Catering to multiple learning styles is important regardless of the type of political science course you teach, but it is especially critical in a quantitative political analysis courses. Students in these courses often underestimate their quantitative abilities; this problem is amplified in these courses because unlike typical political science courses, there is a right or a wrong answer with no room for shades of gray. By teaching to multiple intelligences and learning styles, we can empower even the most math-phobic students with the tools for mastering the material.
Thus the dynamics of the quantitative political analysis classroom cry out for a practical guide for how instructors might adjust their teaching style to reach a maximum number of students. Instructors of quantitative political analysis looking for a how-to manual are right to consult the literature from a variety of disciplines. Unfortunately, no current work specifically addresses how to teach quantitative political analysis: the literature on how to teach mathematics is not aimed for an audience approaching math from a politics or public policy perspective; the educational psychology literature is extremely abstract with little focus on practical application; and the vast politics literature gives little pragmatic advice on how to teach statistics.
This paper gleans insights from all of the above literatures, particularly from the Learning Styles and Multiple Intelligences literatures, to provide a brief, practical guide to teaching quantitative political analysis course at the undergraduate or graduate level. This “Multiple Methods, More Success” paradigm is one that I have seen work extremely well in my own classroom.2
Student evaluations of the “contribution of this course to increasing your interest in the subject matter” and “overall quality of the course” were much higher with the Multiple Methods approach. Several students also sent unsolicited praise of the teaching paradigm via email.
Even if you do not teach quantitative political analysis or a similar course, parts of the “Multiple Methods, More Success” approach can be applied to any collegiate political science classroom.
Background: What Are Learning Styles and Multiple Intelligences?
Educational psychologists have long known that different students learn differently. There are several major schools of thought on how students learn, including the popular Kolb Learning Preference Model (1985) and Gardner's Theory of Multiple Intelligences (1983). Some scholars have also taken psychology research on personality types and applied it to the study of learning. The most well known of these is the Myers-Briggs Personality Type Indicator (1995), an application of research by Carl Jung (1923) which can be used to understand not only a person's personality, but also how that person might think about and process new information.3
The above list is by no means exhaustive.
I chose to draw from both Gardner's Theory of Multiple Intelligences and applications of the Myers-Briggs Personality Type Indicator (MBTI) in developing the “Multiple Methods, More Success” paradigm for two reasons. First, each theory offers a very different view of how students learn. Second, these theories are complimentary; Silver, Strong, and Perini (2000) have shown that both theories can be implemented jointly and successfully.4
Several other researchers, most notably Brock and Cameron (1999) and Fox and Ronkowski (1997) have discussed the ways in which Kolb's Learning Preference model can be integrated into the (qualitative) political science classroom. I do not disagree with their analysis. However, since the main tenants of Kolb's model can be found within the intersection of Gardner's theory and applications of MBTI, it seems that either is an apropos choice.
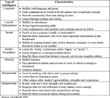
Gardner's Theory (1983) of Multiple Intelligences was a major departure from the idea that a single number, IQ, could adequately describe all types of intelligence. Gardner defines seven major types of intelligence: Linguistic, Musical, Logical-Mathematical, Spatial, Bodily-Kinesthetic, Interpersonal, and Intrapersonal.5
Gardner later added an eighth intelligence: Naturalist. Because this intelligence is regarded as less common, particularly in the political methodology classroom, it will not be discussed.
The type of intelligence that best describes a student has implications for how he or she will master new material.
Figure 1 shows the learning characteristics for students with each type of intelligence.
Learning Characteristics for Students of Each IntelligenceSilver, Strong, and Perini (2000) have a chart that is somewhat similar, but focuses on how students of multiple intelligences learn at the elementary school level; I designed this application specifically for collegiate quantitative political analysis courses.See for example Math Matters 2000.
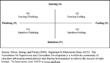
MBTI has been used by psychologists to assess a variety of personality characteristics, including romantic compatibilities, group-dynamic interactions, and, most recently, learning styles. MBTI suggests that people can be classified on four dimensions: introvert/extrovert, judgment/perception, thinking/feeling, sensing/intuition. The thinking/feeling and sensing/intuition dimensions offer the most insight about how a student learns new information. Figure 2 shows each of the four categories of learners that can be formed from these two dimensions.
Learning Styles Derived from MBTI
Each type of student—ST, SF, NT, and NF—learns differently. Students who are (S)ensors are “concrete” learners. They like logical, step-by-step derivations of formulas or explanations of concepts. They usually have strong inductive and deductive reasoning skills, and like to see new material explained in that way. Such a student may be bored with a free-flowing discussion and may dislike assignments that appear impractical or irrelevant. Such learners find it critical to see and practice concrete applications of new material.
I(N)tuitors are just the opposite. Such students prefer to use their imaginations and creativity and are usually very good at seeing the abstract relationships between theories and concepts. They get bored with step-by-step explanations and rote learning; instead they prefer to see the big picture and then fill in the details through their own discovery. Applications of material are less important to these students than a thorough understanding of the concept.
Students who are (T)hinkers learn from logically ordered derivations of concepts. NTs need to see the “big picture” first to understand the logical order, whereas STs like to see the details first. Both NTs and STs benefit from practicing what they have learned, but NTs like to practice what they have learned by using the material to theorize about new situations, whereas STs would rather apply the new material to a series of concrete, real world problems.
Finally we have the (F)eelers. They have a strong dislike for details and the memorization of facts; rather, they prefer to learn through discovery and discussion. SFs benefit enormously from group work; NFs prefer to work alone. SFs prefer structured discussions that emphasize concrete applications of material, whereas NFs prefer more free-form discovery, such as exploring the material through applying it to an original research project.
How to Integrate Learning Styles and Multiple Intelligences into Your Classroom
The “Multiple Methods, More Success” paradigm for teaching methodology draws partially on the ideas of Silver, Strong, and Perini (2000), whose book is designed to assist elementary school instructors in teaching to different learning styles and intelligences. I modified the paradigm to apply to the collegiate quantitative political analysis classroom. Each section below gives a brief description of the model's components, a list of learning styles that can be reached during that component, and an example of how to implement that component in the classroom. While some of the suggestions herein may seem minor or even trivial, they can have a huge impact on student learning. For example, just by writing down on the blackboard what you are saying aloud can reach an additional 62 to 70% of your students!
I. Motivation
“Why are we learning this methodological tool?” “How will it be useful in the study of politics or policy?” The answers can be stated verbally and written on the blackboard.
Learning Styles Reached
- NFs and NTs: They need to see the “big picture” before the details.
- Writing information on the board helps reach students with linguistic intelligence.
- Stating the purpose aloud helps reach students with musical intelligence who learn aurally.
- Sometimes during this motivation section I use a real-life example, which is important motivation for STs who like to see the practical application of the material.
- Sometimes we discuss the example, which is helpful for SF learners and those with interpersonal intelligence.
Motivation Section in Practice
This is a terrific place to connect statistics back to political science, and by doing so you can motivate and engage students. In teaching about distributions, for example, a traditionally banal topic, I talked to the students about how understanding distribution theory was useful in evaluating the controversial claims made in the book The Bell Curve.
II. Definition of Concepts and Terms—Sans Math
Defining the terms for the day on the blackboard in words and saying each definition aloud helps learners of many types.
Learning Styles Reached
- Students with linguistic intelligence need to see concepts in words before they see the math.
- Saying the definitions aloud helps students with musical intelligence who learn aurally.
- NFs and NTs also like to learn the concepts before the equations.
Definitions Section in Practice
In teaching about mean and variance, I write the following on the board and say it aloud: Mean: “What is typical?” Mean is the average of a set of numbers. Variance: “How far from typical is typical?” Variance measures the dispersion of a set of numbers.
III. Math Formulas and Derivations
Learning Styles Reached
- STs and SFs are concrete, sequential learners who need to see concepts logically derived.
- Students with logical/mathematical intelligence find this the most important part of class.
Formulas Section in Practice
Deriving the OLS parameter estimates by minimizing the sum of squared errors.
IV. Visual Description
Research suggests that most students are visual learners (Devlin 2000; Math-Matters 2000), so this section is key. Almost any formula or concept lends itself to a visual description, whether in the form of a two dimensional graph, a three dimensional graph, or a concept chart. “Concept charts” are mental maps of how concepts are related to one another, and thus are helpful “pictures” for visual learners.
Learning Styles Reached
- Students with linguistic intelligence benefit enormously from concept charts.
- Students with spatial intelligence find this a vital part of lecture.
- NFs and NTs find it helpful to understand intuitively how concepts are related to one another.
Visual Section in Practice
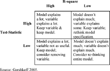
Figure 3 is an example of a concept chart. While obviously oversimplified, it explains in a broad sense how to use the information contained in test-statistics and R-square values to better specify regression models. Building a three-dimensional clay model is another example of visual description. I built one such model that showed the traditional X and Y axis and regression line in the first two dimensions, and probability distribution for each predicted value of Y made out of clay “mounds” in the third dimension. Thus the students could see that the predicted values of Y are simply the values for Y that are most probable.
Sample Concept Chart: Using Test-Statistics and R-Square in Model Specification
V. Examples
Next I showed a few examples on the board using real public policy data, walking the students through each step. I would pause partway through each example and give students a moment to calculate one small piece of the problem before moving on. We could then discuss the appropriate policy recommendation based on our calculations. Politics or policy examples are also a great place to show the connection between quantitative analysis and political science.
Learning Styles Reached
- ST students benefit from seeing the practical application of the material they are learning.
- Students with intrapersonal intelligence benefit from being able to think through concepts on their own when I pause and give them time to perform a calculation.
- NFs and SFs like the discussion that often follows about what policy recommendation should be made.
- Students with interpersonal intelligence also benefited from such discussions.
- Students with bodily-kinesthetic intelligence benefit from being able to work through some parts of the examples on their own and put into practice what they learn.
Examples Section in Practice
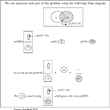
In explaining Bayes Rule, I walked the students through an example of trying to calculate the probability of having a disease (D) given that you have tested positive (TP) for it, i.e., suppose we want to know pr(D|TP), and we are given the following information: pr(TP) = 0.0594, pr(TP|D) = 0.99, pr(TP|∼D) = 0.05, pr(D) = 0.01. Using Bayes Rule, we can develop the following equation:
Figure 4 demonstrates how to work through the problem using a Venn Diagram. Students could then verify the result they got conceptually with the Venn Diagram in a more concrete fashion, using the actual numbers. Finally, students could then discuss whether or not the test was one that the FDA should approve.
A Visual Depiction of Bayes Rule in the Disease/Test Example
VI. Group Work
Next I let the students work through a few public policy examples in groups.
Learning Styles Reached
- Students with interpersonal intelligence benefit enormously from group problem solving.
- NFs and NTs find it helpful to discuss with other students how different problems are conceptually similar or different.
- STs benefit from being able to concretely work through problems.
- Students with bodily-kinesthetic intelligence benefit from practicing what they have learned.
Group Work Section in Practice
Giving the students two problems that on the surface look similar, but in reality have some important, intrinsic difference, can lend itself well to group work and discussion.
VII. Capstone
“What have we done today?” You can discuss this verbally, then write a few notes on the board. This is also a good time to mention extensions or applications of the material to other areas of politics or policy.
Learning Styles Reached
- NFs, NTs, and SFs benefit from being reminded of the “big picture” at the end of class.
- Students with musical intelligence, who learn aurally, benefit from listening to the instructor sum up the class aloud.
- Students with linguistic intelligence benefit from seeing a written summary of class.
- Students with intrapersonal intelligence like reflecting on the content of the class.
Capstone Section in Practice
In teaching about the assumptions behind the OLS model, re-list the assumptions in abbreviated form. Then discuss examples where these assumptions did and did not apply in your own research.
Benefits of the “Multiple Methods, More Success” Approach
Gives all Students an Equal Chance to Succeed
The “Multiple Methods, More Success” approach enables students of every intelligence and learning style to be successful in the course, not merely those who think the same way as the instructor.
Leads to Greater Student Achievement and Confidence
My experiences show that the integration of multiple learning styles gives students increased confidence in their own abilities and motivates them to put even greater effort into the class. On my course evaluations, students who reported that “the instructor employed methods of explaining the material that were usually different than I had seen before” were also much more likely to report feeling “much more confident about myself and my abilities.” Students who noted that the instructor employed new methods for explaining the material were also more likely to say that their knowledge of statistics is now “much greater and deeper” than before taking the class.
The reason I credit the “Multiple Methods, More Success” approach with these positive comments is because the sound of true comprehension—the “ahhhs” or “ohh, I get its”—came at different parts of the lecture for different students. Some students said things like, “I didn't really understand that concept until you drew that picture.” Others would comment that the group work helped their understanding most; still others would say that the definition of terms in words was most useful. The “Multiple Methods, More Success” approach addressed learning styles in a way absent from the typical classroom, and it made a difference.
This Approach Allows Students to use their Strengths to Improve on their Weaknesses
A verbal-linguistic learner in my class, for example, learned how she can take any math concept and translate it back to prose, helping her understand the math in the process. Artistic students can use their spatial intelligence to help them understand math too. Those who thrive on interactions with others can learn the material through group work. Using talents that students already possess gives them confidence and motivates them to learn the math. This enables students to use what they are good at to master the material. In short, everyone wins.
Conclusions
For the most part, political science instructors, and in particular those who teach quantitative courses, have not yet sought to integrate ideas about different learning styles into their classrooms. Many employ a traditional lecture class, focused on the derivation and application of formulas. Such an approach is a Mecca for STs and students with logical/mathematical intelligence, and an intellectual quagmire for everyone else. Some students predictably struggle—not for lack of intelligence, but simply because the classroom did not suit their learning needs. Research on education is very clear on this point: if a student is not taught in a way that suits his or her learning style, the student is likely to struggle.
Thus it seems imperative to try to give each and every student the tools to be successful, not merely those who think the same way as the instructor. By using a multi-method approach we can ensure more student success.
I would like to thank Larry Bartels, Tali Mendelberg, Bryan Shelly, and three anonymous reviewers for helpful comments. I would also like to thank Dean Templeton, Dean Trussell, and Terri Herris Reed for encouraging innovative teaching ideas. For more information on implementing the “Multiple Methods, More Success” approach, links to learning styles and multiple intelligences inventories, and links to other educational psychology research visit http://www.princeton.edu/~agershko.