Introduction
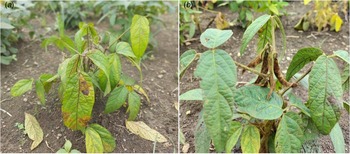
Soybean (Glycine max, L.) is the major Indian oilseed crop whose production is impeded by various biotic and abiotic stress forms (Nataraj et al., Reference Nataraj, Kumar, Kumawat, Shivakumar, Rajput, Ratnaparkhe, Ramteke, Gupta, Satpute, Rajesh, Kamble, Chandra and Wani2019). Soybean anthracnose disease caused by Colletotrichum truncatum (Schw.) Andrus and W.D. Moore is a major fungal disease in India causing about 16–25% yield loss (Sharma et al., Reference Sharma, Gupta, Verma, Sharma, Bhagat, Amaresan, Saini, Chattopadhyay, Sushil, Asre, Kapoor, Satyagopal and Jeyakumar2014), accounting for 1.17 million tons (Wrather et al., Reference Wrather, Shanon, Balardin, Carregal, Escobar, Gupta, Ma, Morel, Ploper and Tenuta2010). The crop is vulnerable to this pathogen at all its growth stages and disease symptom otology includes pre and post-emergence damping-off, appearance of dark brown cankers on infected cotyledons, veinal necrosis, pre-mature defoliation due to petiole cankering and appearance of brown diseased areas in irregular shape on leaves, stems and pods, which on further progress, results in plant death (Hartman et al., Reference Hartman, Rupe, Sikora, Domier, Davis and Steffey2015) (Fig. 1).
Colour online. Soybean anthracnose disease severity under hot spot conditions: (a) Foliar infection. (b) Pod infection.

Indian mega-varieties such as JS 335 and JS 95-60 have become highly susceptible to this pathogen and development of high-yielding and anthracnose-resistant varieties is an immediate thrust area to sustain soybean production in India (Sajeesh et al., Reference Sajeesh, Rao and Shamarao2014; Nataraj et al., Reference Nataraj, Shivakumar, Kumawat, Gupta, Rajput, Kumar, Sharma and Bhatia2020). Several studies have reported field screening under hot spot conditions for the identification of anthracnose-resistant sources (Gawade et al., Reference Gawade, Suryawanshi, Patil, Zagade and Wadje2009; Nagaraj et al., Reference Nagaraj, Jahagirdar and Basavaraja2014; Nataraj et al., Reference Nataraj, Shivakumar, Kumawat, Gupta, Rajput, Kumar, Sharma and Bhatia2020). To our knowledge, this is the first study to identify stable resistant sources for anthracnose disease through multi-environmental trials (MET). Resistance breeding is effective if host × pathogen interactions are thoroughly understood, which is challenging and difficult when the interactions are more complex (Yan and Falk, Reference Yan and Falk2002). Several stability models (Finlay and Wilkinson, Reference Finlay and Wilkinson1963; Eberhart and Russell, Reference Eberhart and Russell1966) have been developed to study G × E interactions. As the number of genotypes and environments increases, interactions become complex and cannot be analysed in detail without a graphic approach. Multivariate, graphic-based stability models such as GGE (genotype main effect (G) plus genotype by environment interaction (GE)) (Yan et al., Reference Yan, Hunt, Sheng and Szlavnics2000) and additive main effect and multiplicative interaction (AMMI) (Zobel et al., Reference Zobel, Wright and Gauch1988) biplot analyses have been employed by researchers to understand the complex G × E interaction patterns and to identify stable genotypes for several economically important traits, especially grain yield. Further, these two models have been used extensively for disease resistance trait in different crops for different diseases to identify stable and durable-resistant sources and to understand G × E interactions (Sharma et al., Reference Sharma, Babu, Gaur, Ghosh, Rameshwar, Chaudhary, Upadhyay, Gupta, Saxena, Kaur, Dubey, Anandani, Harer, Rathore and Pande2012, Reference Sharma, Babu, Ghosh, Telangre, Rathore, Kaur, Kushwaha, Das and Pande2013; Persaud and Saravanakumar, Reference Persaud and Saravanakumar2018; Diatta et al., Reference Diatta, Tovignan, Adoukonou-Sagbadja, Aidara, Diao, Sarr, Ifie, Offei, Danquah and Cisse2019; Pandey et al., Reference Pandey, Yee, Win, Lwin, Adapala, Rathore, Sheu and Nair2021; Srivastava et al., Reference Srivastava, Saxena, Saabale, Raghuvanshi, Anandani, Singh, Sharma, Wasinikar, Sahni, Varshney, Singh and Dixit2021)
Complex interaction will create disagreement between realized and expected genotypic responses, thereby affecting the selection efficiency (Pande et al., Reference Pande, Sharma, Gaur, Basandrai, Kaur, Hooda, Basandrai, Babu, Jain and Rathore2013) and accurate prediction models aids in enhancing selection efficiency in MET, thereby increasing the genetic gains (Gauch and Zobel, Reference Gauch and Zobel1988). Through its shrinkage property, the best linear unbiased prediction (BLUP) model is reported to outperform AMMI family models in predicting genotypic means (Piepho, Reference Piepho1994; Olivoto et al., Reference Olivoto, Lucio, da Silva, Marchioro, de Souza and Jost2019).
A recent quantitative stability index, Weighted Average of Absolute Scores (WAASB) from the singular value decomposition of the matrix of BLUPs for the GEI effects generated by a linear mixed effect model (LMM), is a graphic-based mixed-model accommodating the features of both BLUP and AMMI models (Olivoto et al., Reference Olivoto, Lucio, da Silva, Marchioro, de Souza and Jost2019) and aids in analysing MET. WAASB-based superiority index, WAASBY helps in the selection of genotypes simultaneously for superiority and stability of targeted trait (Olivoto et al., Reference Olivoto, Lucio, da Silva, Marchioro, de Souza and Jost2019). WAASB stability index has been employed for the identification of stable genotypes in different economic traits such as drought and salinity stress tolerance in soybean (Zuffo et al., Reference Zuffo, Steiner, Aguilera, Teodoro, Teodoro and Busch2020) and cassava mosaic disease and cassava anthracnose disease resistance (Tize et al., Reference Tize, Fotos, Nukenine, Masso, Ngome, Suh, Lendzemo, Nchoutnji, Manga, Parkes, Kulakow, Kouebou, Fiaboe and Hanna2021), and grain yield and early maturity in soybean (Nataraj et al., Reference Nataraj, Bhartiya, Singh, Devi, Deshmukh, Verghese, Singh, Mehtre, Kumari, Maranna, Kumawat, Ratnaparkhe, Satpute, Rajesh, Chandra, Ramteke, Khandekar and Gupta2021). Therefore, future studies would benefit when using WAASB, since they would integrate BLUP and AMMI proprieties into a single method (van Eeuwijk et al., Reference van Eeuwijk, Bustos-Korts and Malosetti2016; Olivoto et al., Reference Olivoto, Lucio, da Silva, Marchioro, de Souza and Jost2019). With this background, the present study aimed at identifying the potential donors for anthracnose resistance, identifying the discriminative environments for anthracnose disease screening and understanding the G × E interaction patterns through WAASB stability model.
Materials and methods
Genotypes and environments
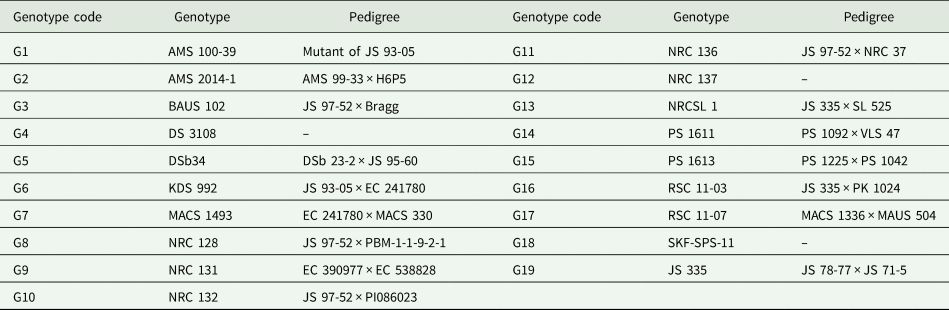
A total of 18 advanced breeding lines that have been derived from diverse parents and bred for higher grain yield, along with a common susceptible check, JS 335 (G19), were used for multi-location evaluation for resistance to anthracnose disease (Table 1). Nineteen soybean genotypes were screened at five locations for three consecutive years (2017, 2018 and 2019). These five locations have been known for high anthracnose disease incidence in India and belong to a wide array of agro-climatic zones including central zone (Indore and Jabalpur), southern zone (Dharwad), northern hill zone (Palampur) and north eastern hill zone (Medziphema), and are agro-ecologically and geographically diverse (Table S1).
Details of the genotypes evaluated in the current study

Experimental method
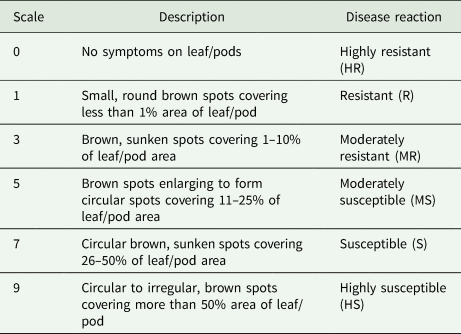
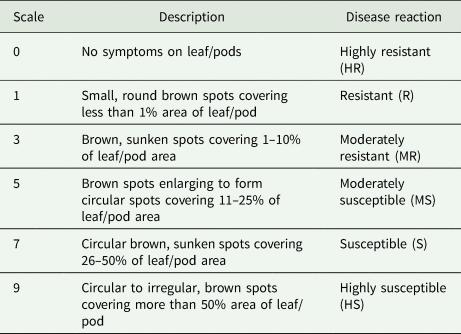
At each environment, 18 advanced breeding lines along with a common susceptible check, JS 335 were evaluated in randomized complete block design fashion with three replicates, each in a plot size of 4.05 m2. At each location, local susceptible checks were sown at regular intervals so as to ensure high disease incidence and to minimize disease escape. Recommended package of practices have been followed throughout the crop cycle (ICAR 2009). Disease evaluation was done in ten randomly pre-tagged plants of each replicate of each genotype and the data were averaged. Disease scoring was done by following 0–9 scale as per Mayee and Dattar (Reference Mayee and Dattar1986) (Table 2).
Disease scoring following 0–9 scale as per Mayee and Dattar (Reference Mayee and Dattar1986)
Statistical analyses
Each location-year combination was regarded as an environment. Therefore, 15 environments were considered for data analysis. Analyses were performed based on disease scores. Since local checks were different for different environments, only the 18 breeding lines along with the common susceptible check JS 335 were considered for the analysis. Pooled analysis of variance and WAASB-based (Eqn (1)) stability and superiority analyses were performed using R package ‘metan’ (Olivoto and Lucio, Reference Olivoto and Lucio2020).
Stability analysis was carried out using WAASB index generated by an LMM as follows

where WAASBi = ith genotype's weighted average of the absolute scores; IPCAik = ith genotype's score in the kth interaction principal component axes (IPCA); EPk = variance attributed by kth IPCA.
Genotype with the lowest WAASB score deviates least from the mean performance across environments and is therefore considered most stable.
Simultaneous selection for both disease score and stability was done using the superiority index WAASBY (lower is better) with the following model (Eqn (2)).

where WAASBYi = ith genotype's superiority index based on mean performance and stability; rGi = rescaled value (0–100) of the response variable; rWi = rescaled value (0–100) of WAASB index; θY = weight of response variable; θS = weight of WAASB index.
Genotype with the highest WAASBY score would be attributed with first-order rank.
Relationship of different climatic parameters with disease score has been elucidated through principal component analysis (PCA). Data on rainfall, relative humidity (RH) and number of rainy days have been recorded from the respective weather stations. Remaining climatic parameters were retrieved using the R package ‘EnvRtype’ (Costa-Neto et al., Reference Costa-Neto, Galli, Carvalho, Crossa and Fritsche-Neto2021). PCA has been carried out using R package ‘factoextra’ (Kassambara and Mundt, Reference Kassambara and Mundt2017). Details of all the codes used were provided as a supplementary file.
Results
Pooled analysis of variance (ANOVA) and likelihood ratio test (LRT)
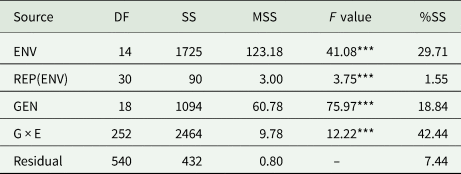
Through pooled ANOVA, it was found that genotypic, environmental and G × E interaction effects were significant (P < 0.001) (Table 3). Among these three sources of variation, G × E interaction contributed highest (42.44%) to the total variation followed by environment (29.71%) and genotype (18.84%). The LRT revealed significant (P < 0.05) genotype effect, environment effect and G × E interaction.
Pooled ANOVA of anthracnose disease score for 19 genotypes evaluated in 15 environments

DF, degrees of freedom; SS, total sum of squares; MSS, mean sum of squares; ENV, environment; REP(ENV), replication (environment); GEN, genotype; %SS, per cent of total sum of squares.
***Significance at P < 0.001.
Mean performance of genotypes and environments
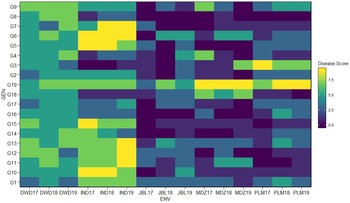
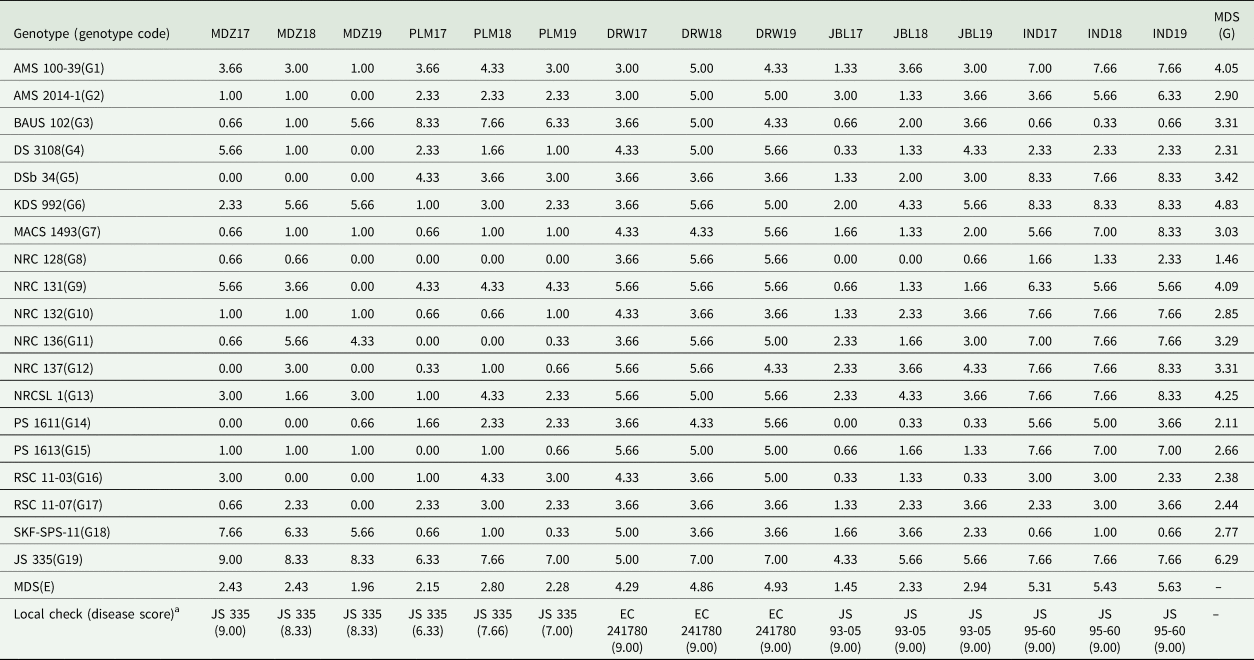
Mean disease severity of local susceptible checks across environments ranged from 6.33 to 9.00 (Table 4) indicating adequate disease pressure at all environments. Variability for disease severity among genotypes and disease incidence among environments is evident through heat map (Fig. 2). Among environments, mean disease incidence was highest at IND19 (5.63) followed by IND18 (5.43) and IND17 (5.31) while it was lowest at JBL17 (1.45) followed by MDZ19 (1.96) and PLM19 (2.28). Mean disease score among genotypes ranged from 1.46 (G8) to 6.29 (G19) (Table 4). Several genotypes showing disease score more than the common susceptible check G19 have been encountered across environments. Genotype G3 at PLM17, genotypes G9, G12, G13 and G15 at DRW17, genotypes G5 and G6 at IND17, genotype G6 at IND18 and genotypes G5, G6, G7, G12 and G13 at IND19 were found to be more susceptible than G19. No genotype at Medziphema and Jabalpur across three years was found to be more susceptible than G19 (Table 4). Location wise mean disease incidence ranged from 2.24 (Jabalpur) to 5.46 (Indore) (Table S2). Within the location, across seasons, some genotypes found to show varied disease reaction while remaining have shown consistent disease reaction. Genotypes showing consistent HR/R across three seasons were identified within locations. At Medziphema, genotypes G2, G5, G7, G8, G10, G12, G14 and G15 were found to be highly HR/R across all seasons. At Palampur, genotypes G7, G8, G10, G11, G12, G15 and G18 have shown HR/R reaction in all three seasons. Similarly, at Jabalpur, consistent HR/R was shown by G8 and G14, and at Indore, two genotypes G3 and G18 were HR/R in all three seasons. Interestingly, at Dharwad, no genotype was found to exhibit HR, R or MR across all three seasons or in at least in any one of the three seasons (Table S2).
Colour online. Heat map of anthracnose disease scores of genotypes across different environments. GEN, genotype; ENV, environment; DRW17, Dharwad 2017; DRW18, Dharwad 2018; DRW19, Dharwad 2019; IND17, Indore 2017; IND18, Indore 2018; IND19, Indore 2019; JBL17, Jabalpur 2017; JBL18, Jabalpur 2018; JBL19, Jabalpur 2019; MDZ17, Medziphema 2017; MDZ18, Medziphema 2018; MDZ19, Medziphema 2019; PLM17, Palampur 2017; PLM18, Palampur 2018; PLM19, Palampur 2019; G1-AMS 100-39, G2-AMS 2014-1, G3-BAUS 102, G4-DS 3108, G5-DSb 34, G6-KDS 992, G7-MACS 1493, G8-NRC 128, G9-NRC 131, G10-NRC 132, G11-NRC 136, G12-NRC 137, G13-NRCSL 1, G14-PS 1611, G15-PS 1613, G16-RSC 11-03, G17-RSC 11-07, G18-SKF-SPS-11 and G19-JS 335.

Environment-wise mean disease scores of genotypes

MDZ17, Medziphema 2017; MDZ18, Medziphema 2018; MDZ19, Medziphema 2019; PLM17, Palampur 2017; PLM18, Palampur 2018; PLM19, Palampur 2019; DRW17, Dharwad 2017; DRW18, Dharwad 2018; DRW19, Dharwad 2019; JBL17, Jabalpur 2017; JBL18, Jabalpur 2018; JBL19, Jabalpur 2019; IND17, Indore 2017; IND18, Indore 2018; IND19, Indore 2019; MDS(G), genotypic mean disease score; MDS(E), environmental mean disease score.
a Disease score of susceptible checks.
Anthracnose disease severity in most of the genotypes varied across the locations (Table S2). For example, genotype G5 which was found HR (0.00) at Medziphema showed varied disease reaction from MR (2.11) at (Jabalpur) to HS (8.11) at Indore. G7 was resistant at Medziphema (0.88) and Palampur (0.88), whereas at Indore, it showed HS reaction (7.00). Genotype G8 was found to be highly resistant at Palampur (0.00) and resistant at Jabalpur (0.22) and Medziphema (0.44), and moderately resistant at Indore (1.77) but was found to be susceptible (5.00) at Dharwad. Similarly, G3 which was resistant (0.55) at Indore was found to be highly susceptible (7.44) at Palampur and G18 was found to be resistant at Palampur (0.66) and Indore (0.77), and was found to be susceptible (6.55) at Medziphema.
BLUP-based predicted genotypic values
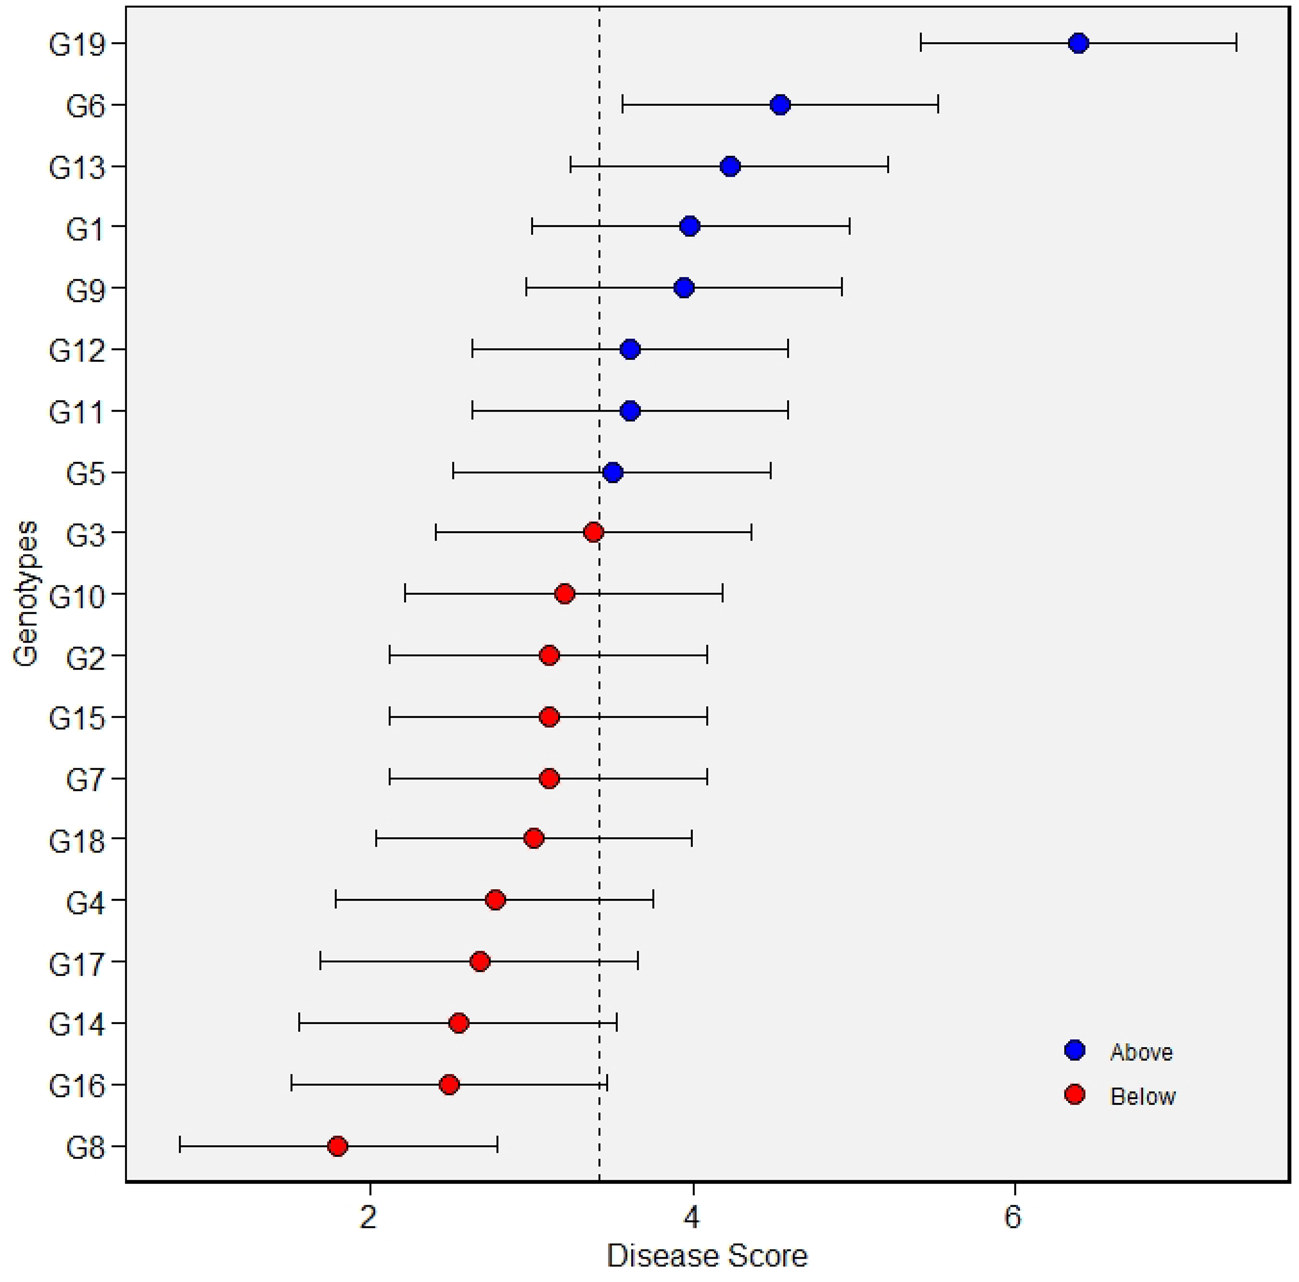
Predicted genotypic values for anthracnose disease score was highest in case of G19 (6.39) followed by G6 (4.54) and G13 (4.22) and was lowest for G8 (1.80) followed by G16 (2.49) and G14 (2.55) (Table S3). Eleven genotypes viz., G8, G16, G14, G17, G4, G18, G7, G15, G2, G10 and G3 had their mean below the grand mean while eight genotypes viz., G19, G6, G13, G1, G9, G12, G11 and G5 had their mean greater than the grand mean (Fig. 3).
Colour online. BLUP values of anthracnose disease scores of genotypes under study. G1-AMS 100-39, G2-AMS 2014-1, G3-BAUS 102, G4-DS 3108, G5-DSb 34, G6-KDS 992, G7-MACS 1493, G8-NRC 128, G9-NRC 131, G10-NRC 132, G11-NRC 136, G12-NRC 137, G13-NRCSL 1, G14-PS 1611, G15-PS 1613, G16-RSC 11-03, G17-RSC 11-07, G18-SKF-SPS-11 and G19-JS 335.

WAASB-based stability and biplot analyses
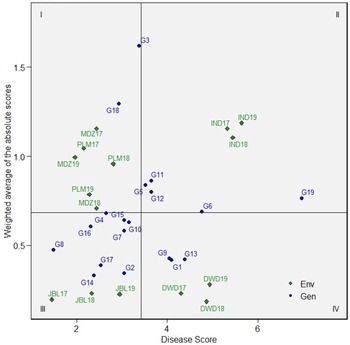
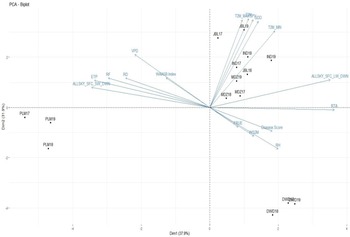
Through WAASB index, G14 was found to be highly stable (WAASB score = 0.33), followed by G2 (0.34), G17 (0.38) and G1 (0.41). Genotype G3 (3.37) was found to be highly unstable followed by G18 (2.93), G11 (0.86) and G5 (0.83) (Table S4). Simultaneous interpretation of disease scores, genotypic stability and environments has been carried out through WAASB-based biplot with four quadrants each consisting four different genotypic and environmental categories (Fig. 4). Higher level of correlation among the environments within each location was evident from the biplot. First quadrant of the biplot includes highly unstable genotypes and highly discriminative environments. In the current study, G3 and G18 being most unstable, with their mean below the grand mean, were included in the first quadrant. Locations Medziphema (MDZ17, MDZ18 and MDZ19) and Palampur (PLM17, PLM18 and PLM19) were found to be most discriminating with their environmental means less than the grand mean. Genotypes G11, G5, G12, G19 and G6 which are unstable and whose disease scores are above the grand mean were included in the second quadrant. Indore location (IND17, IND18 and IND19) which was included in the second quadrant was found to be highly discriminating with its environmental means greater than the grand mean, which can be useful as a target environment to select tolerant genotypes. Third quadrant included highly stable and wider adaptable genotypes (G4, G15, G10, G16, G7, G8, G17, G2 and G14) with their mean disease scores less than the grand mean. Jabalpur location included in the third quadrant was found to be less discriminative with mean environmental scores less than the grand mean. Likewise, fourth quadrant includes genotypes (G9, G1 and G13) which were stable and had mean disease scores greater than the grand mean. Location Dharwad was found to be less discriminating with mean environmental scores greater than the grand mean.
Colour online. WAASB biplot for the anthracnose disease scores. ENV, environment; GEN, genotype; MDZ17, Medziphema 2017; MDZ18, Medziphema 2018; MDZ19, Medziphema 2019; PLM17, Palampur 2017; PLM18, Palampur 2018; PLM19, Palampur 2019; DRW17, Dharwad 2017; DRW18, Dharwad 2018; DRW19, Dharwad 2019; JBL17, Jabalpur 2017; JBL18, Jabalpur 2018; JBL19, Jabalpur 2019; IND17, Indore 2017; IND18, Indore 2018; IND19, Indore 2019; G1-AMS 100-39, G2-AMS 2014-1, G3-BAUS 102, G4-DS 3108, G5-DSb 34, G6-KDS 992, G7-MACS 1493, G8-NRC 128, G9-NRC 131, G10-NRC 132, G11-NRC 136, G12-NRC 137, G13-NRCSL 1, G14-PS 1611, G15-PS 1613, G16-RSC 11-03, G17-RSC 11-07, G18-SKF-SPS-11 and G19-JS 335.

WAASBY index-based ranking of genotypes
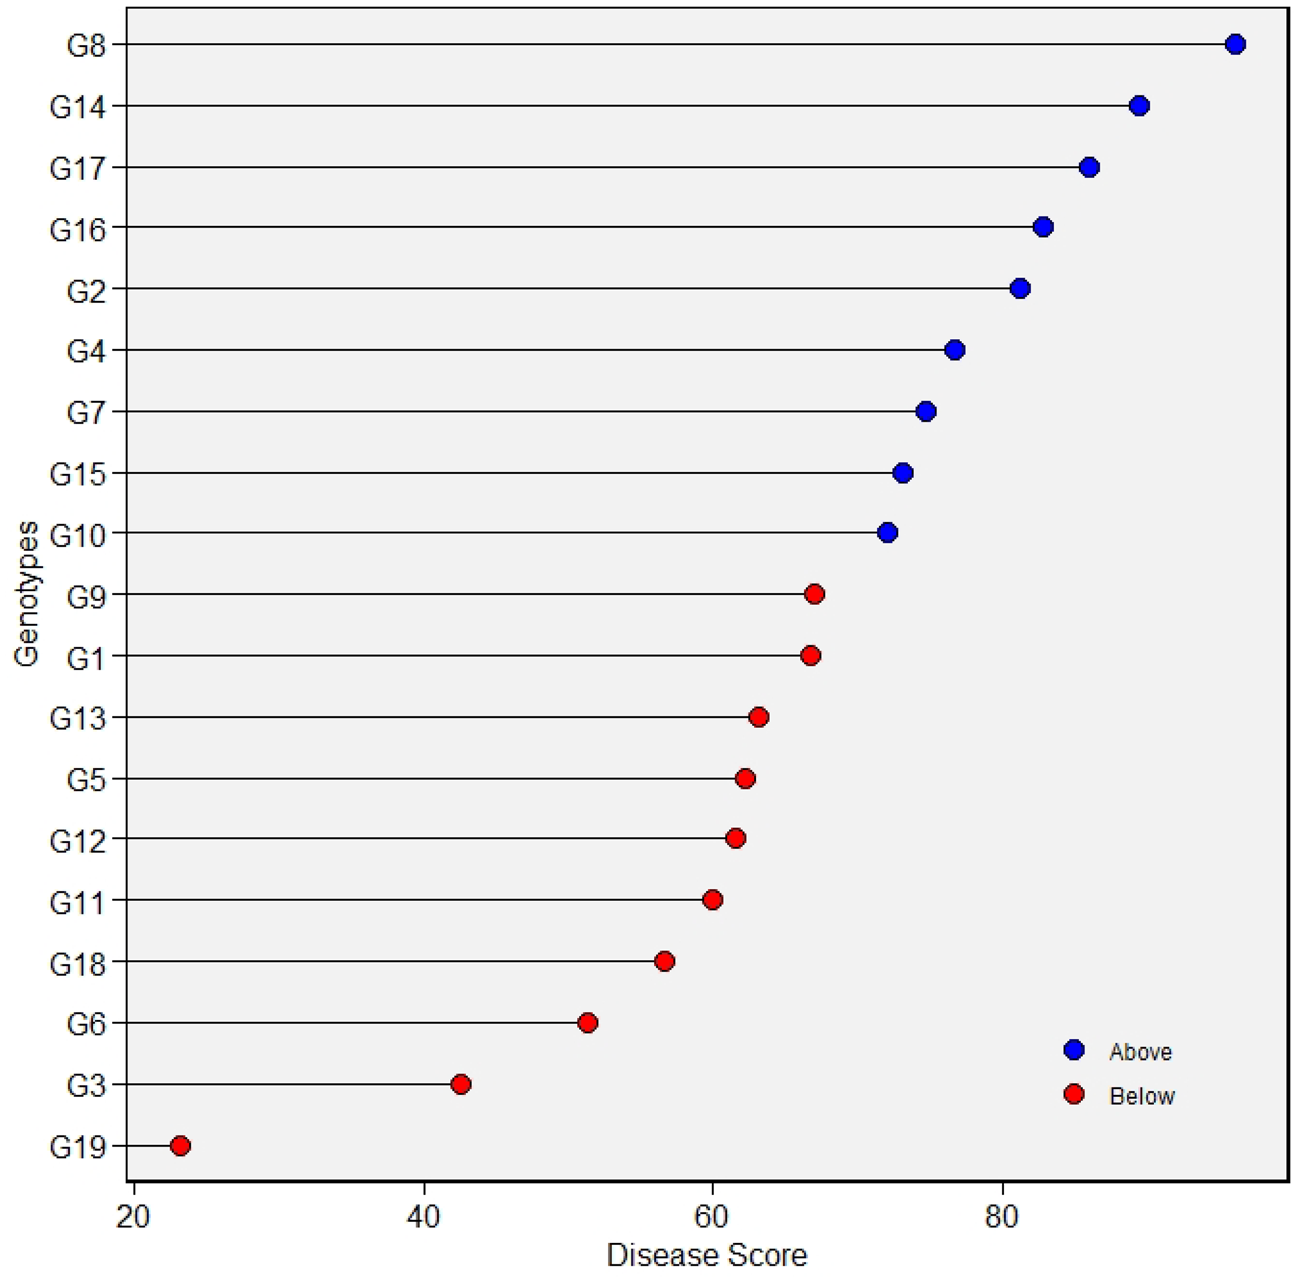
Simultaneous selection for resistance and stability has been carried out through WAASBY index (Table S4 and Fig. 5). G8 was found to have the highest WAASBY score (94.31) followed by G14 (89.43), G17 (86.00) and G16 (82.73). Genotype G19 was found to have the least WAASBY score (23.19) followed by G3 (42.54), G6 (51.39) and G18 (56.61). WAASBY scores of genotypes G8, G14, G17, G16, G2, G4, G7, G15 and G10 were higher than the mean and that of G19, G3, G6, G18, G11, G12, G5, G13, G1 and G9 were lower than the mean (Fig. 5).
Colour online. WAASBY scores of genotypes for anthracnose disease. G1-AMS 100-39, G2-AMS 2014-1, G3-BAUS 102, G4-DS 3108, G5-DSb 34, G6-KDS 992, G7-MACS 1493, G8-NRC 128, G9-NRC 131, G10-NRC 132, G11-NRC 136, G12-NRC 137, G13-NRCSL 1, G14-PS 1611, G15-PS 1613, G16-RSC 11-03, G17-RSC 11-07, G18-SKF-SPS-11 and G19-JS 335.

Association of climatic parameters with disease incidence and discriminative capacity of environments
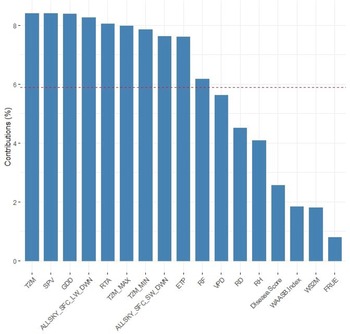
Association of climatic parameters with disease incidence and discriminative capacity of environments has been analysed through PCA. First two principal components (PCs) explained 69.8% of the total variation (Fig. 6). Climatic variable T mean at 2 m height has the highest contribution to the variation from the first two PCs, followed by the slope of saturation vapour pressure curve and growing degree-days (Fig. 7). Disease score was found to be positively associated with RH, wind speed at 2 m height (WS2M), effect of temperature on radiation use efficiency (FRUE) and global solar radiation based on latitude and Julian day (RTA) and negatively associated with insolation incident on a horizontal surface (ALLSKY_SFC_SW_DWN), evapotranspiration (ETP), rainfall (RF), rainy days (RD), the deficit of vapour pressure (VPD) and WAASB Index of environment (WAASB Index). WAASB Index was found to be associated with VPD, RD, RF, ETP and ALLSKY_SFC_SW_DWN and was negatively associated with FRUE, WS2M, RH and disease score.
Colour online. PCA of disease score and environmental WAASB indices against different climatic variables. T2M_MAX, T max at 2 m height; T2M_MIN, T min at 2 m height; T2M, T mean at 2 m height; WS2M, wind speed at 2 m height; ALLSKY_SFC_LW_DWN, downward thermal infrared radioactive flux; ALLSKY_SFC_SW_DWN, insolation incident on a horizontal surface; GDD, growing degree-days; FRUE, effect of temperature on radiation use efficiency; VPD, the deficit of vapour pressure; SPV, the slope of saturation vapour pressure curve; ETP, evapotranspiration; RTA, global solar radiation based on latitude and Julian day; Disease Score, mean disease score of environment; WAASB Index, WAASB Index of environment; RD, rainy days; RF, rainfall.

Colour online. Contribution of variables under study to the first two PCs. T2M, T mean at 2 m height; SPV, the slope of saturation vapour pressure curve; GDD, growing degree-days; ALLSKY_SFC_LW_DWN, downward thermal infrared radioactive flux; RTA, global solar radiation based on latitude and Julian day; T2M_MAX, T max at 2 m height; T2M_MIN, T min at 2 m height; ALLSKY_SFC_SW_DWN, insolation incident on a horizontal surface; ETP, evapotranspiration; RF, rainfall; VPD, the deficit of vapour pressure; RD, rainy days; RH, relative humidity; Disease Score, mean disease score of environment; WAASB Index, WAASB Index of environment; WS2M, wind speed at 2 m height; FRUE, effect of temperature on radiation use efficiency.

Discussion
Employing genetic resistance is the viable strategy for anthracnose disease management (Nagaraj et al., Reference Nagaraj, Jahagirdar and Basavaraja2014; Nataraj et al., Reference Nataraj, Shivakumar, Kumawat, Gupta, Rajput, Kumar, Sharma and Bhatia2020). Field-level resistance in case of anthracnose disease appears to be more appropriate as the genotypes are challenged with the disease under natural conditions where the crop is being grown. Attaining durable genetic resistance across locations is challenging due to variable virulence in the pathogenic populations (Thakur et al., Reference Thakur, Rao, Wu, Subbarao, Shetty, Singh, Lukose, Panwar, Sereme, Hess, Gupta, Dattar, Panicker, Pawar, Bhangale and Panchbhai2004), but is very crucial in attaining significant genetic gains through selection. The current study aimed at identifying stable resistance sources for anthracnose disease resistance sources across locations using a BLUP-based mixed model, WAASB. This is the first attempt to identify stable resistance donors and discriminating environments and to understand G × E interactions in case of soybean anthracnose. Predominance of G × E interaction contribution to the total variation indicated the importance of understanding G × E interaction patterns in breeding and selection for soybean anthracnose resistance in India. This is in accordance with the previous reports (Sharma et al., Reference Sharma, Babu, Ghosh, Telangre, Rathore, Kaur, Kushwaha, Das and Pande2013; Das et al., Reference Das, Palanna, Patro, Ganapathy, Kannababu, Kumar and Tonapi2021; Srivastava et al., Reference Srivastava, Saxena, Saabale, Raghuvanshi, Anandani, Singh, Sharma, Wasinikar, Sahni, Varshney, Singh and Dixit2021). Significant environmental effect is attributed to the variability in the pathogenic population prevailing in different environments. Significant genotypic effect indicates that the genotypes vary significantly for the genetic resistance against the pathogen. Although significant genotype and environment effect is attributed to differences in resistance genes in host and virulence genes in pathogen, respectively, the effect of environmental conditions on differential resistance responses of genotypes and on disease incidence cannot be ruled out (Kulakarni and Chopra, Reference Kulakarni and Chopra1982).
Identification of genotype with higher stability and lower disease severity is a key element in any durable disease resistance programme (Twizeyimana et al., Reference Twizeyimana, Ojiambo, Ikotun, Paul, Hartman and Bandyopadhyay2007). In the current study, PS 1611 (G14) was found to be highly stable with low disease incidence. Stable resistance in this genotype may be governed by multiple resistance genes which can avoid early resistance break. Such genotypes should be employed as a common parent across locations in combination with local resistant sources so as to broaden the genetic base of resistance, which further results in durable resistance (Villegas-Fernandez et al., Reference Villegas-Fernandez, Sillero, Emeran, Winkler, Raffiot, Tay, Flores and Rubiales2009).
The WAASBY superiority index accounts for both performance of the response trait (lower disease score is desirable in the study) and stability simultaneously to select superior genotypes. NRC 128 (G8) was found to be superior followed by PS 1611 (G14). Mean disease score of NRC 128 was less than the grand mean (Table 4) but was found to rank seventh in terms of stability (Table S4 and Fig. 4), which is due to its differential disease at Dharwad as compared to the remaining locations. At Dharwad, it showed susceptible disease reaction, whereas across the remaining locations, its disease reaction ranged from HR (Palampur) to MR (Indore) (Table S2). Therefore, NRC 128 can be the resistant source at all the locations under study, except Dharwad. In addition to anthracnose resistance, NRC 128 was found to be high yielding, wider adaptable and water logging tolerant (Annual Report, 2019) and was notified and released as a variety in northern plain zone and eastern zone of India. Therefore, this genotype can be a common parent in breeding for multiple economic traits. On the other hand, PS 1611 stood first in terms of stability and second in terms of superiority (Table S4 and Fig. 4); therefore, this can be a resistant source across all the locations. In addition to anthracnose resistance, it carries MYMV resistance (AICRPS Report, 2018) and therefore can be a common resistance source for both the diseases. Apart from these, genotype DSb 34 (G5) was found to be highly resistant at Medziphema and its reaction varied across the remaining locations from MR (Jabalpur) to HS (Indore) (Table S2). Similarly, BAUS 102 (G3) was found to be resistant at Indore, whereas, its disease reaction ranged from MR (Jabalpur) to HS (Palampur) across the other locations. These two genotypes could be elite resistant sources at respective locations. Intriguingly, no genotype was HR, R or MR at Dharwad and all the genotypes were within the range of MS to S (Table S2). Therefore, extensive germplasm screening must further be undertaken at this location to identify potential and stable resistance sources at this location.
Through PCA, disease incidence was found to be favoured by RH, WS2M, FRUE and RTA. The role of RH has been reported to be positively associated with anthracnose disease incidence (Yang and Hartman, Reference Yang and Hartman2015). On the other hand, the WAASB index is associated with VPD, RD, RF, ETP and ALLSKY_SFC_SW_DWN. Intriguingly, none of these variables has association with Indore location, which was found to be highly discriminative. Therefore, higher discriminative capacity of Indore location may be attributed to biological factors such as virulence of pathogenic population prevailing there.
Differential ranking of genotypes across different locations is an indication of presence of races of the pathogen (Villegas-Fernandez et al., Reference Villegas-Fernandez, Sillero, Emeran, Winkler, Raffiot, Tay, Flores and Rubiales2009). Therefore, a comprehensive race differentiation and development of host-differentials is an immediate research dimension for extensive understanding of host × pathogen interaction and for identification of race-specific resistance sources and race-specific genes. Among five locations, Indore was found to be highly discriminative with high disease pressure; therefore, initial large-scale germplasm screenings can be done at this location so as to reduce the size to a set of potential resistant donors. This set can further be evaluated extensively to select stable genotype and location-specific resistance sources and it would also be pertinent if the genotypes are tested artificially for resistance against the isolates from highly discriminating locations (Pande et al., Reference Pande, Sharma, Gaur, Basandrai, Kaur, Hooda, Basandrai, Babu, Jain and Rathore2013).
Conclusion
Through the present study, genotype PS 1611 (G14) was found to be a stable resistance source for soybean anthracnose disease across the five locations and genotype NRC 128 (G8) was found to be superior in terms of resistance at most of the locations. These two genotypes can be exploited in the anthracnose disease resistance programmes across India. Several genotypes were found to be highly resistant, specifically at one or two locations, and can be deployed as parents for location-specific resistance breeding programmes. Through PCA, disease score was found to be positively associated with RH, WS2M, FRUE and RTA. Indore was found to be a highly discriminating location with the highest mean disease incidence and large-scale initial screening can be done at this location.
Supplementary material
The supplementary material for this article can be found at https://doi.org/10.1017/S0021859622000016
Acknowledgements
The authors are grateful to the reviewer(s) for their suggestions which helped improving the quality of the manuscript
Financial support
The authors are grateful to ICAR-Indian Institute of Soybean Research, Indore, India for providing financial assistance to carry out the current research work.
Conflict of interest
None.
Ethical standards
Not applicable.