INTRODUCTION
Seagrass beds represent an important type of marine and estuarine habitat, but unfortunately they are experiencing a strong decline world-wide (Ralph et al., Reference Ralph, Tomasko, Seddon, Moore, Macinnis-Ng, Larkum, Orth and Duarte2006) and a further decrease is expected during this century, especially in non-developed countries (Duarte, Reference Duarte2002). Their regression may affect both the local and global biodiversity (Short & Neckles Reference Short and Neckles1999; Duarte Reference Duarte2002) due to changes in the characteristics of the environment with a decrease of types of microhabitats and of substrates, reduction of food sources and loss of shelter against predators for the associated species (Williams & Heck, Reference Williams, Heck, Bertness, Gaines and Hay2001). In extreme conditions, the regression of seagrass beds may result in unvegetated bottoms that will support different associated communities due to the loss of the mentioned seagrass attributes. Studies on the effects of seagrass declines have been carried out for most seagrass species and in different parts of the world (Hemminga & Duarte, Reference Hemminga and Duarte2000; Green & Short, Reference Green and Short2003). These types of studies are essential for understanding the ecological role of seagrasses in relation to the associated species as well as for a further management of these damaged habitats and their communities.
Molluscs are important components of the benthic macrofauna associated with seagrass beds in terms of number of species and abundance (Williams & Heck, Reference Williams, Heck, Bertness, Gaines and Hay2001). Moreover, molluscs are important organisms in the food webs of the seagrass bed system (Hemminga & Duarte, Reference Hemminga and Duarte2000); therefore changes in the composition and structure of the molluscan assemblage due to seagrass declines may affect other faunistic and floristic components of the seagrass/unvegetated bottom habitat. Studies on changes of mollusc assemblages are of importance for further understanding of changes at higher trophic levels in threatened habitats such as seagrass beds.
The southern Iberian Peninsula represents an area of faunistic confluence due to its location between the Atlantic Ocean, the Mediterranean Sea and northern Africa (Ekman, Reference Ekman1953). The Alboran Sea is located in this area and probably supports the highest marine biodiversity along European coasts (e.g. for molluscs: van Aartsen et al., Reference Van Aartsen, Menkhorst and Gittenberger1984; Gofas, Reference Gofas1999; Rueda et al., Reference Rueda, Salas and Gofas2000; Peñas et al., Reference Peñas, Rolán, Luque, Templado, Moreno, Rubio, Salas, Sierra and Gofas2006). In this area, beds of Zostera marina Linnaeus occur in open bays of the Mediterranean coasts (Málaga and Granada) at 6–17 m depth (Moreno & Guirado, Reference Moreno and Guirado2003; Barrajón et al., Reference Barrajón, Moreno, Pérez-Llorens, Luque and Templado2004; Rueda et al., Reference Rueda, Salas and Marina2008b), and they probably represent the deepest eelgrass beds of Europe. Some of these beds have experienced a strong decline during 2005 and 2006 as a consequence of, among other factors, illegal trawling activities by fishermen (Rodríguez & Cabrera, Reference Rodríguez and Cabrera2005; Rueda et al., Reference Rueda, Salas and Marina2008b). The information on the changes of some components of the associated community, such as the molluscan assemblage, due to eelgrass declines at this depth-range (12–14 m) is absent in the literature. There are however, some studies for much shallower eelgrass beds (<5 m) (Webster et al., Reference Webster, Rowden and Attrill1998; Attrill et al., Reference Attrill, Strong and Rowden2000; Bowden et al., Reference Bowden, Rowden and Attrill2001). This type of information is essential as a baseline for a future management of the remaining eelgrass meadows and for further studies on the recovery of the fauna to the original levels. The starting hypothesis of this study is that eelgrass loss will mainly affect those species associated with the leaf stratum and probably some of the sediment stratum. Nevertheless, the unvegetated sediments would still support a rich molluscan assemblage as a result of the biogeographical location and the bathymetry of these subtidal eelgrass beds.
MATERIALS AND METHODS
Study area
The study site is located on the Spanish coasts of the Alboran Sea, in the westernmost part of the Mediterranean Sea. This study was carried out in Cañuelo Bay (Cala de los Cañuelos) (36° 44.5′N–03° 47.6′W), which is included in the Marine Protected Area (MPA) ‘Paraje Natural Acantilados de Maro–Cerro Gordo’, located between the provinces of Málaga and Granada. In 2001, eelgrass beds were distributed along the coastline of this MPA at depths between 5 to 17 m, with the maximum coverage (97.3%) and shoot density in front of Cañuelo Bay at 12–14 m depth, where there was the largest Z. marina bed with around 38.8 hectares (Bañares-España et al., Reference Bañares-España, Báez, Casado, Díaz de Rada, Flores-Moya, Rey, García-Gómez and Finlayson2002). This eelgrass bed and adjacent ones experienced a strong decline during 2005–2006 due to illegal trawling activities (Table 1) and it was selected for the present study as it represented probably the most continuous and extensive bed within this stretch of coastline. No information is available on the distribution and characteristics of the remaining eelgrass meadows after the decline of 2005 and 2006.
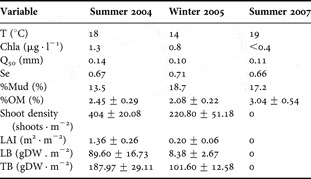
Eelgrass and environmental variables of the water column and sediment in summer 2004, winter 2005 and summer 2007. Mean±standard deviation. Chla, concentration of chlorophyll-a; LAI, leaf area index of eelgrass; LB, leaf biomass of eelgrass; %Mud, percentage of mud (<0.063 mm) in sediment; %OM, percentage of organic matter in sediment; Q50, median grain size; Se, selection coefficient; T, temperature; TB, total biomass of eelgrass (leaves + rhizomes).

The deep subtidal eelgrass beds of southern Spain are generally located in open bays and not in shallow lagoons as with most Mediterranean eelgrass beds (Mars, Reference Mars1966; Laugier et al., Reference Laugier, Rigollet and de Casabianca1999; Sfriso et al., Reference Sfriso, Birkemeyer and Ghetti2001; Guidetti et al., Reference Guidetti, Lorenti, Buia and Mazzella2002), so in this case the tidal influence and the wave action is minimal. In Cañuelo Bay, the most frequent coastal currents throughout the year are towards the east (called Poniente in this area). The surface water temperature ranges from 14–15°C in winter to 21–22°C in summer. The salinity of the water column is almost constant throughout the year due to the low fresh water input in the area.
Studies on the temporal dynamics and diel variation of the molluscan assemblages associated with these Z. marina beds were carried out before the decline experienced during 2005–2006 (Arroyo et al., Reference Arroyo, Salas, Rueda and Gofas2006; Rueda & Salas, Reference Rueda and Salas2008; Rueda et al., Reference Rueda, Urra and Salas2008c), and no further information on the associated assemblages has been given after the decline.
Samples collection and laboratory procedures
The samples were collected in the Zostera marina bed located in front of Cañuelo Bay at the depth of 12–14 m and in the same areas and depth-range after the strong decline that this eelgrass bed experienced. Sampling was carried out using SCUBA diving gear in summer 2004 (September) (with eelgrass) and summer 2007 (August) (without eelgrass). Nevertheless, data on environmental and eelgrass variables of winter 2005 (March) have also been given in Table 1 in order to show the strong eelgrass decline experienced between 2004 and 2005. Only the faunistic data of summer 2004 and summer 2007 were analysed and compared because the composition of the molluscan taxocoenosis is maximal during this season of the year (Rueda & Salas, Reference Rueda and Salas2008).
The environmental variables included those related to the: (1) water column; (2) sediment; and (3) phenology of Z. marina. The water column was characterized at the bottom (12–14 m depth) by the water temperature (T: °C) and chlorophyll-a concentration (Chla: μg . l−1). In each seasonal sampling, water samples of 1 l were collected and transported at dark and at low temperature to the laboratory and filtered onto GFC filters. The Chla was extracted using 100% acetone and the absorbance of the solution was measured with a spectrophotometer at 664 nm, 647 nm, 630 nm and 750 nm. These data were used for the Chla equation proposed by Jeffrey & Humphrey (Reference Jeffrey and Humphrey1975). Salinity was not measured as the seasonal variation of this variable is minimal and no fresh water inputs (i.e. streams and rivers) occur in the studied area.
The grain size distribution of the sediment (1 l of sediment in the sampled areas) and percentage of organic matter (6 replicates of 70 ml collected adjacent to collection of fauna per seasonal sampling) were also studied. The grain size distribution was obtained by sieving around 1000 g of dry sediment onto 63, 4, 2, 1, 0.5, 0.25, 0.125 and 0.063 mm and weighing the sediment retained in each fraction. With these data, the median grain size (Q50) was estimated and also the selection coefficient (Se) (Trask, Reference Trask1950). The classification of sediment types is based on that presented by Buchanan (Reference Buchanan, Holme and McIntyre1984) and the selection coefficient on that by Boillot (Reference Boillot1960). The mud percentage (%Mud) was calculated as the dry weight of sediment particles below 0.063 mm in relation to the total. The percentage of organic matter (%OM) in samples of dry sediment (80 g) was obtained from the weight loss on ignition at 560°C for 1 hour.
For estimations of the density of shoots of Zostera marina, shoots within a frame of 50 × 50 cm were counted in situ and data were expressed as shoots per square metre. A total of 5–6 density estimations was achieved in the eelgrass bed at 12–14 m in those different sampling times. In the same areas, eelgrass shoots, rhizomes/roots and sediment including the associated fauna were collected (down to 5 cm of sediment) using a quadrate of 25 × 25 cm (0.062 m2) and placed carefully in cloth bags (mesh size < 0.5 mm). A total of 6 replicates spread around 8–10 m from each other were taken each time in order to cover different areas within this eelgrass bed at this depth-range. All samples were transported to the laboratory at dark and at low temperature within 2–3 hours after collection.
Eelgrass shoots and rhizomes were separated from each sample and several measurements to the nearest mm were taken on every shoot such as the length between the base (junction with the rhizome) to the leaves junction and from this to the apex of each leaf. The width of each leaf was measured to the nearest 0.1 mm. Estimations of the leaf area index (LAI: leaf area per unit substratum area; m2 leaf. m−2 sediment) were made by assuming long rectangle shapes for the leaves (Phillips & McRoy, Reference Phillips and McRoy1990). For estimations of LAI, the area of each shoot contained in the sample was separately obtained and then added for obtaining the area of all shoots in each sample collected within the 25 × 25 cm quadrate.
Leaf biomass (LB) and rhizome biomass were obtained by drying at 60°C for 24–36 hours all leaves and rhizomes separately after being measured for biometric analyses and cleared of epibionts. The leaf and rhizome biomass values were expressed in g DW · m−2.
Molluscs contained in the eelgrass shoots and sediment samples collected with the quadrates were separated by sieving onto a 0.5 mm sieve and were stored in 70% ethanol. Each mollusc species was identified and their individuals counted on each sample. Small-size individuals (juveniles) of each species were counted separately from the adults in the samples. Remains of dead individuals (shells) for each species were also annotated quantitatively when occurring in the samples, especially in those of summer 2007.
Data analysis
The characterization of each species was done according to: (1) the species abundance (N: individuals. m−2); (2) the frequency index (Glémarec, Reference Glémarec1969) (%Fr: percentage of samples in which the species is present); and (3) the dominance index (Glémarec, Reference Glémarec1969) (%D: percentage of individuals of one particular species from the total).
The characterization of the taxocoenosis was obtained according to: (1) the species richness (S: number of species per sample); (2) diversity as indicated by the Shannon–Wiener index (H′) (Krebs, Reference Krebs1989); and (3) evenness index (J′) (Pielou, Reference Pielou1969). These ecological indices were calculated using the software PRIMER from the Plymouth Marine Laboratory, UK.
One-factor ANOVA (analysis of variance) analyses were carried out for testing the differences in the values of the species richness, abundance (for single species or total abundance of molluscs), diversity index and evenness between different groups of samples. This analysis was also performed for testing differences in some environmental variables (e.g. %OM, shoot density) between different seasons. Analyses to test the normality (Kolmogorov–Smirnov) and to verify the homogeneity of variances (Bartlett) were executed prior to ANOVA analyses. These statistical procedures were performed using the software SYSTAT 9 (SPSS).
The affinity of the molluscan taxocoenosis of each sample was measured using both (1) qualitative data (presence/absence) and (2) quantitative data (fourth root transformed abundance data) of species contained in each sample. The similarity index of Bray & Curtis (Reference Bray and Curtis1957) was used as a meaningful and robust measure (Clarke, Reference Clarke1993). Once obtained the similarities matrix, a cluster (using UPGMA) and a MDS was performed for both qualitative and quantitative similarities between the samples. Molluscan assemblages from different groups of samples (e.g. time of collection) were compared using an analysis of similarities (ANOSIM) which is a non-parametric analogue to a multivariate analysis of variance (MANOVA). ANOSIM compares ranked similarities between and within groups which were selected according to different factors (e.g. summer 2004 versus summer 2007). Moreover, a SIMPER (SIMilarity PERcentage) analysis was performed in order to evaluate the contribution of each species in the similarity/dissimilarity between those groups of samples collected in each season. Similar analyses were performed considering only the associated infaunal species in order to study the changes of these species in relation to the whole assemblage. These multivariate analyses were also executed using the PRIMER software.
RESULTS
Environmental variables
The water column displayed lower concentration of Chla in summer 2007 (without eelgrass) than in summer 2004 (high eelgrass density) and winter 2005 (low eelgrass density) (Table 1). The sediment could be classified as very fine sand according to Buchanan (Reference Buchanan, Holme and McIntyre1984) and was similar and rather homogeneous (Se between 0.66 and 0.71) in the different sampling times. Nevertheless, the Q50 values decreased in winter 2005 (0.10) and summer 2007 (0.11) compared to summer 2004 (0.14). This was related to the increase of mud in the sediment in winter 2005 (18.7% mud) and in summer 2007 (17.2%) in comparison to summer 2004 (13.5%). The percentage of organic matter in the sediment displayed significantly larger values in summer 2007 (without eelgrass) than in summer 2004 and winter 2005 (one-factor ANOVA: F = 10.60; N = 17; P < 0.005).
The shoot density, leaf and total biomass as well as the LAI of eelgrass displayed a significant decrease throughout time, resulting in the absence of eelgrass in all the samples of summer 2007 (one-factor ANOVA: shoot density: F = 275.06; N = 17; P < 0.001; leaf biomass: F = 141.01; N = 17; P < 0.001; total biomass: F = 152.65; N = 17; P < 0.001; LAI: F = 129.07; N = 17; P < 0.001). In summer 2007, the sediment contained high amounts of unidentified green filamentous algae that were absent in summer 2004. Remains of rotten rhizomes and seeds of eelgrass were also found in all those samples collected in summer 2007.
Faunistic composition and structure
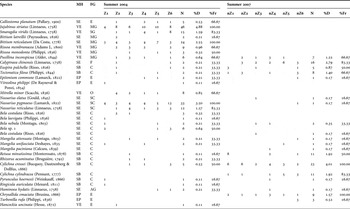
A total of 1515 individuals of molluscs belonging to 76 species were found (Table 2), of which 942 individuals belonging to 64 species were collected in the samples of summer 2004 (with eelgrass) and 573 individuals belonging to 50 species in summer 2007 (without eelgrass). In summer 2004, bivalves represented 78.66% of the individuals whereas this group represented 81.85% in summer 2007. In relation to the number of species, 54.69% were bivalves in summer 2004 and 62% in summer 2007. Therefore, a reduction of the number of species and individuals of gastropods in relation to bivalves occurred during the studied period.
Abundance (ind. 0.062 m−2) of mollusc species registered in samples of summer 2004 (with eelgrass) and summer 2007 (without eelgrass) in Cañuelo Bay. Total number of individuals (N), dominance (%D) and frequency (%Fr) of each species is also listed. Microhabitat (MH) and feeding guild (FG) of each species have also been included. Nomenclature based on CLEMAM (Check List of European MArine Mollusca) from the Muséum National d'Histoire Naturelle (Paris, France) and available at http://www.somali.asso.fr/clemam/index.clemam.fr. AG, macroalgae grazers; C, carnivores; D, deposit feeders; E, ectoparasites and specialized carnivores feeding on much larger organisms; EP, epibionts and ectoparasites; F, filter feeders; MG, microalgae or periphyton grazers; O, egg feeders; SB, organisms partly buried in soft bottoms; SC, scavengers; SE, soft bottom epifauna; SG, seagrass grazers; SI, soft bottoms infauna; SY, symbiont bearing species; VE, epifauna on vegetated substrates.

In summer 2004, the assemblage of molluscs was dominated by the bivalves Tellina distorta Poli, 1795 (18.26%), Anomia ephippium Linnaeus, 1758 (11.36%), Chamelea gallina (Linnaeus, 1758) (9.98%), Venerupis aurea (Gmelin, 1791) (7.11%) and Spisula subtruncata (Da Costa, 1778) (6.79%) and the gastropods Jujubinus striatus (Linnaeus, 1758) (4.88%), Nassarius pygmaeus (Lamarck, 1822) (3.50%), Bittium reticulatum (Da Costa, 1778) (2.55%) and Smaragdia viridis (Linnaeus, 1758) (1.59%), among others (Table 2). These species displayed a frequency of occurrence of more than 80% in the samples of summer 2004. In summer 2007 (after the eelgrass decline), the dominant bivalves were C. gallina (21.47%), S. subtruncata (10.82%), Kurtiella bidentata (Montagu, 1803) (10.30%), T. distorta (8.20%) and Tellina fabula Gmelin, 1791 (6.81%) and the dominant gastropods were Cylichna crossei Bucquoy, Dautzenberg and Dollfus, 1886 (4.01%), Calyptraea chinensis (Linnaeus, 1758) (2.79%), Retusa minutissima (Monterosato, 1878) (1.92%) and Cylichna cylindracea (Pennant, 1777) (1.92%). These species were also the most frequent in summer 2007, with values of more than 80%. Nevertheless, some frequent species (occurring in more than 50% of the samples) in the eelgrass bed in summer 2004 were completely absent in the samples of summer 2007 (Fr = 0%), such as the peryphiton grazers J. striatus and Rissoa membranacea (Adams J., 1800), the seagrass feeder S. viridis or the egg feeder Mitrella minor (Scacchi, 1836) as well as the infaunal bivalve Solemya togata (Poli, 1795). Moreover, remains of shells of these species were abundant in the tanatocoenosis of those samples (>20 shells. sample−1) from summer 2007.
The density of molluscs was significantly lower in summer 2007 (1528±441.18 ind. m−2) than in summer 2004 (2512±683.11 ind. m−2) (one-factor ANOVA: F = 8.78; N = 12; P <0.05) (Figure 1A). Between summer 2004 and summer 2007, a decrease in the percentage of gastropods (from 21.34% to 18.15%) was registered as well as in the abundance of epifaunal species (from 34.50 to 21.81%), especially of those associated with vegetated substrates (eelgrass and macroalgae) (from 9.34 to 1.22%).
Changes in the composition and structure of the molluscan assemblage between summer 2004 (with Zostera marina) and summer 2007 (without Z. marina); (A) abundance of molluscs (ind. m−2) in relation to groups of species and their inhabited microhabitat within the eelgrass bed; (B) species richness in relation to groups of species and their inhabited microhabitat within the eelgrass bed; (C) diversity of Shannon–Wiener (H′) (solid bar) and evenness (J′) (empty bar). Mean ± standard deviation. EP, epibionts and ectoparasites; SB, species that live partly buried in the sediment; SE, epifauna of soft bottoms; SI, infauna of soft bottoms; VE, epifauna of vegetated substrates (eelgrass or macroalgae).

Regarding feeding guilds, filter feeders (50–55%) and deposit feeders (around 26%) dominated with a similar contribution in both assemblages of summer 2004 and 2007. Nevertheless, a decrease in the percentage of microalgal grazers (from 9.55% to 1.22%), scavengers (from 4.78% to 0.35%) and the disappearance of seagrass grazers and egg feeders was registered in summer 2007. On the other hand, an increase of the percentage of carnivores (from 3.18% to 11.34%) occurred in summer 2007 when compared to 2004.
Changes in the density of some molluscan species occurred between summer 2004 (with Zostera marina) and summer 2007 (without Z. marina). Some species declined completely in summer 2007 and therefore displayed significant differences in their density values, such as the gastropods Jujubinus striatus (one-factor ANOVA: F = 64.51; N = 12; P < 0.001), Smaragdia viridis (one-factor ANOVA: F = 8.12; N = 12; P < 0.05), Bittium reticulatum (one-factor ANOVA: F = 40.00; P < 0.001), Rissoa membranacea (one-factor ANOVA: F = 9.0; N = 12; P < 0.05) as well as the bivalve Solemya togata (one-factor ANOVA: F = 7.35; N = 12; P < 0.05). Other species were present in the area but displayed significant lower densities in summer 2007 (without eelgrass) such as the gastropod Nassarius pygmaeus (one-factor ANOVA: F = 12.13; N = 12; P < 0.01) and the bivalves Anomia ephippium (one-factor ANOVA: F = 22.08; N = 12; P < 0.001) and Tellina distorta (one-factor ANOVA: F = 18.76; N = 12; P < 0.001). Conversely, other species increased their density in the unvegetated bottoms in summer 2007 such as the gastropods Cylichna cylindracea (one-factor ANOVA: F = 5.99; N = 12; P < 0.05), C. crossei (one-factor ANOVA: F = 11.41; N = 12; P < 0.01) and the bivalve Nucula nitidosa Winckworth, 1930 (one-factor ANOVA: F = 7.86; N = 12; P < 0.05). Finally, some of the dominant infaunal species did not display any significant changes in their density between summer 2004 and summer 2007, such as the bivalves Chamelea gallina (one-factor ANOVA: F = 1.66; N = 12; P > 0.05), Spisula subtruncata (one-factor ANOVA: F = 0.02; N = 12; P > 0.05), T. fabula (one-factor ANOVA: F = 0.53; N = 12; P > 0.05), T. planata Linnaeus, 1758 (one-factor ANOVA: F = 3.29; N = 12; P > 0.05), Thracia villosiuscula (Macgillivray, 1827) (one-factor ANOVA: F = 0.12; N = 12; P > 0.05) and Donax venustus Poli, 1795 (one-factor ANOVA: F = 1.00; N = 12; P > 0.05).
The species richness of molluscs was significantly lower in summer 2007 (25.83±2.64 spp. sample−1) than in summer 2004 (31.67±5.82 spp. sample−1) (one-factor ANOVA: F = 5.0; N = 12; P < 0.05), with a strong decrease in the number of species of gastropods (from 29 spp. to 19 spp.), especially of those associated with vegetated substrates (from 7 spp. to 1 sp.) and also with the sediment (from 20 spp. to 12 spp.) (Figure 1B). Regarding feeding guilds, the filter feeders, carnivores and deposit feeders were the groups with the highest number of species and displayed similar values in summer 2004 and 2007. From summer 2004 to summer 2007, the microalgae grazers showed the strongest reduction in the number of species (6 spp. to 1 sp.) and the seagrass feeders and egg feeders were absent in summer 2007 (without eelgrass).
The values of the diversity index of Shannon–Wiener were similar in summer 2004 (4.06±0.25 bits) and in summer 2007 (3.95±0.20 bits) and no significant differences were observed among years (one-factor ANOVA: F = 0.73; N = 12; P > 0.05) (Figure 1C). The evenness values were also similar in 2004 (0.82±0.03) and 2007 (0.84±0.03) and no significant differences on the values were observed (one-factor ANOVA: F = 1.49; N = 12; P > 0.05) (Figure 1C).
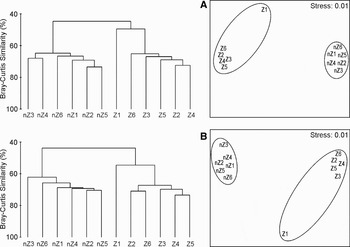
In both the cluster and MDS, groups of samples (replicates) collected in different sites within the eelgrass bed mostly clustered according to the time of collection based on qualitative data (presence/absence of species) (Figure 2A). The molluscan composition between samples of summer 2004 and 2007 was significantly different according to ANOSIM analyses (RANOSIM = 0.91; P < 0.005). The contribution of different species to these inter-annual differences was evaluated using SIMPER. Differences between summer 2004 and summer 2007 (average dissimilarity = 55.33%) were related to the absence or lower presence of some species: (1) in 2007, such as the gastropods Jujubinus striatus, Bittium reticulatum, Nassarius pygmaeus, Rissoa membranacea, Smaragdia viridis, Calliostoma planatum (Pallary, 1900) or Mitrella minor and the bivalves Solemya togata, Anomia ephippium or Venerupis aurea; and (2) in 2004, such as the gastropods Cylichna cylindracea, C. crossei or Chrysallida emaciata (Brusina, 1866) and the bivalves Lucinella divaricata (Linnaeus, 1758), Nucula nitidosa or Nuculana pella (Linnaeus, 1767).
Cluster and MDS analyses of samples of molluscs from summer 2004 (Z) (with eelgrass) and summer 2007 (nZ) (without eelgrass) using the Bray–Curtis similarity index; (A) presence/absence of species (qualitative data); (B) fourth root transformed abundance of molluscs (quantitative data). Encircled samples represent groups displaying similarity values of more than 50%.

Using quantitative data (fourth root transformed abundance), similar results were obtained in both the cluster and MDS, with separate groups of samples from summer 2004 and summer 2007 (Figure 2B). The molluscan composition and structure in these groups of samples were also significantly different according to different years (RANOSIM = 0.99; P < 0.005). Using SIMPER analyses, differences between summer 2004 and summer 2007 (36.73%) were related to the lower abundance in: (1) summer 2007 of bivalves such as Anomia ephippium, Venerupis aurea, Tellina distorta, Solemya togata or Dosinia lupinus (Linnaeus, 1758) and gastropods such as Jujubinus striatus, Bittium reticulatum, Nassarius pygmaeus, Rissoa membranacea or Smaragdia viridis; and (2) summer 2004 of bivalves such as Lucinella divaricata, Nucula nitidosa or Kurtiella bidentata and gastropods such as Cylichna cylindracea, Cylichna crossei, Chrysallida emaciata or Calyptraea chinensis.
Similar analyses were performed using only data of the infaunal species because epifaunal species were expected to change due to eelgrass loss and that may strongly influence the final results for the whole assemblage. In fact, when considering only infaunal species, the changes on the assemblage were less acute. Using qualitative data (presence/absence), the cluster did not display groupings of samples (replicates) according to time of collection, with most samples of 2004 and 2007 clustered together (Figure 3A). Nevertheless, samples from summer 2004 were positioned on opposite sides of the MDS to those from summer 2007. The infaunal composition between samples of summer 2004 and 2007 was significantly different according to ANOSIM analyses (RANOSIM = 0.49; P < 0.01). The contribution of different species to these inter-annual differences was evaluated using SIMPER. Differences between summer 2004 and summer 2007 (average dissimilarity = 36.73%) were related to the absence or lower presence of some species: (1) in 2007, such as the bivalves Solemya togata, Venerupis aurea or Ervilia castanea (Montagu, 1803); and (2) in 2004, such the bivalves Lucinella divaricata, Nucula nitidosa or Nuculana pella.
Cluster and MDS analyses of samples of infaunal molluscs from summer 2004 (Z) (with eelgrass) and summer 2007 (nZ) (without eelgrass) using the Bray–Curtis similarity index; (A) presence/absence of species (qualitative data); (B) fourth root transformed abundance of molluscs (quantitative data). Encircled samples represent groups displaying similarity values of more than 65%.

Using quantitative data (fourth root transformed abundance), samples of infauna from summer 2004 and summer 2007 were grouped separately in both the cluster and MDS (Figure 3B). The composition and structure of the infauna in these groups of samples were also significantly different according to different years (RANOSIM = 0.77; P < 0.005). Using SIMPER analyses, differences between summer 2004 and summer 2007 (38.38%) were related to the lower abundance in: (1) summer 2007 of bivalves such as Venerupis aurea, Dosinia lupinus, Tellina distorta, Solemya togata or Ervilia castanea; and (2) summer 2004 of bivalves such as Lucinella divaricata, Kurtiella bidentata, Tellina planata or Nucula nitidosa.
DISCUSSION
Eelgrass loss in Cañuelo Bay (southern Spain) has resulted in a decrease of the number of associated mollusc species (from 64 species in summer 2004 to only 50 species in summer 2007), which is the general trend of comparative studies of vegetated and unvegetated adjacent areas (Currás et al., Reference Currás, Sánchez-Mata and Mora1993; Boström & Bonsdorff, Reference Boström and Bonsdorff1997; Hily & Boutielle, Reference Hily and Bouteille1999; Turner & Kendall, Reference Turner and Kendall1999) or of studies on fragmentation and decline of shallow eelgrass beds (Webster et al., Reference Webster, Rowden and Attrill1998; Attrill et al., Reference Attrill, Strong and Rowden2000; Bowden et al., Reference Bowden, Rowden and Attrill2001). Nevertheless, the species richness of the molluscan taxocoenosis of the present unvegetated bottoms in Cañuelo Bay (around 25 spp. 0.062 m−2) is still higher than in adjacent unvegetated bottoms in other areas of Europe (generally less than 15 spp.). Molluscan assemblages with high numbers of species is a common feature in different types of habitats in the Alboran Sea and Ibero-Moroccan Gulf when compared to similar ones in other locations of Europe (Rueda et al., Reference Rueda, Fernández-Casado, Salas and Gofas2001; Rueda & Salas, Reference Rueda and Salas2003a, Reference Rueda and Salasb, Reference Rueda and Salas2008; Peñas et al., Reference Peñas, Rolán, Luque, Templado, Moreno, Rubio, Salas, Sierra and Gofas2006). This is mostly related to its biogeographical location between the Atlantic Ocean and the Mediterranean Sea and between Europe and Africa, promoting the coexistence of species from these different biogeographical areas. Due to the geographical and bathymetrical characteristics (12–14 m depth) of the eelgrass beds of the Alboran Sea, the associated molluscan assemblages before the eelgrass decline were probably the most diverse and complex ones in comparison to other eelgrass beds of Europe (Rueda et al., submitted).
Loss of the phytal stratum of a seagrass bed mainly affects those species that inhabit or use this microhabitat during some periods of its life cycle, as found in this study for the periphyton grazers Jujubinus striatus (the dominant epifaunal species), Rissoa membranacea and R. monodonta, carnivores feeding on epibionts such as Calliostoma planatum and the egg feeder Mitrella minor, which feeds on the abundant egg masses attached to eelgrass leaves such as those of the dominant J. striatus (Rueda et al., Reference Rueda, Marina, Salas and Urra2008a). The leaf stratum represents one of the few types of hard substrates that is available in seagrass beds occurring in soft bottoms (e.g. Cymodocea nodosa Ucria (Ascherson) and Zostera marina), increasing the available surface for settlement and growth of other consumable organisms (e.g. epibionts, epiphytes and microalgae) or for laying the egg masses of the associated epifaunal species whether inhabiting the leaf (e.g. J. striatus and Smaragdia viridis) or sediment stratum (e.g. Nassarius reticulatus (Linnaeus, 1758) and N. pygmaeus). Therefore, disappearance of eelgrass does not only represent losing the eelgrass/plant itself but also losing an abundant and essential type of hard substrate for the settlement, growth and reproduction of the associated species. Indeed, some of the phytal molluscs occurring in seagrass beds may inhabit other vegetated substrates with similar architectural features (e.g. foliose macroalgae and other seagrass species) (Peduzzi, Reference Peduzzi1987; Rueda & Salas, Reference Rueda and Salas2003b) and even artificial seagrass units (Moksnes et al., Reference Moksnes, Gullström, Tryman and Baden2008), so their strict dependence on the seagrass species is questionable. This is not the case for the decline observed in the neritid Smaragdia viridis in summer 2007 (without eelgrass), because the epidermal tissues of Z. marina and those of C. nodosa represent its only food sources in the Mediterranean Sea, so this gastropod is strictly dependent on these plants (Rueda & Salas, Reference Rueda and Salas2007). A further decline of these two seagrass species may result in the local extinction of this unique European seagrass feeder in some impacted areas in southern Spain or in other areas of the Mediterranean Sea. This type of decline has already been mentioned in the literature for other seagrass feeders such as the gastropod Lottia alveus (Conrad, 1831), which experienced declines in its populations together with the extinction of one subspecies (e.g. L. alveus alveus) that inhabited the Atlantic coasts of North America (Carlton et al., Reference Carlton, Vermeij, Lindberg, Carlton and Dudley1991). In that case, the extinction was related to the catastrophic decline of Z. marina in the early 1930s which was caused by the slime mould Labyrinthula zosterae Porter & Muehlstein. In this study, eelgrass loss is attributed to the illegal trawling, which probably produced cascade effects on the physiology of the plant and on the characteristics of the water column and sediment. This finally resulted in the disappearance of the aforementioned phytal gastropods as well as of other invertebrate species (e.g. Hippolyte spp.) and fish (e.g. Opeatogenys gracilis (Canestrini, 1864)) that are strictly associated with the eelgrass leaf stratum (Marina & Rueda, personal observation).
An unexpected decrease of scavengers (e.g. Nassarius pygmaeus and N. reticulatus) and of some deposit feeders (e.g. Tellina distorta) occurred after the disappearance of Z. marina in some areas of Cañuelo Bay. In fact, the content of organic matter in the sediment increased during the eelgrass decline (Table 1), probably as a result of the decomposition of dead eelgrass remains (e.g. rhizomes and sheaths) and other organisms, representing a potential food source to be consumed by these trophic groups. Probably, some scavengers benefited by the flux of newly dead organisms from the leaf stratum to the sediment when eelgrass shoots covered the sediment and the organic matter contained in the unvegetated sediment once eelgrass disappeared may be of poor quality for this feeding guild. Moreover, eelgrass shoots offered a perfect substrate (e.g. sheaths and leaves) for the deposition of the egg capsules of some scavenger species such as the nassarids (Rueda, Reference Rueda2007). On the other hand, deposit feeding organisms normally experience an increase of their density in vegetated bottoms when compared to unvegetated ones (Turner & Kendall, Reference Turner and Kendall1999) and a similar increasing trend of deposit feeders in relation to the organic content of the sediment was registered inside the eelgrass bed (Rueda & Salas, Reference Rueda and Salas2008). Nevertheless, not all deposit feeding organisms may respond in the same way to eelgrass loss such as found in this study for T. distorta (decreasing its density after eelgrass loss), Nucula nitidosa (increasing its density after eelgrass loss) or T. fabula and T. planata (without changes in their densities). Reductions in the density of some bivalve species in fragmented and small eelgrass meadows and unvegetated areas have also been attributed to an increased risk of predation (Irlandi, Reference Irlandi1997; Frost et al., Reference Frost, Rowden and Attrill1999), which may represent an important factor affecting the assemblages of these recent unvegetated bottoms of Cañuelo Bay.
In general, the changes in the composition and structure of the studied assemblages were more acute for epifaunal species than for infaunal ones as it has been observed in studies on the effects of fragmentation in shallow eelgrass beds (Webster et al., Reference Webster, Rowden and Attrill1998; Frost et al., Reference Frost, Rowden and Attrill1999). In general, the infaunal molluscs showed a decrease on the total abundance but the composition and trophic structure did not change strongly after eelgrass loss. A similar decreasing trend in the abundance was observed for infaunal species in shallow eelgrass beds according to size of the eelgrass patch and within-patch location and that was related to sediment characteristics (Bowden et al., Reference Bowden, Rowden and Attrill2001). But, some infaunal species strongly associated with seagrass beds were not found after loss of eelgrass in Cañuelo Bay such as the bearing symbiont bivalve Solemya togata. Changes in the redox characteristics of the less consolidated unvegetated sediments are probably responsible for its decline, because this bivalve is generally associated with anoxic sediments that are rich in sulphide which is used by the symbiont bacteria located in its ctenidia (Reid, Reference Reid, Beesley, Ross and Wells1998). For that reason, the sediments covered by seagrasses generally represent one of the preferred types of habitats by different species of the family Solemyidae around the world.
Seagrass beds are subjected worldwide to anthropogenic stresses such as eutrophication (Moore & Short, Reference Moore, Short, Larkum, Orth and Duarte2006; Ralph et al., Reference Ralph, Tomasko, Seddon, Moore, Macinnis-Ng, Larkum, Orth and Duarte2006) or illegal boat activities (e.g. trawling) (Fonseca et al., Reference Fonseca, Thayer and Chester1984; De Jonge & de Jong, Reference De Jonge and De Jong1992; Orth et al., Reference Orth, Fishman, Wilcox and Moore2002; Neckles et al., Reference Neckles, Short, Barker and Kopp2005). Illegal trawling in eelgrass beds of southern Spain was first documented by Bañares-España et al. (Reference Bañares-España, Báez, Casado, Díaz de Rada, Flores-Moya, Rey, García-Gómez and Finlayson2002) from characteristic dredging marks on the sea bottom using sonar scanning. Further eelgrass losses were also registered in other areas along the coasts of Málaga and Granada in late 2005 and 2006, probably as a result of the continued trawling activities (Rodríguez & Cabrera, Reference Rodríguez and Cabrera2005; Rueda et al., Reference Rueda, Salas and Marina2008b). Shell fisheries and dredging affect the survival of seagrass beds directly (e.g. seagrass removal, dispersal or burial) and indirectly (e.g. higher impact of being infected by pathogens) (Duarte, Reference Duarte2002; Erftemeijer & Robin Lewis, Reference Erftemeijer and Robin Lewis2006), further causing the decline of some components of the eelgrass community as found in this study. The local government has recently developed a strategic programme for protecting these last and highly threatened subtidal eelgrass beds by placing protective reefs along the coast, especially in front of vegetated areas, and by increasing patrols in those affected areas located within MPAs. Nevertheless, the decline of this type of habitat and its associated highly diverse fauna is already a fact. Little is known on the time needed for the recovery of the eelgrass beds in Cañuelo Bay and in other areas of southern Spain since growth rate of this seagrass at this depth-range is unknown. Unfortunately, remains of rotten seeds and of rotten eelgrass rhizomes were found in the sediment collected in 2007, so recovery of the previous eelgrass bed via seed germination or vegetative reproduction is unlikely. Moreover, no further mapping of the remaining eelgrass meadows has been done so far so information on the level of fragmentation of the eelgrass beds is absent. Some of these remaining eelgrass beds are not located inside MPAs and they are still highly threatened by illegal fishery activities and development of coastal infrastructures (e.g. harbours, marinas and dredging for beach regeneration) (Urra et al., Reference Urra, Marina and Rueda2008). Considering the current status of these types of habitat and the current and expected threats, a strong conservation effort should be made by the local and national government for their future preservation because they are probably the last eelgrass beds in southern Spain and they support the most diverse faunistic communities associated with eelgrass beds in Europe.
ACKNOWLEDGEMENTS
We are grateful to Serge Gofas from the University of Málaga (UMA) for his helpful comments on this work, to Elena Bañares-España and Antonio Flores from UMA for data on the distribution of Zostera marina in the MPA ‘Acantilados de Maro–Cerro Gordo’, to Antonio Pulido (Director of the MPA, Junta de Andalucía) for sampling permissions and to Ignacio Arroyo and Nieves Bravo (NNPs.c., Gestión Medioambiental y Trabajos Submarinos) for their help during the sampling programme. The Spanish MEC has financially supported this study with DGICYT funds, Project PB97-1116 ‘Estudio de la macrofauna de los fondos de fanerógamas marinas, Zostera y Cymodocea, del Sur de España’.