INTRODUCTION
Age and Alzheimer’s disease (AD)-related neural decline negatively affect multiple aspects of cognition, such as episodic memory (memory for specific personal past events), executive function (ability to plan, inhibit responses, and sustain attention), and processing speed (Buckner, Reference Buckner2004; Salthouse, Reference Salthouse2010; Tromp, Dufour, Lithfous, Pebayle, & Després, Reference Tromp, Dufour, Lithfous, Pebayle and Després2015). Yet, there is substantial variability in aging, and multiple factors have been shown to accelerate or mitigate cognitive decline. For instance, studies have shown that cardiometabolic variables such as body mass index (BMI; Farooqui, Farooqui, Panza, & Frisardi, Reference Farooqui, Farooqui, Panza and Frisardi2012; Yaffe et al., Reference Yaffe, Kanaya, Lindquist, Simonsick, Harris, Shorr and Newman2004), inflammatory indicators such as c-reactive protein (CRP; Yaffe et al., Reference Yaffe, Kanaya, Lindquist, Simonsick, Harris, Shorr and Newman2004), neurotrophic/growth factors such as brain-derived neurotrophic factor (BDNF; Lista & Sorrentino, Reference Lista and Sorrentino2010; Miranda, Morici, Zanoni, & Bekinschtein, Reference Miranda, Morici, Zanoni and Bekinschtein2019), and blood and cerebrospinal fluid (CSF) biomarkers such as plasma tau and CSF Aß1–42 are associated with cognition and AD risk (Chiu et al., Reference Chiu, Chen, Chen, Yang, Yang, Tseng and Horng2014; Diniz, Pinto, & Forlenza, Reference Diniz, Pinto and Forlenza2008; Matura et al., Reference Matura, Köhler, Reif, Fusser, Karakaya, Scheibe and Pantel2019).
These variables and their link to cognition are typically examined in isolation, rather than simultaneously within the same study. Therefore, there is limited knowledge of the relative strength of associations between cognition and cardiometabolic, inflammation, neurotrophic/growth factors, and AD biomarkers. One exception is a study conducted by Meyer and colleagues (Reference Meyer, Savard, Poirier, Morgan and Breitner2019), which assessed neurotrophic/growth factors, inflammatory indicators, and AD biomarkers in cognitively normal, Mild Cognitive Impairment (MCI), and AD participants. Machine learning techniques were used to create predictor weights for both CSF proteins and AD biomarkers, which were subsequently used in three separate regression models predicting general cognitive function. They found that CSF protein and AD biomarkers accounted for 31% and 26% of the variance in cognitive scores, respectively (P.-F. Meyer, Savard, Poirier, Morgan, & Breitner, Reference Meyer, Savard, Poirier, Morgan and Breitner2019). However, this study did not examine metrics associated with cardiometabolic risk, which are linked to cognition and dementia risk, and did not assess specific domains of cognitive function, which are known to be differentially impacted by aging and AD.
The goal of the current study was to address a gap in the literature by using a multivariate analysis to map associations between domain-specific cognitive function and multiple AD biomarkers, neurotrophic/growth factors, inflammatory markers, and cardiometabolic metrics in older adults with MCI. The Alzheimer’s Disease Neuroimaging Initiative Phase 1 (ADNI1) was used to obtain data on modifiable health factors (such as those associated with cardiometabolic health: BMI and cholesterol), stress (e.g., cortisol), inflammation (e.g., CRP), neuroprotection (e.g., BDNF), and AD biomarkers (e.g., CSF Aß1–42, plasma tau) in a cohort of older adults diagnosed with MCI. We implemented a Partial Least Squares Correlational (PLSC) analysis, an unbiased and flexible multivariate technique for defining latent variables in a dataset, that does not require assigned predictor and outcome variables, but rather maps shared covariance between two sets of data (Abdi & Williams, Reference Abdi, Williams, Reisfeld and Mayeno2013). Broadly, latent variables are linear combinations of variables from a data table optimized for a specific goal. In the case of PLSC, latent variables are optimized to maximize covariance between two sets of data with the goal of finding shared information between them (Abdi & Williams, Reference Abdi, Williams, Reisfeld and Mayeno2013). PLSC analysis was preferred to other multivariate or data-driven statistical approaches because it does not attempt to predict an outcome, making it an ideal fit for this cross-sectional data and the exploratory nature of our research question. Additionally, unlike multiple linear regression, PLSC analysis is well equipped to deal with a large number of variables or with multiple collinear variables (Van Roon, Zakizadeh, & Chartier, Reference Van Roon, Zakizadeh and Chartier2014) and data do not need to be normally distributed (Van Roon et al., Reference Van Roon, Zakizadeh and Chartier2014). Thus, PLSC analysis was employed to identify and parse novel relationships across these identified physiological domains and cognition in a cohort of older adults with MCI.
METHODS
Participants
Participants with a diagnosis of MCI from the ADNI1 cohort were included in the current study. Full participant inclusion/exclusion criteria are available in the ADNI Procedures Manual, 2010, and are summarized here: 6th grade or higher education, fluent in English or Spanish, Mini Mental State Examination (MMSE) ≥ 24, Clinical Dementia Rating of .5, subjective memory complaint by subject or study partner, impaired episodic memory, and sufficiently preserved general cognition and functional performance not meeting criteria for AD. Participants with missing data for any variables of interest were excluded, as complete data were necessary for PLSC analysis. One participant classified as MCI with an MMSE score of 23 and one participant with an extremely high and improbable triglycerides value (2084.0 mg/dL) were excluded. The final analysis sample included 154 MCI participants (age: 54.4–88.3 years; Mean = 74.1 years; SD = 7.5 years; education: 6–20 years; Mean = 16.0 years; SD = 2.9 years; 51 females; 150 White, 2 Asian, 2 Black; 67 APOE ɛ4 negative). Other ADNI cohorts (ADNIGO, ADNI2, and ADNI3) were excluded from the analysis as these cohorts did not assess neurotrophic and growth factors. Study procedures were approved by site-specific Institutional Review Boards, and all participants and/or authorized representatives provided written informed consent consistent with the Declaration of Helsinki.
Neuropsychological Assessment
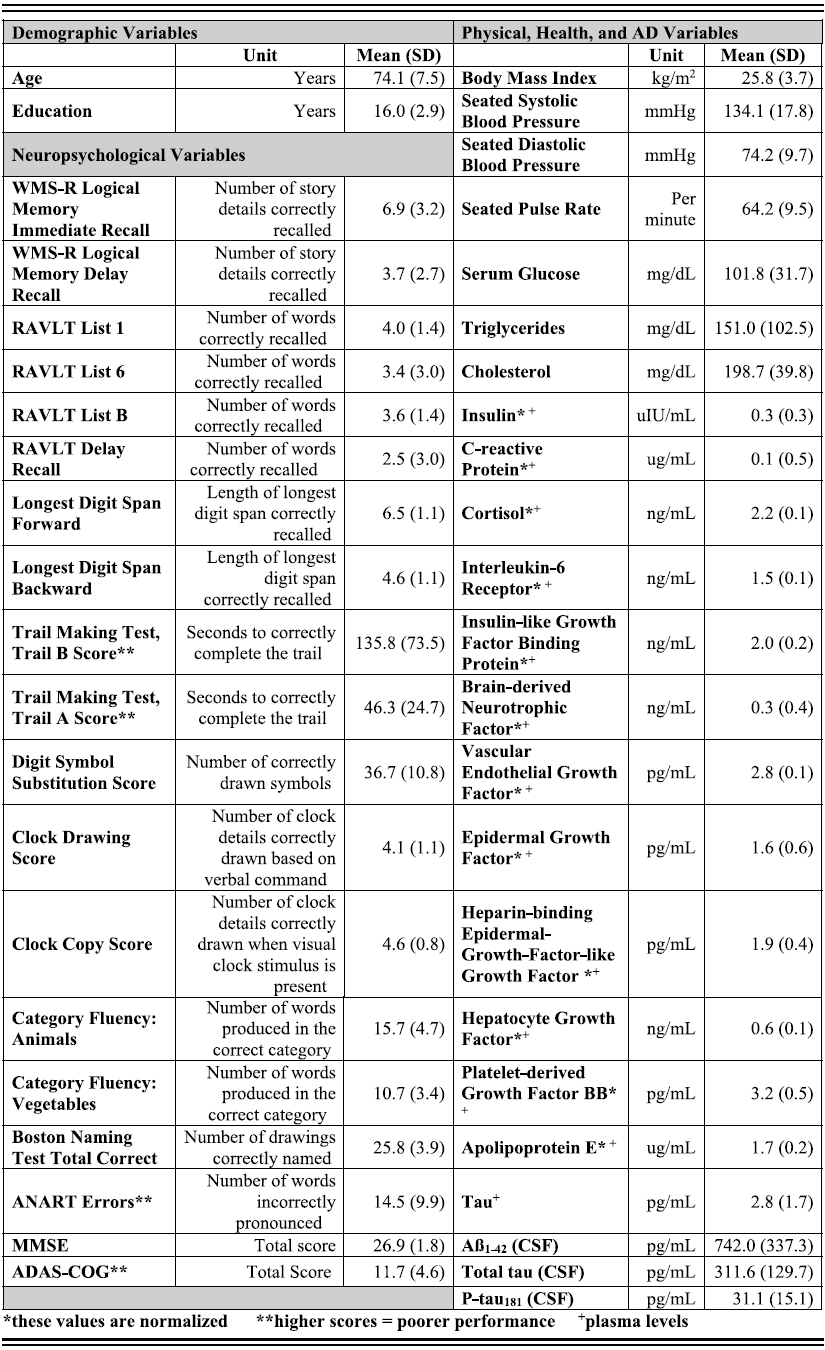
Neuropsychological data were obtained from screening (WMS-R Logical Memory and MMSE) and baseline visits (all other tests). Average time between appointments was 41.3 days. Nineteen raw scores from the assessment were included in the PLS analysis (see Table 1).
-
Episodic Memory – WMS-R Logical Memory I (immediate recall; number of story details correctly recalled), WMS-R Logical Memory II (delayed recall; number of story details correctly recalled), Rey Auditory Verbal Learning Test List 1 (RAVLT; number of words correctly recalled), RAVLT List B (number of words correctly recalled on the interference list); RAVLT List 6 (number of words correctly recalled on the original list after interference); and RAVLT 30-minute delay recall (number of words correctly recalled on the original list).
-
Working Memory – Digit Span Forward (length of the longest digit span correctly recalled).
-
Executive Function – Digit Span Backward (length of the longest digit span correctly recalled), Trail Making Test (Trail B; number of seconds to correctly complete the trail).
-
Processing Speed – Trail Making Test (Trail A; number of seconds to correctly complete the trail), Digit Symbol Substitution Test (number of correctly drawn symbols).
-
Visuospatial Ability – Clock Drawing Test (Clock Drawing [number of details correctly drawn based on verbal command] and Clock Copy [number of clock details correctly drawn/copied when a visual clock stimulus is present]).
-
Language – Category Fluency (number of words produced in the correct category for animals and vegetables), The Boston Naming Test (number of drawings correctly named).
-
Premorbid IQ – American National Adult Reading Test (number of words incorrectly pronounced).
-
Global Cognition – MMSE (total score), Alzheimer’s disease Assessment Scale (ADAS-COG; total score).
Participant Demographic, Neuropsychological, Physical, Health, and AD Biomarker Data Entered into the PLS Analysis. KEY = ADAS-COG = Alzheimer’s disease Assessment Scale, Cognitive Subsection; ANART = American National Adult Reading Test; MMSE = Mini Mental State Exam; CSF = Cerebrospinal Fluid; RAVLT = Rey Auditory Verbal Learning Test; WMS-R = Weschler Memory Scale – Revised

Cardiometabolic, Stress, and Inflammation Variables
BMI (kg/m2), systolic blood pressure (mmHg), diastolic blood pressure (mmHg), pulse rate (per minute), cholesterol (mg/dL), triglycerides (mg/dL), and serum glucose (mg/dL) data were obtained. Insulin (uIU/mL), cortisol (ng/mL), CRP (ug/mL), and interleukin-6 receptor (ng/mL) data were assessed from fasting plasma blood samples; these data were normalized and checked for the defined least detectable dose during the quality control process.
Growth Factors and Neurotrophic Factors
Insulin-like growth factor binding protein (ng/mL), epidermal growth factor (pg/mL), heparin-binding epidermal-growth-factor-like growth factor (HB-EGF-like-GF; pg/mL), hepatocyte growth factor (ng/mL), platelet-derived growth factor BB (PDGF; pg/mL), BDNF (ng/mL), and vascular-endothelial growth factor (pg/mL) were analyzed. Data were normalized and checked for the defined least detectable dose during the quality control process.
AD Biomarkers
Plasma Apolipoprotein E (apoE; ug/mL), plasma tau (pg/mL), CSF total tau (t-tau; pg/mL), CSF phospho-tau (181; p-tau181; pg/mL), and CSF Aß1–42 (pg/mL) were also examined. Only values within the given ranges were included for analyses: Aß1–42 200–1700 pg/mL, p-tau181 8–120 pg/mL, and t-tau 80–1300 pg/mL, as these are the reported technical limits.
Data Processing and Analysis
ADNI1 data were scrubbed using RStudio (Version 1.2.5001; R version 3.6.1). Raw data files for all blood- and CSF-based biomarkers were checked for imputed values. To ensure data integrity, all analytes with >10% imputed values were removed. Participants who had missing data or invalid data as indicated by the ADNI manual were excluded.
The PLS Command line package (Version 6, 2013) was downloaded from the open-source PLS User Guide: http://pls.rotman-baycrest.on.ca/source/ and run in MATLAB (Version 2019b). A cross-covariance matrix between demographic (age and education), physical, health, and AD data (matrix 1) and cognitive data (matrix 2) was created and factorized using singular value decomposition into mutually orthogonal singular vectors (Abdi & Williams, Reference Abdi, Williams, Reisfeld and Mayeno2013). The PLSC algorithm uses these singular vectors to create latent variables that express the largest amount of information common to both input matrices (Krishnan, Williams, McIntosh, & Abdi, Reference Krishnan, Williams, McIntosh and Abdi2011). Thus, these latent variables refer to the pattern of covariance between physical, health, and AD variables (matrix 1) and cognitive function (matrix 2). The PLSC command line outputs as many latent variables as there are behavioral variables (19), the sum of which total to 100% of the cross-block covariance.
The p-value for all 19 latent variables was determined using permutation analyses. Permutation samples are created using our input dataset. Matrix 2 variables are randomly shuffled within participants, while matrix 1 variables remain intact. The PLSC model is re-run on each of these permutation samples, creating a distribution that can be used to determine a p-value for each latent variable (Krishnan et al., Reference Krishnan, Williams, McIntosh and Abdi2011). Latent variables were determined as statistically significant if the latent variable had a p-value of < .05 after 1500 permutations of the data (Abdi & Williams, Reference Abdi, Williams, Reisfeld and Mayeno2013). Reliability of a latent variable was assessed through split-half resampling, a procedure that determines the reliability of the associations described between the two matrices of data (physical, health, AD, and cognitive) within a given latent variable (Kovacevic, Abdi, Beaton, & McIntosh, Reference Kovacevic, Abdi, Beaton, McIntosh, Abdi, Chin, Esposito Vinzi, Russolillo and Trinchera2013). To compute this, the full study sample was randomly split into half, and each half was independently analyzed. Latent variables were considered reliable if both sides of the data met criteria for significance (p < .05; Kovacevic et al., Reference Kovacevic, Abdi, Beaton, McIntosh, Abdi, Chin, Esposito Vinzi, Russolillo and Trinchera2013). Physical, health, and AD variables with a bootstrap ratio (BSR) with an absolute value greater than or equal to 1.96 (corresponding to p < .05), determined by 1000 resamplings with replacement of the data, were considered reliable contributors to the latent variables. Cognitive measures were considered to significantly contribute to the latent variable if their correlation with the latent variable was significantly different than zero (p < .05). Using these cutoffs, patterns of physical, health, AD variables, and cognitive scores that account for significant amounts of covariance in the data were determined (see Table 1 for variables included in the analysis).
RESULTS
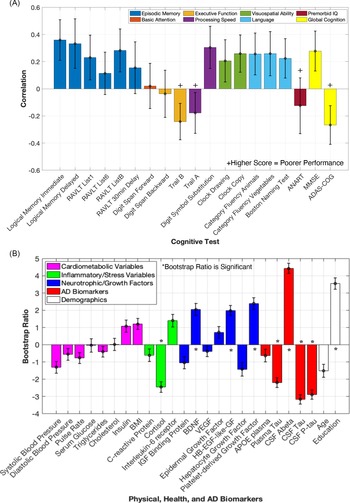
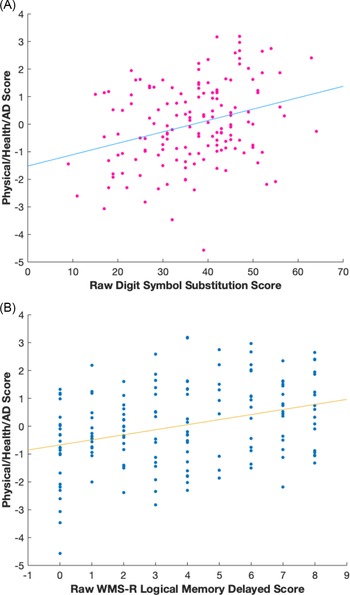
Three significant latent variables (all values p < .01) were identified. Latent variable 1 (LV1; Figure 1) accounted for 45.2% of the cross-block covariance. LV1 was considered reliable, as it met criteria for split-half reliability (all values p < .05; Kovacevic et al., Reference Kovacevic, Abdi, Beaton, McIntosh, Abdi, Chin, Esposito Vinzi, Russolillo and Trinchera2013). For LV1, neurotrophic/growth factors, AD biomarkers, a stress biomarker, and education were significantly associated with performance across multiple cognitive domains. Specifically, HB-EGF-like-GF, PDGF, BDNF, plasma tau, CSF t-tau, CSF p-tau181, CSF Aß1–42, cortisol, and education were significantly associated with performance on measures of episodic memory (WMS-R Logical Memory immediate and delayed recall, RAVLT List 1 and List B), processing speed (Trail A and Digit Symbol Substitution Test), executive function (Trail B), visuospatial ability (Clock Drawing and Copy), verbal fluency (Category Fluency Animals, Category Fluency Vegetables), language (Boston Naming Test), and global cognition (MMSE, ADAS-COG). All significant cognitive tests had statistically equal contributions to LV1 as all had error bars (representing 95% confidence intervals) overlapping with one another (Figure 1). Better performance on this subset of cognitive measures was associated with increased neurotrophic/growth factor levels, less AD pathology, lower levels of stress, and higher education (for individual BSRs, see Figure 1). Of these variables, CSF AD biomarkers and education had the highest BSRs, revealing that these variables had the strongest associations with cognition, followed by growth factors such as HB-EGF-like-GF, PDGF, and BDNF, as well as a stress biomarker, cortisol. To further visualize LV1,we plotted the relationship between the physical/health/AD scores for LV1 (representing how well an individual’s physical/health/AD variables contribute to the LV1 pattern) and two cognitive tests (raw scores on Digit Symbol Substitution (Figure 2A) and WMS-R Logical Memory delayed recall (Figure 2B)).
Correlation profile and bootstrap ratios for Latent variable 1. (A) The correlation between each cognitive test variable to the identified physical, health, and AD variables listed in panel B. Significant variables have 95% confidence intervals (error bars) that do not cross the x-axis (0). (B) Each Physical, Health, and AD Variable’s contribution to LV1 represented by their bootstrap ratios, indicating directionality with significant cognitive tests represented in A (for instance, performance on logical memory immediate was positively correlated with levels of brain-derived neurotrophic factor, and had a negative correlation with CSF tau). Error bars represent 95% confidence intervals. Variables with bootstrap ratios > |1.96| (equivalent to a p-value of < .05) are considered significant contributors to the LV and are indicated by *. (KEY PANEL A: ADAS-COG = Alzheimer’s Disease Assessment Scale, Cognitive Subsection; ANART = American National Adult Reading Test; MMSE = Mini Mental State Examination; RAVLT = Rey Auditory Verbal Learning Test; KEY PANEL B: APOE = apolipoprotein E; BDNF = brain-derived neurotrophic factor; BMI = body mass index; CSF = cerebrospinal fluid; HB-EGF-like-GF = heparin-binding epidermal growth factor-like growth factor; IGF = insulin-like growth factor; p-tau = phospho-tau 181; VEGF = vascular endothelial growth factor).

For display purposes, scatterplots of each participant’s Digit Symbol Substitution raw score (Panel A) and WMS-R Logical Memory Delayed Recall raw score (Panel B) are plotted against their individual physical/health/AD score (representing how well an individual’s physical/health/AD variables contribute to the overall pattern in LV1).

LV2 and LV3 were also significant, accounting for 17.2% and 11.9% of the cross-block covariance, respectively. For LV2, IL-6 receptor, neurotrophic/growth factors, and AD biomarkers were significantly associated with performance in measures of delayed episodic memory. Specifically, lower IL-6 receptor, BDNF, PDGF, CSF t-tau, and CSF p-tau181, and higher hepatocyte growth factor and CSF Aß1–42 were associated with better performance on WMS-R Logical Memory delayed recall and RAVLT 30-minute delayed recall (see Supplemental Figure 1 for details). However, LV2 did not meet criteria for split-half reliability (matrix 2 had a value of p > .05) and thus should be interpreted with caution. For LV3, lower levels of cardiometabolic variables and higher insulin-like growth factor binding protein, age, and education were associated with better performance in executive function (longest digit span backward length), basic attention (longest digit span forward length), premorbid IQ (ANART), and worse performance in episodic memory (RAVLT List B; see Supplemental Figure 2 for details). LV3 met criteria for split-half reliability (all values p < .05). However, the three significant cognitive outcomes in LV3 have correlations with 95% confidence intervals close to crossing the x-axis (0), and LV3 accounts for a relatively low percentage of the overall cross-block covariance; thus, the relationships reported within LV3 should be interpreted with abundant caution (see Supplemental Figure 2 for details).
DISCUSSION
To summarize, we identified a latent variable (LV1) that accounted for a large amount of cross-block covariance, revealing a pattern in the data suggesting that increased neurotrophic/growth factor levels, less AD pathology, lower stress, and higher education are associated with better performance largely on tasks associated with episodic memory, executive function, processing speed, language as well as metrics of global cognition (Figure 1). Basic attention (e.g., longest sequence recalled for digit span forward) and premorbid IQ were not significantly associated with this pattern. This pattern suggests that markers of neuroprotection, neuroplasticity, stress, and AD pathology may hold relatively less importance for cognitive metrics that do not require mental manipulation. Interestingly, modifiable cardiometabolic risk factors (such as BMI, cholesterol, etc.), which are often associated with cognition in older adults (Farooqui et al., Reference Farooqui, Farooqui, Panza and Frisardi2012; Yaffe et al., Reference Yaffe, Kanaya, Lindquist, Simonsick, Harris, Shorr and Newman2004), did not contribute to the pattern described. Chronological age also did not significantly contribute to the pattern described for LV1. This discussion mainly focuses on LV1, which accounted for the most cross-block covariance and met criteria for split-half reliability.
Our results extend the literature by showing a novel association between HB-EGF-like-GF and cognition. Specifically, better cognitive performance was associated with higher levels of plasma HB-EGF-like-GF in LV1. Previous research has shown that this growth factor may have neuroprotective properties, as infusions of HB-EGF-like-GF in rats 1-day post-stroke were associated with neuroprotection against cell death (Shim & Madsen, Reference Shim and Madsen2018). Moreover, in rats with cypermethrin exposure (a pesticide associated with AD neuropathology), exogenous administration of HB-EGF-like-GF inhibited cypermethrin-induced accumulation of Aß1–42 and p-tau in the frontal cortex and hippocampus and led to decreases in learning and memory deficits caused by cypermethrin exposure (Maurya, Mishra, Abbas, & Bandyopadhyay, Reference Maurya, Mishra, Abbas and Bandyopadhyay2016). Our finding is consistent with animal models demonstrating HB-EGF-like-GF’s potential neuroprotective role (Maurya et al., Reference Maurya, Mishra, Abbas and Bandyopadhyay2016; Shim & Madsen, Reference Shim and Madsen2018). To our knowledge, a link between HB-EGF-like-GF and human cognition has not been reported. However, in one study exploring older adults who were cognitively normal or had MCI, higher levels of CSF HB-EGF-like-GF were associated with decreased levels of CSF Aß1–42 and increased levels of CSF t-tau, which is contrary to our finding (P. F. Meyer et al., Reference Meyer, Savard, Poirier, Labonté, Rosa-Neto, Weitz and Breitner2018), as our results suggest that HB-EGF-like-GF may be associated with potential cognitive benefits. This unique finding necessitates additional research in order to clarify the role of HB-EGF-like-GF in human cognition.
Our LV1 findings for two other neurotrophic/growth factors, BDNF and PDGF, support previous research showing positive associations between these two neurotrophic/growth factors and cognition. Higher levels of BDNF were associated with better cognitive performance (on WMS-R Logical Memory immediate and delayed recall, RAVLT List 1 and List B, Trail A and Digit Symbol Substitution Test, Trail B, Clock Drawing, Category Fluency Animals and Vegetables, Boston Naming Test, MMSE, and ADAS-COG), consistent with the putative role of BDNF in neuroprotection (Lista & Sorrentino, Reference Lista and Sorrentino2010; Miranda et al., Reference Miranda, Morici, Zanoni and Bekinschtein2019). For LV1, higher PDGF was also related to better cognitive performance, which is consistent with studies showing higher levels of PDGF were associated with reduced cognitive decline (Taipa et al., Reference Taipa, das Neves, Sousa, Fernandes, Pinto, Correia and Sousa2019). However, it should be noted that the relationship between PDGF and cognition was not entirely consistent. For LV2, lower levels of PDGF were associated with better performance on WMS-R Logical Memory delayed recall and RAVLT delayed recall (although LV2 should be interpreted with caution).
AD biomarkers exhibited some of the strongest associations with cognition in LV1. Lower levels of plasma tau were associated with higher cognitive performance, supporting previous research demonstrating that plasma tau levels in those with MCI were negatively associated with episodic memory and verbal fluency performance (Chiu et al., Reference Chiu, Chen, Chen, Yang, Yang, Tseng and Horng2014). Lower levels of CSF t-tau and CSF p-tau181 were associated with better cognitive performance, consistent with recent work (Nathan et al., Reference Nathan, Lim, Abbott, Galluzzi, Marizzoni, Babiloni and Frisoni2017). Lower levels of CSF Aß1–42 were correlated with lower cognitive scores, a pattern similar to recent findings revealing that low CSF Aß1–42 levels were associated with cognitive impairment in participants with MCI (Matura et al., Reference Matura, Köhler, Reif, Fusser, Karakaya, Scheibe and Pantel2019). Increased levels of CSF t-tau and CSF p-tau181 and decreased levels of CSF Aß1–42 in those with MCI are all associated with increased risk of converting to dementia (Diniz et al., Reference Diniz, Pinto and Forlenza2008). These associations between AD biomarkers and cognition contribute to our understanding of cognitive decline in MCI, demonstrating that AD biomarkers are associated with a broad range of cognitive domains (see Figure 1).
Our results also demonstrate that cortisol, a marker of stress or hypothalamic–pituitary–adrenal–axis activity, had negative associations with cognition. Lower levels of cortisol were associated with higher cognitive performance, which is consistent with recent research demonstrating that cognitively normal older adults with elevated cortisol and CSF Aß1–42 were at a higher risk of clinical progression to MCI or AD (Udeh-Momoh et al., Reference Udeh-Momoh, Su, Evans, Zheng, Sindi, Tzoulaki and Middleton2020). Interestingly, this relationship remained even when controlling for cognitive reserve (Udeh-Momoh et al., Reference Udeh-Momoh, Su, Evans, Zheng, Sindi, Tzoulaki and Middleton2020). Our results align with this finding and contribute to the literature by demonstrating that cortisol was significantly associated with positive cognitive outcomes in an MCI group.
Regarding demographic variables, higher education was associated with superior cognitive performance in LV1, consistent with the well-documented role of education as a source of cognitive reserve (Stern, Reference Stern2013). Surprisingly, chronological age did not significantly contribute to the pattern of covariance in LV1. This null finding was unexpected as multiple episodic memory and executive function tasks significantly contributed to LV1, and these cognitive domains typically decline with age (Buckner, Reference Buckner2004; Tromp et al., Reference Tromp, Dufour, Lithfous, Pebayle and Després2015). However, cognitive aging studies often do not include any array of physiological and health metrics. These data suggest neurotrophic/growth factors, AD biomarkers, a marker of stress, and education may better predict performance on tasks of episodic memory, executive function, processing speed, visuospatial ability, verbal fluency, language, and global cognition than chronological age.
The current study had limitations. Some variables such as Insulin-like Growth Factor 1 and Interleukin-6 did not pass ADNI’s internal quality control processes, precluding inclusion in our analysis. Other variables, such as sex or APOE ɛ4 status, were not included in the analysis because it is generally not recommended to include binarized variables (sex) or those with limited variability (APOE ɛ4 genotype: only 3 possible values: 0, 1, or 2 alleles) in a PLS analysis (a variable with low variance is problematic for the calculation of correlation coefficients and the unequal distribution of these measures across the sample can lead to instability in the BSR estimates, which could lead to misinterpretation of the data, making the findings less generalizable).
Overall, these findings emphasize that markers of neuroprotection, neuroplasticity, stress, and AD significantly contribute to episodic memory, executive function, and processing speed in older adults with MCI. Our results suggest that modifiable variables, such as BDNF and cortisol, which research has shown can be changed with physical exercise, may serve as potential targets for future interventions to slow cognitive impairment and progression to dementia (Lista & Sorrentino, Reference Lista and Sorrentino2010; Baker et al., Reference Baker, Frank, Foster-schubert, Pattie, Wilkinson, Mctiernan and Craft2011).
Supplementary Material
To view supplementary material for this article, please visit https://doi.org/10.1017/S1355617721001041
ACKNOWLEDGMENTS
We would like to thank Jena Moody for her contributions including sharing her knowledge of the ADNI database, as well as Randy McIntosh, for sharing his valuable insight and expertise in PLS methods.
Financial Support
This research was supported by the National Institute on Aging (NIA) of the National Institutes of Health (NIH) R21AG056921 (awarded to SMH), NIA R01AG068882 (awarded to SMH), NIA R01AG058822 (awarded to JPH); and The Ohio State University Discovery Themes Chronic Brain Injury Initiative (SMH and JPH).
Data collection and sharing for this project was funded by the Alzheimer’s Disease Neuroimaging Initiative (ADNI) (National Institutes of Health Grant U01 AG024904) and DOD ADNI (Department of Defense award number W81XWH-12-2-0012). ADNI is funded by the National Institute on Aging, the National Institute of Biomedical Imaging and Bioengineering, and through generous contributions from the following: AbbVie, Alzheimer’s Association; Alzheimer’s Drug Discovery Foundation; Araclon Biotech; BioClinica, Inc.; Biogen; Bristol-Myers Squibb Company; CereSpir, Inc.; Cogstate; Eisai Inc.; Elan Pharmaceuticals, Inc.; Eli Lilly and Company; EuroImmun; F. Hoffmann-La Roche Ltd and its affiliated company Genentech, Inc.; Fujirebio; GE Healthcare; IXICO Ltd.; Janssen Alzheimer Immunotherapy Research & Development, LLC.; Johnson & Johnson Pharmaceutical Research & Development LLC.; Lumosity; Lundbeck; Merck & Co., Inc.; Meso Scale Diagnostics, LLC.; NeuroRx Research; Neurotrack Technologies; Novartis Pharmaceuticals Corporation; Pfizer Inc.; Piramal Imaging; Servier; Takeda Pharmaceutical Company; and Transition Therapeutics. The Canadian Institutes of Health Research is providing funds to support ADNI clinical sites in Canada. Private sector contributions are facilitated by the Foundation for the National Institutes of Health (www.fnih.org). The grantee organization is the Northern California Institute for Research and Education, and the study is coordinated by the Alzheimer’s Therapeutic Research Institute at the University of Southern California. ADNI data are disseminated by the Laboratory for Neuro Imaging at the University of Southern California.
CONFLICT OF INTEREST
The authors have nothing to disclose.