Introduction
The “vascular depression” hypothesis (Alexopoulos et al., Reference Alexopoulos, Meyers, Young, Kakuma, Silbersweig and Charlson1997; Baldwin and O'Brien, Reference Baldwin and O'Brien2002) proposes that ischemic tissue damage occurs in frontal-subcortical circuitry involved in cognitive and affective function as a result of cerebrovascular disease in the elderly. The theory predicts that a different series of pathological events (and possibly different risk factors) may underlie depression in younger and elderly populations (Khundakar and Thomas, Reference Khundakar and Thomas2009). The theory has been substantiated by numerous preclinical, neuroimaging and neuropathological studies. Intriguingly, different trends exist in previous 3-D morphological studies performed in post-mortem tissue from younger and late-life depressed patients.
The orbitofrontal cortex (OFC) is thought to facilitate the integration of limbic and emotive information into behavioral responses (Rogers et al., Reference Rogers2004; Rolls, Reference Rolls2004), making the region a key component in depression (Rogers et al., Reference Rogers, Bradshaw, Pantelis and Phillips1998). Structural changes, such as white matter hyperintensities, which are ischemic lesions (Thomas et al., Reference Thomas, Ferrier, Kalaria, Davis and O'Brien2002), have been identified in OFC circuitry in elderly depressed patients (Greenwald et al., Reference Greenwald, Kramer-Ginsberg, Krishnan, Ashtari, Auerbach and Patel1998; MacFall et al., Reference MacFall, Payne, Provenzale and Krishnan2001; Taylor et al., Reference Taylor2001), and such changes are more common in late-life than younger depressed patients (Teodorczuk et al., Reference Teodorczuk2007; Herrmann et al., Reference Herrmann, Le Masurier and Ebmeier2008). The OFC is a cytoarchitectonically heterogeneous region (Ongur et al., Reference Ongur, Ferry and Price2003) that may be divided into subregions with distinct functions (Northoff et al., Reference Northoff2000) and connections (Carmichael and Price, Reference Carmichael and Price1995). Such anatomical variability is reflected in differential changes in volume and activation in imaging studies on depressed patients (Drevets et al., Reference Drevets, Videen, Price, Preskorn, Carmichael and Raichle1992). Furthermore, subregion-specific variability appears to exist between morphological studies performed within both younger and late-life depressed patients. Rajkowska et al. (Reference Rajkowska1999) found a significant reduction in glial cell density in the rostral, but not caudal, subregion of the OFC in depressed patients of all ages. A subsequent study by the same group found significant reduction in pyramidal neuron density, but not glial cell density, in the rostral OFC in elderly depressed patients (Rajkowska et al., Reference Rajkowska, Miguel-Hidalgo, Dubey, Stockmeier and Krishnan2005). Cotter et al. (Reference Cotter, Hudson and Landau2005) found laminae-specific neuron reductions in layer 3 of the caudal subregion of the OFC in depressed patients of all ages. To our knowledge, cell pathology has not been examined in the caudal region of the OFC in an elderly depressed cohort of patients. This study therefore aims to elaborate on these earlier 3-D morphometric findings by examining glial cell and neuron pathology in the caudal subregion of the OFC in elderly depressed patients.
Methods
Subjects
Brain tissue was obtained from the Newcastle Brain Tissue Resource from patients with late-life major depression. Permission was obtained from the subjects and ethical approval was granted for the use of the post-mortem tissue used in the study. The majority of the subjects have been included in a previous morphometric study published by our group (Khundakar et al., Reference Khundakar, Morris, Oakley, McMeekin and Thomas2009). The case notes were reviewed for depressed patients to establish information on depressive illness, as well as information for vascular risk factors, cause of death and medication for all subjects involved in the study.
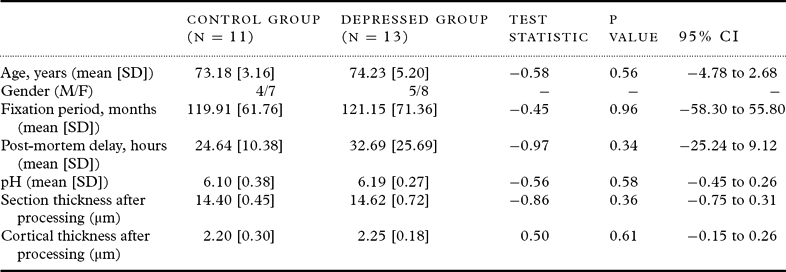
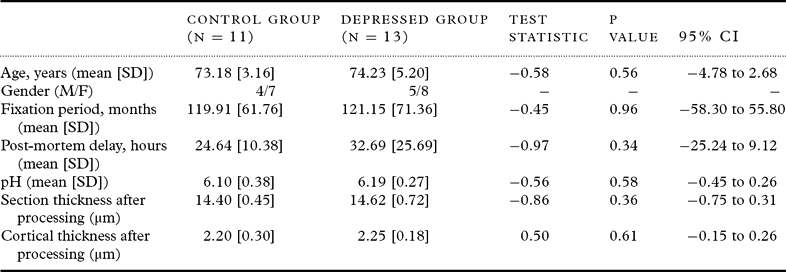
The post mortem tissue used in the study was taken from subjects aged over 60 years and consisted of 13 individuals with DSM-IV major depression (American Psychiatric Association, 1994), who had no history of any other psychiatric or neurological disorder, as well as 11 comparison subjects with no history of any psychiatric illness. All comparison subjects were capable of living independently and met the same criteria as depressed patients with the exception of having never suffered a major depressive episode. Clinical assessment and diagnosis of depressed patients had been performed during life by senior psychiatrists and subjects were excluded from the study if evidence of significant cognitive impairment was found during life or if they met neuropathological criteria, e.g. CERAD, for any pathological cause of dementia or had evidence of any other neurological disorder. The clinical and pathological information was finally reviewed by senior psychiatrists and neuropathologists, who confirmed the diagnoses. Demographic information on the study sample is summarized in Table 1.
Patient and histopathological data for control and depressed groups
Tissue
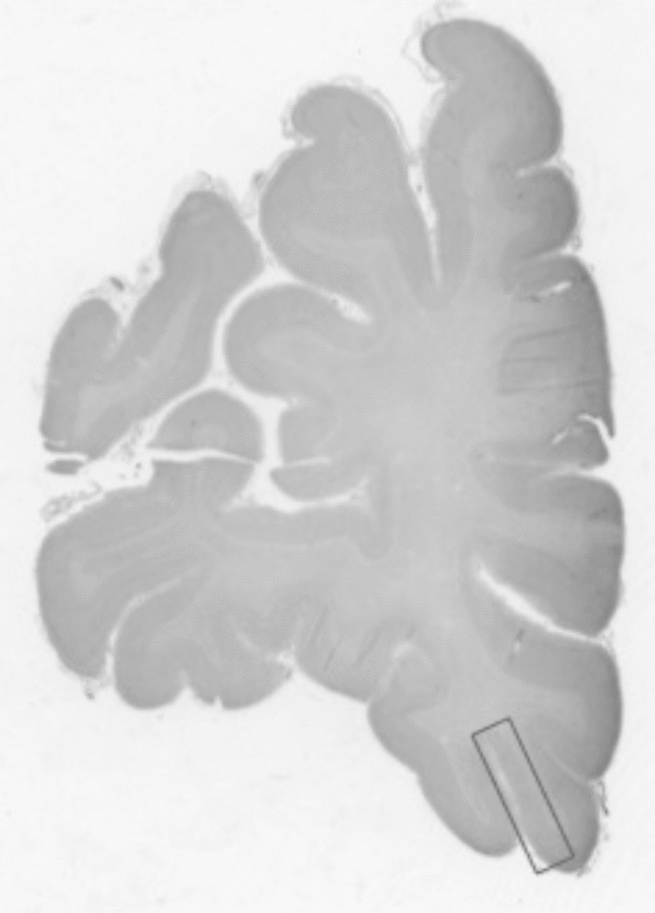
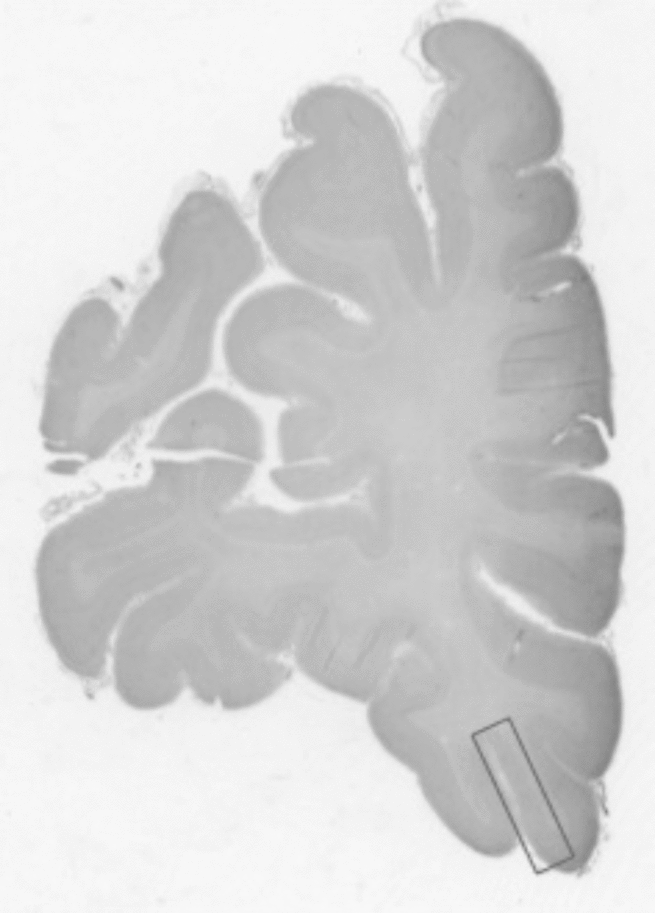
The right hemisphere was fixed in 10% formalin post-mortem, and the delay from death to formalin fixation and tissue pH was recorded. Tissue slices were obtained and sampled from the caudal region of the OFC by macroscopic examination of the tissue block and microscopic examination of sections taken from the blocks. The region was identified by locating the lateral wall of a caudal OFC block (BA11) (Figure 1), as described in a previous morphometric study (Cotter et al., Reference Cotter, Hudson and Landau2005). The tissue blocks were embedded in paraffin wax and the formalin fixation time was recorded. A series of 20 30μm sections was cut from each block and stained with cresyl fast violet. The quality of the sections and staining was carefully checked for consistency all slides were coded so that all analysis could be carried out blind to diagnosis. Three sections were systematically randomly sampled through the reference space at five section intervals for each individual for subsequent morphometric analysis.
Nissl-stained coronal section through the right hemisphere showing the lateral anatomical location of the caudal subregion of the orbitofrontal cortex.
Neuronal and glial estimates
Neuronal density and volume and glial cell density were estimated using image analysis software (Visiopharm Integration System, Hørsholm, Denmark) to apply the optical disector and nucleator methods to obtain the cell counts and particle volume estimates. As in previous studies (Khundakar and Thomas, Reference Khundakar and Thomas2009; Rajkowska et al., Reference Rajkowska, Miguel-Hidalgo, Dubey, Stockmeier and Krishnan2005), neurons were identified by the presence of a Nissl-stained cytoplasm, pale nucleus and single identifiable nucleolus in cells, which were not spherical (unlike glia). Glial cells were identified by their spherical shape, absence of Nissl staining in the cytoplasm and the heterogeneous arrangement of chromatin in the nucleus. The application of the criteria was checked by an experienced rater (AK), working together with the senior investigator trained in stereological methodology (AT) and the experienced microscopist and research neuroscientist (AO). The sections were viewed in oil using a Zeiss Axioplan Photomicroscope at ×100 objective and numerical aperture of 1.25. The microscope was attached to a Pixelink PL-B623CF color digital video camera (Pixelink U.K.), a motorized x and y axis stage accurate to 1μm (Prior ProScan II, Prior Scientific Instruments Ltd, Cambridge, U.K.) and a Heidenhain z-axis microcator, accurate to 0.5μm (Heidenhain GB Ltd, London, U.K.) to ensure accurate measurement of disector depth.
Before conducting this study, a pilot study was carried out to ensure that neurons and glia were sampled evenly across the six neocortical laminae and in sufficient numbers to produce meaningful estimates. Based on our findings, a random sampling strategy was used across the cortex, with the individual laminae 3 and 5 counted separately. The estimates were conducted using one disector per field and over 100 fields across the cortex and over 35 in each pyramidal layer for each section in a systematic random manner. Each disector box measured 62.70μm long × 50.16μm wide. During the pilot study, an appropriate guard zone was established; a volume of approximately 8μm (4μm at the top and 4μm at the bottom of the section) was deemed sufficient to account for artefacts created in the cutting process. During the analysis, the thickness of the tissue was recorded every ten readings to give a depth estimate for each section. The mean thickness reading (minus the guard volume) was then used as the z-axis reading to calculate the disector box volume. There was no significant difference in mean section thickness between the two groups (t = 0.86, P = 0.39; Table 1). The following equation was used to calculate the density of cells within a disector box (comprising the x, y and z axis):

Where: Nv = Numerical density
p − = Disector samples
Q− = Number of objects counted
P = Total number of disectors
V = Disector box volume
The particle volume was calculated by the nucleator method (Gundersen, Reference Gundersen1988) using the following formula:
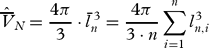
Where: ln = distance from sampling point (nucleolus to edge of object)
The mean coefficients of error for the neuronal and glial estimates were calculated using the Gundersen-Jensen method (Gundersen and Jensen, Reference Gundersen and Jensen1987) (shown below), and showed they were made with a high degree of precision (1.8% for glial density; 3.7% for pyramidal neuron density; 3.9% for non-pyramidal neuron density; 2.8% for pyramidal neuron volume; and 2.3% for non-pyramidal neuron volume).
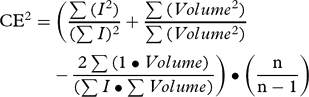
Where: I = Neurons counted
Volume = Reference area ● (sampling frame (SF) density)2 ● section depth
n = Number of fields
Mean cortical thickness was measured in every sampled section by use of a graticule at 2.5× magnification from the pial surface to the white matter.
Statistics
Tests for normality were conducted and unpaired, two-way Student's t-tests were used to compare the depressed and control groups on the primary estimates and also on their basic demographic, clinical and histopathological variables. Non-parametric testing was performed using the Mann-Whitney U test. All comparisons were carried out using SPSS software (Version 17.0).
Results
There were no significant differences between the groups in age (d.f. = 22; t = 0.58; P = 0.56), tissue pH (d.f. = 14; t = 0.56; P = 0.58), post mortem interval (d.f. = 22; t = 0.97; P = 0.34), or duration of tissue fixation (d.f. = 22; t = 0.45; P = 0.96). The were no significant differences in section thickness (d.f. 22; t = 0.86; P = 0.36) or cortical thickness (d.f. 22; t = 0.50; P = 0.61) after processing.
Post-mortem data revealed that causes of death were similar in the two groups, with only one suicide case in the depression group (Table 1). Most patients among the depressed group had experienced severe depressive illnesses; all had required inpatient care for their depression and seven had received at least one course of electroconvulsive therapy. Non-parametric testing revealed no significant difference in glial cell density (z = -1.63; P = 0.62), non-pyramidal density (z = -1.85; P = 0.63), pyramidal density (z = -0.85; P = 0.32), non-pyramidal volume (z = -28; P = 0.77), pyramidal volume (z = -0.28; P = 0.77) in depressed patients treated with ECT and those not given ECT treatment. All patients within the depressed group had been prescribed antidepressant therapy, most commonly in the form of selective serotonin reuptake inhibitors singly but also in combination with other agents. No patients among the control group had been prescribed antidepressant treatment. A review of case-notes revealed no differences in key vascular risk factors in both groups, such as ischemic heart disease, angina pectoris, hypertension, diabetes mellitus, atrial fibrillation, cardiac failure and smoking between groups.
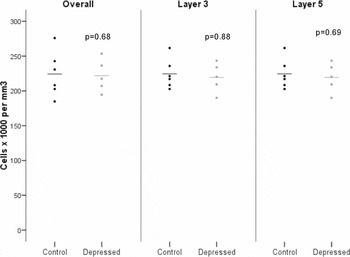
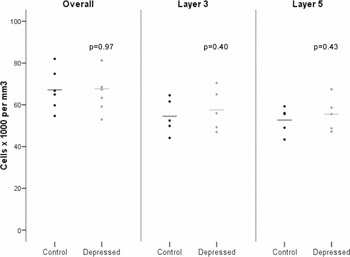
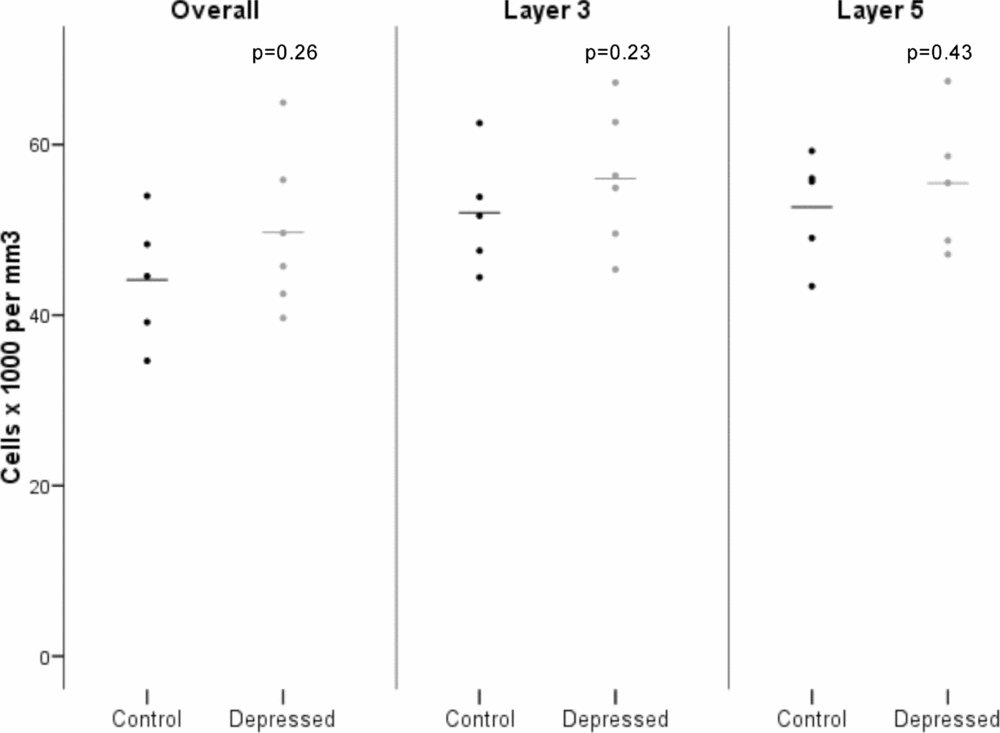
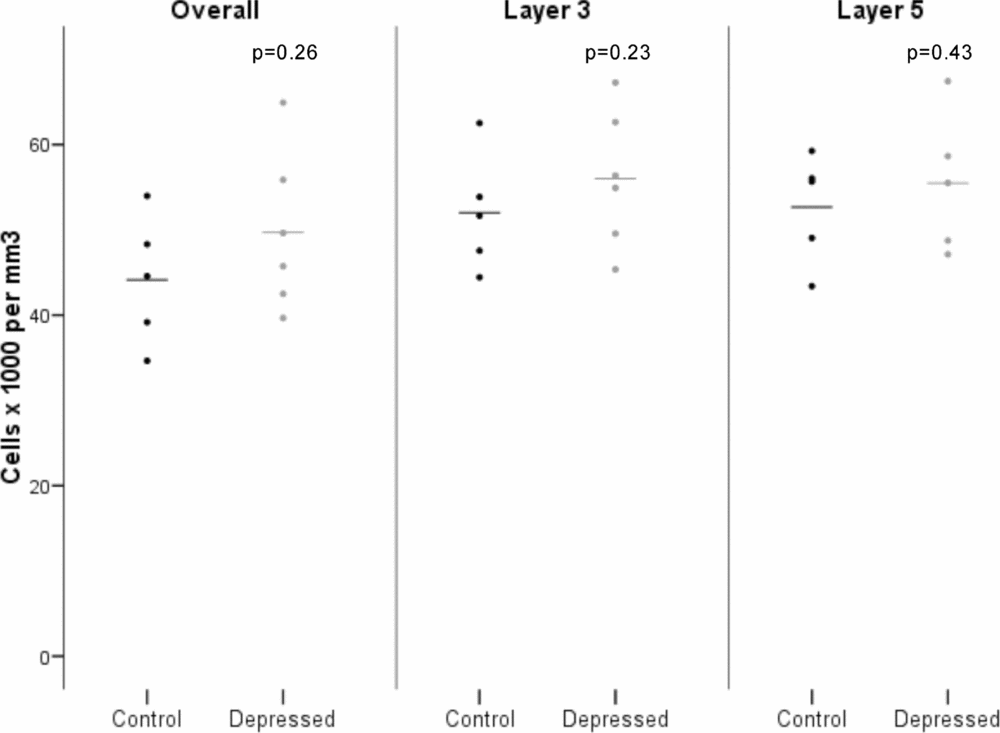
Figures 2, 3 and 4 show the scatter plots of the glial cell, non-pyramidal and pyramidal neuron density respectively. There were no significant differences in glial cell (df = 22; t = 0.42 F = 0.31; P = 0.68), non-pyramidal (df = 22; t = 0.36 F = 0.23; P = 0.97) or pyramidal (df = 22; t = 1.16 F = 0.23; P = 0.97) cell densities in the OFC overall. Likewise, there were no significant differences in glial cell (df = 22; t = 0.15 F = 0.88; P = 0.88), non-pyramidal (df = 22; t = 0.86 F = 0.79; P = 0.40) or pyramidal (df = 22; t = 1.25; F = 0.50; P = 0.22) cell density in layer 3 of the OFC. There were also no significant differences in glial cell (df = 22; t = 0.41 F = 0.27; P = 0.68), non-pyramidal (df = 22; t = 0.80 F = 0.27; P = 0.43) or pyramidal (df = 22; t = 0.45 F = 0.29; P = 0.66) cell density in layer 5 of the OFC.
Mean density of glial cells in the orbitofrontal cortex (bars represent mean values).

Mean density of non-pyramidal neurons in the orbitofrontal cortex (bars represent mean values).

Mean density of pyramidal neurons in the layers of the orbitofrontal cortex (bars represent mean values).
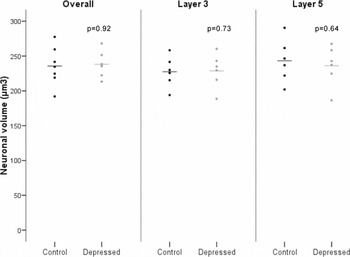
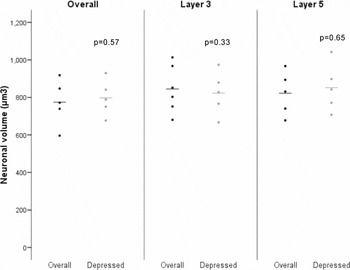
Figures 5 and 6 show the scatter plots of non-pyramidal and pyramidal neuron volume respectively. The were no significant differences in non-pyramidal (df = 22; t = 0.33 F = 0.01; P = 0.26) and pyramidal (df = 22; t = 0.79; F = 0.57; P = 0.67) neuron volume in the OFC overall. Further, there were no significant differences in non-pyramidal (df = 22; t = 0.38 F = 0.01; P = 0.72) or pyramidal (df = 22; t = 0.72; F = 0.46; P = 0.94) neuron volume in layer 3 of the OFC. There were also no significant differences in non-pyramidal (df = 22; t = 0.47 F = 0.21; P = 0.64) or pyramidal (df = 22; t = 0.46 F = 0.08; P = 0.65) neuron volume in layer 5 of the OFC.
Mean volume of non-pyramidal neurons in the orbitofrontal cortex (bars represent mean values).

Mean volume of pyramidal neurons in the orbitofrontal cortex (bars represent mean values).

Discussion
Study summary
This study did not find any evidence of glial or neuronal pathology between depressed and control subjects in the OFC as whole or in layers 3 or 5 of OFC. Previous evidence of neuronal pathology in elderly depressed patients, in the form of a significant reduction in pyramidal neuron density, has been found within the OFC region across all layers, and specifically in layer 3 and 5 (Rajkowska et al., Reference Rajkowska, Miguel-Hidalgo, Dubey, Stockmeier and Krishnan2005). In addition, our group found a significant reduction in pyramidal volume in the dorsolateral prefrontal cortex overall and layers 3 and 5 in patients with late-life depression (Khundakar et al., Reference Khundakar, Morris, Oakley, McMeekin and Thomas2009). Neither this study nor the previously mentioned morphometric studies (Rajkowska et al., Reference Rajkowska, Miguel-Hidalgo, Dubey, Stockmeier and Krishnan2005; (Khundakar et al., Reference Khundakar, Morris, Oakley, McMeekin and Thomas2009) found an overall reduction in glial density, which has been a consistent finding of studies performed in younger adults with depression, including the OFC (Rajkowska et al., Reference Rajkowska1999; Cotter et al., Reference Cotter, Hudson and Landau2005). This study also concurs with the earlier study conducted in the OFC in finding no significant changes in non-pyramidal neuron density in late-life depressed patients (Rajkowska et al., Reference Rajkowska, Miguel-Hidalgo, Dubey, Stockmeier and Krishnan2005).
Anatomical diversity within the OFC
The apparent divergence in the findings from the earlier study conducted in the OFC in elderly depressed patients (Rajkowska et al., Reference Rajkowska, Miguel-Hidalgo, Dubey, Stockmeier and Krishnan2005) may be explained by the anatomical location of the morphometric analysis in this study (the caudal part of the OFC, with readings taken laterally) and the apparent diversity present within the OFC, which reflect morphometric findings from the prefrontal cortex as a whole (Khundakar et al., Reference Khundakar, Morris, Oakley, McMeekin and Thomas2009; Khundakar and Thomas, Reference Khundakar and Thomas2009; van Otterloo et al., Reference van Otterloo, O'Dwyer, Stockmeier, Steffens, Krishnan and Rajkowska2009). As mentioned earlier, the OFC is a cytoarchitechtonically and functionally heterogeneous region, and both morphometric and imaging studies appear to suggest that variability may occur in different subregions in response to pathological events. Functional MRI studies have shown varying patterns of activity within subregions of the OFC in major depressive disorder (MDD) patients. For example, Drevets (2007) found differential levels of abnormal glucose metabolism in depressed patients with the medial portion of the OFC showing particularly high levels of activity (Drevets, 2007). Moreover, a voxel-based MRI morphometry study revealed significant bilateral reduction in grey matter volume in the medial portion of the OFC in elderly depressed patients (Egger et al., Reference Egger2008). Such heterogeneity also appears to occur in neuropathological studies conducted in the OFC. Thus, in a study conducted in both the caudal and rostral areas of the OFC in depressed patients of all ages the rostral area displayed reductions in both mean neuron volume and in the density of larger types of neurons across all layers, as well as more consistent layer-specific reductions in both neuronal volume and density. The current study therefore appears to support the hypothesis first outlined by Rajkowska et al. (Reference Rajkowska1999) of the existence of rostral-to-caudal pattern of morphometric changes within the prefrontal cortex, which is supported by a computerized tomographic scan study that showed brain lesions in more rostral regions were more positively correlated with severe depression (Robinson and Szetela, Reference Robinson and Szetela1981). Whilst anomalies do exist in this hypothesis, most notably that a significant reduction was found in neuronal volume in layer 3 of the caudal OFC in depressed patients off all ages (Cotter et al., Reference Cotter, Hudson and Landau2005), the lack of significant morphometric changes in the pyramidal neuron in the caudal OFC has been found in both this and the previous study (Rajkowska et al., Reference Rajkowska, Miguel-Hidalgo, Dubey, Stockmeier and Krishnan2005) conducted in elderly depressed patients. The apparent differences in the morphological changes between younger and elderly patients may therefore perhaps suggest a differing pathological basis in MDD, dependent on age (Khundakar and Thomas, Reference Khundakar and Thomas2009), as predicted in the ‘vascular depression’ hypothesis (Alexopoulos et al., Reference Alexopoulos, Meyers, Young, Kakuma, Silbersweig and Charlson1997; Baldwin and O'Brien, Reference Baldwin and O'Brien2002).
Study limitations
The limitations of this study mainly relate to the inherent issues existing in attempting to conduct a non-biased 3-D stereological study in human post-mortem tissue. The post mortem tissue was sectioned from pre-defined, paraffin-embedded blocks, making serial sectioning or sub-sampling of the whole OFC impossible. This therefore prevented the desirable use of Cavalieri volume estimates and fractionator methods, which therefore subsequently precluded total number estimates within the OFC. A further limitation arising from pre-defined post-mortem tissue involves the issue of tissue shrinkage in cell density measurement. As we could not assess fresh tissue before processing we cannot exclude differential shrinkage of depressed versus control subjects, which may have concealed in-vivo differences within the caudal OFC. However, assessment of post-processing section thickness and cortical thickness revealed no significant differences between depressed and non-depressed patients. Other possible biological confounders that may have resulted from the use of human post-mortem tissue include the interval between death and brain fixation, as well as the length of time in fixative before analysis took place; no differences, however, were found in such factors between depressed and non-depressed groups. An additional inevitable factor in such studies is the incidence of antidepressant drug and electroconvulsive therapy use in the depressed patient group. However, the vast majority of post-mortem tissue used in this study was obtained from the same patients comprising a previous study (Khundakar et al., Reference Khundakar, Morris, Oakley, McMeekin and Thomas2009) meaning the lack of morphological changes found in this particular study is unlikely to be the result of antidepressant therapy. Furthermore, the effect of ECT had no significant effect on glial density or neuronal density or volume within depressed patient groups.
Conflict of interest
None.
Description of authors’ roles
Ahmad Khundakar, Alan Thomas and Christopher Morris planned the initial experiment. Alan Thomas acquired the relevant clinical information. Ahmad Khundakar performed all laboratory and analytical work. Arthur Oakley assisted with microscopy and analytical work. Ahmad Khundakar and Alan Thomas had an equal role in writing the paper.
Acknowledgments
We thank the NIHR Biomedical Research Centre for Ageing and Age-related Disease for their support for this study. We also express gratitude to the staff at the Newcastle Brain Tissue Resource and the Neuropathology Department for their assistance in processing the tissue used in this study.