1. INTRODUCTION
The aim of this study is to explore the use of a quantitative tool—entropy measurement of a linkograph—in protocol studies of designers to provide insight on design activities, especially at the early stage of idea development. This section presents the necessary background for this study: the construction of linkography, the measurement of linkography using Shannon's entropy, and the theory and method of the blindfolded designing experiment.
1.1. Linkograph
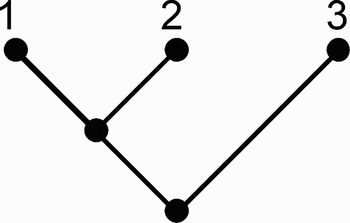
Linkography was first introduced to protocol analysis by Goldschmidt (Reference Goldschmidt and Trappl1990) to assess design productivity of designers. It is a technique used in protocol analysis to study designers. The design protocol is decomposed into small units called “design moves.” Goldschmidt defines a design move as “a step, an act, an operation, which transforms the design situation relative to the state in which it was prior to that move” (Goldschmidt, Reference Goldschmidt1995, p. 195), or “an act of reasoning that presents a coherent proposition pertaining to an entity that is being designed” (Goldschmidt, Reference Goldschmidt and Kalay1992, p. 72). A linkograph is then constructed by linking related moves. It can be seen as a graphical network of associated moves that represents the design session. Figure 1 is a linkograph with three moves.
A linkograph with three moves. Moves 2 and 3 are related to move 1 but moves 2 and 3 are not related.
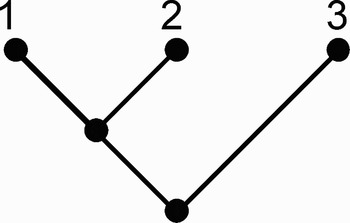
The design process can then be examined in terms of the patterns of moves associations. Goldschmidt identified two types of links: backlinks and forelinks. Backlinks are links of moves that connect to previous moves. Forelinks are links of moves that connect to subsequent moves. In Figure 1, moves 2 and 3 are backlinked to move 1 and move 1 is forelinked to moves 2 and 3. They are very different conceptually. Goldschmidt (Reference Goldschmidt1995, p. 196) states, “backlinks record the path that led to a move's generation, whereas forelinks bear evidence to its contribution to the production of further moves.” Link index and critical moves were devised as indicators of design productivity. Link index is the ratio between the number of links and the number of moves, and critical moves are design moves that are rich in links. They can be forelinks, backlinks, or both. In her exposition, design productivity is positively related to the link index and critical moves. A higher value of link index and critical moves indicates a more productive design process.
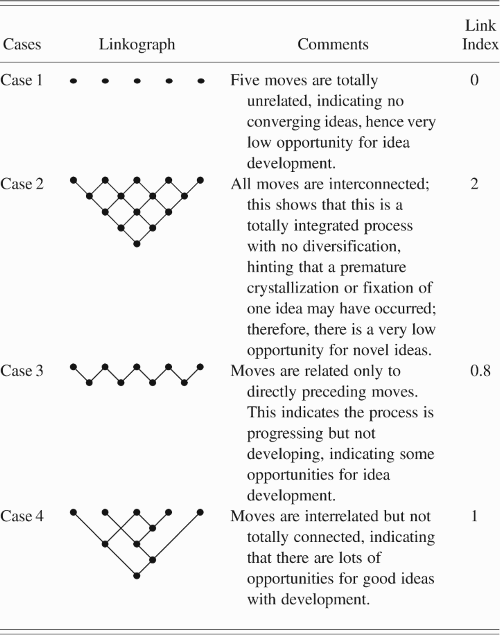
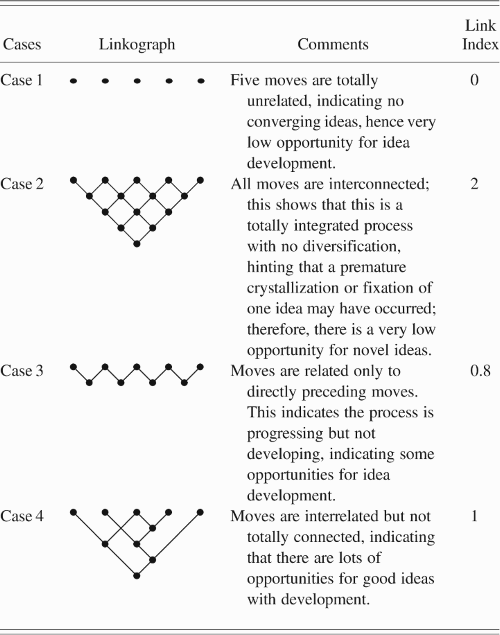
This link index and critical moves approach is biased toward highly linked linkographs because a saturated linkograph will have a high value of link index and critical moves. Kan and Gero (Reference Kan, Gero and Bhatt2005) argue that a fully saturated linkograph indicates no diversification of ideas, hence less opportunity for quality outcomes. Four hypothetical design scenarios with only five moves are used to illustrate our concept; the first three columns of Table 1 are from Kan and Gero (in press). The link index is presented in the fourth column of Table 1. Cases 1–3 might not happen in practice, but this demonstrates our theoretical ground. With the link index calculation, case 2 will score the highest (2) followed by case 4 (1) then case 3 (0.8). We propose that case 2 should not be rated as the best designing scenario.
Four hypothical scenarios
1.2. Information theory
Following the above argument, empty linked and fully linked linkographs are not interesting. We speculate, intuitively, that a partially linked linkograph embodies a balanced process that embraces integration and diversification of ideas. Both fully linked and empty linked linkographs are highly compressible in terms of communicating ideas. Only one ON signal is sufficient to describe a fully linked linkograph; similarly, one OFF signal can describe an empty linked linkograph. A partially random, linked linkograph is highly incompressible; much more information is needed to describe when the links are ON or OFF.
This directs us to Shannon's (Reference Shannon1948) concept of entropy as a measure of information. In Shannon's information theory, the amount of information carried by a message or symbol is based on the probability of its outcome. If there is only one possible outcome, then there is no additional information because the outcome is known. Information is transmitted through recognizable symbols predetermined by the source and the receiver. For example, a source is sending out 10 ON/OFF signals and one of them is OFF but the others are ON. We can say the probability of an OFF symbol, p(OFF), is 0.1 and the probability of an ON symbol, p(ON), is 0.9. Consider the following two cases:
1. If the first signal the receiver gets is an OFF symbol (p = 0.1), then there is no further transmission needed because the outcome is known. This has the assumptions that the receiver knows the total number of signals (10), the probabilities of the symbols (ON/OFF), and the total probability equals 1 [p(ON) + p(OFF) = 1].
2. If the first signal being transmitted is an ON symbol (p = 0.9), then the receiver is still uncertain of the value of the rest of the signals.
The transmission of case 1 carries more information. The amount of information carried by a symbol (ON or OFF in this case) is related to the probability of its outcome. Based on this observation, Shannon proposed an information-generating function h(p). This information function needs to have the following properties:
1. h(p) is continuous for 0 ≤ p ≤ 1, where p is the probability;
2. h(p i) = infinity if p i = 0, where p i is the probability of a given state;
3. h(p i) = 0 if p i = 1;
4. h(p i) > h(p j) if p j > p i, where p i and p j are the probabilities at two different states; and
5. h(p i) + h(p j) = h(p i × p j) if the two states are independent.
Shannon proved that the only function that satisfies the above five properties is

Given a set of N independent states a 1, … , a N and corresponding possibilities p 1, … , p N [in our example, N = 2, p 1 = p(ON) = 0.9, and p 2 = p(OFF) = 0.1], he derived entropy (H), the average information per symbol in a set of symbols, to be p 1 × h(p 1) + p 2 × h(p 2) + · · · + p N × h(p N). Therefore,

In our case there are two symbols (ON/OFF) and entropy is expressed by the following:

The “logarithmic base corresponds to the choice of a unit for measuring information” according to Shannon (Reference Shannon1948, p. 379). Here we use base 2 to represent the ON and OFF symbols. Section 2.3 describes how this can be applied to calculate the entropy of a linkograph.
1.3. Sketching and blindfolded designing
This section depicts the background of the two different experimental conditions that we deploy linkography entropy measurement.
Do architects necessarily start designing with external representations in the early stages of design? Anecdotal examples are often quoted of major architects such as Frank Lloyd Wright, who could conceive of and develop a design entirely using imagery with an external representation of the design only being produced at the end of the process (Franklin, Reference Franklin2003). It should be possible for some designers to develop and maintain an internal designing activity for a prolonged time. We refer to this activity as the use of imagery alone in designing.
The earliest published experimental study related to the use of imagery alone in designing is that of Athavankar (Reference Athavankar1997). He conducted an experiment in which an industrial designer was required to design a product in imagery (with an eye mask on), having no access to sketching and the visual feedback it provides. The study showed that the expert was able to use imagery alone in the conceptual design phase before externalizing the design thoughts. Similar results were obtained in a study with software designers (Petre & Blackwell, Reference Petre and Blackwell1999) in which they were required to design using their mental imagery alone. These results inform the possible cognitive processes and mechanisms that might be involved in blindfolded designing.
We present two views on imagery and sketching activities in design that also distinguishes between them. In the first view, sketching directly produces images and ideas externalized on paper and then the designer starts to have a dialogue with them via their perceptual mechanisms. In this way, the design problem is explored, and restructured through this dialogue (Goldschmidt, Reference Goldschmidt and Trappl1990; Schön & Wiggins, Reference Schön and Wiggins1992; Suwa et al., Reference Suwa, Purcell and Gero1998). As with sketching activity, there is a dialogue with direct perceptual input from drawings to restructure the design problem. In the second view, during the use of imagery alone for designing (designing without sketching), a designer has to accumulate considerable amount of knowledge/meaning before an image is generated. This suggests a formulation of concepts without drawings and without seeing.
Bilda et al. (Reference Bilda, Gero and Purcell2006) studied blindfolded architects with an approach similar to Athavankar's (Reference Athavankar1997) study. At the end of the blindfolded designing, the participants were asked to quickly sketch the design solution they held in their minds. When the participants were blindfolded, they were able to produce designs by using their cognitive resources to create and hold an internal representation of the design.
In another study Bilda et al. (Reference Bilda, Gero and Purcell2006) presented the cognitive activity differences of three expert architects when they design under blindfolded and sketching conditions. It was observed that all participants' overall cognitive activity in the blindfolded condition dropped below their activity in the sketching condition approximately after 20 min during the timeline of the design sessions. This drop was explained by limitations of visuospatial working memory in the blindfolded conditions. The results showed that sketching off-loaded visuospatial working memory.
In this paper we use entropy to investigate whether the working memory limitations have an impact on idea development. Evidence in working memory research supports that the cognitive load should be higher in a blindfolded condition because image maintenance and synthesis of images requires more executive control resources (Baddeley et al., Reference Baddeley, Emsile, Kolodny and Duncan1998; Pearson et al., Reference Pearson, Logie and Gilhooly1999). Similar results have been obtained for the phonological loop of the working memory when verbal tasks were performed using imagery (Baddeley, Reference Baddeley1986). Other empirical studies on visuospatial working memory also show that the capacity of the visuospatial working memory is limited when visuospatial tasks are done using imagery (Walker et al., Reference Walker, Hitch and Duroe1993; Ballard et al., Reference Ballard, Hayhoe and Pelz1995; Phillips & Christie, Reference Phillips and Christie1997). We presume that the design ideas could have a visuospatial mode and a verbal conceptual mode in imagery working in parallel. Because there is a working memory limitation when using imagery, the idea development could slow down after a while during the timeline of the blindfolded designing activity. Contrarily, sketching activity could support and improve the idea development activity because working memory is off-loaded continuously.
2. METHOD
The question we posed could be paraphrased as, “Can an entropy measurement be used as a quantitative tool to study design protocols?” This section explains how two sets of design protocols from two different conditions were collected, coded, and measured using entropy for comparison.
2.1. Design of the experiments
We conducted think-aloud designing experiments with six architects. The six architects who participated (two female, four male) have each been practicing for more than 15 years. Architects A1 and A2 run their own companies and have been awarded prizes for their designs in Australia; architect A3 is a senior designer in a well-known architectural firm. These three participants were teaching part time in design studios. Architect A4 works for one the Australia's largest architectural companies and has been the leader of many residential building projects from small to large scales. Architect A5 is one of the founders and director of an award wining architectural company. Architect A6 is a very famous residential architect in Sydney, and directs a company with 50 employees known by the architect's name.
The first group of the three architects (A1, A2, and A3) were initially engaged in a design process with design brief 01, during which they are not allowed to sketch. These blindfolded designing sessions are designated BF. One month after this experimental condition the same three architects were engaged in a design process with design brief 02, during which they are allowed to sketch. These sketching sessions are designated SK. Design brief 01 requires designing a house for two artists, a painter and a dancer. The house is to have two studios; an observatory; a sculpture garden; and living, eating, and sleeping areas. Design brief 02 requires designing a house on the same site as design brief 01, but this time for a couple with five children ages 3–17. It must also accommodate children and parent sleeping areas and family, study, guest house, eating, and outdoor playing spaces.
The second group of the three architects was first engaged in the sketching session during which they received design brief 02. Then after 1 month they were working on design brief 01 under the blindfolded condition during which they were not allowed to sketch.
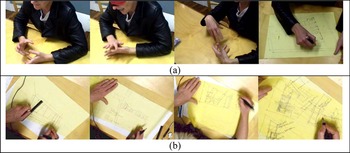
The setup of the study for both BF and SK conditions has a digital videorecorder with a lapel microphone directed at the designer. Under the BF condition, the architects were required to put on a blindfold and start thinking aloud (Fig. 2a). At the end of the blindfolded session, they were asked to take off the blindfold and quickly sketch what they held in their minds in the allowed 5-min period. Under the sketch condition, the architects were required to think aloud and sketch. The details of the experimental procedure can be found in Bilda et al. (Reference Bilda, Gero and Purcell2006).
(a) A blindfolded (BF) session followed by quick sketching and (b) a sketching (SK) session. [A color version of this figure can be viewed online at www.journals.cambridge.org]

2.2. Establishing the links
The linkography technique involves dividing the protocol into design moves (Goldschmidt, 1991) and examining the design process in terms of relationships created by the links between those moves. In this study we segmented the protocols according to designers' intentions (Suwa et al., Reference Suwa, Purcell and Gero1998). Suwa et al. (Reference Suwa, Purcell and Gero1998) discussed that this segmentation technique was similar to the notion of design moves. Thus, we used the same segmented intervals in the process of establishing links.
The process of establishing the idea links between the segments is carried out in two runs. In the first run, the analyzer starts from the first segment and sequentially establishes the links between the ideas, based on the revisited meanings among the segments. The analyzer relies on the verbalization while linking the ideas in the blindfolded designing protocols. During linking the ideas of sketching protocols, video footage for each segment was inspected as well. Linking the ideas in protocols could be a difficult task if the analyzer loses track of the ideas developed previously along the time line of the protocol session. To prevent missing links and for linking the ideas more reliably, we employed a technique that involves a word search to detect the words used more frequently so that the analyzer ends up with a list of frequently repeated words in each segment. The next stage is browsing through the selected segments, to confirm that the words are used in the appropriate context. If the meanings in the segments are related, then these ideas are established. This procedure helps us to establish the links that are distant from each other and that might have been missed in a sequential analysis.
2.3. Entropy measurement
In our measure of linkograph entropy we are interested not only in the number of linked segments but also the distribution of those links. Two extremes example are an empty linked (none of the segments is related) and a fully linked (all the segments are linked) linkograph. An empty linked linkograph can be considered as a nonconverging process with no coherent ideas and a fully linked linkograph stands for a wholly integrated process with no diversification. In both cases the opportunities for idea development are very low. This line of reasoning can be expressed in terms of entropy; if we randomly pick a segment in an empty linked linkograph we can be sure that it has no links. This sounds obvious, but if we consider this linkograph as a carrier with zero information content, because the outcome is known, it will have zero entropy. Similarly, a fully linked linkograph will also have zero entropy.
For the entropy measurement of a linkograph to be meaningful, we follow Kan and Gero's (in press) measurement method, which is based on the conceptual differences between forelink, backlink, and horizontal link (called “horizon link”). Entropy is measured in rows of forelinks, backlinks, and horizon links separately. Consider an abstracted linkograph with four segments in Figure 3. The links between ideas are denoted by black dots and the gray dots denote possible linkages but not actually linked. We are going to calculate forelink entropy for each segment except the last two segments. As seen in Figure 3a, segment 4 will not have forelinks and segment 3 is either linked or unlinked to segment 4, which will have zero entropy. Similarly each segment except the first two, will receive a backlink entropy (Fig. 3b). Segments can be linked to a previous segment (n − 1) or segments further apart (Fig. 3c). Horizon link carries the notion of distance/time between the linked segments. Segments that reside in working memory will usually have high interconnections; we refer to these linkages as the cohesiveness of segments. We refer to links that connect segments that are far apart and those that are not in working memory as incubated linked segments.
An abstracted linkograph for entropy measurement. Back dots denote linkage between segments. Measured are the entropy of (a) forelinks of each row, (b) backlinks of each row, and (c) horizon links.

For calculating the forelink entropy of an individual segment in Figure 3a, we marked them by a rectangle. In segment 1 there are three nodes for links inside the rectangle; segments 1 and 2 are unlinked, whereas segment 1 is linked to segments 3 and 4. The percentage of linked nodes is 66.6%, and the percentage of unlinked nodes is 33.3%. If we consider linked nodes as ON and unlinked nodes as OFF, the respective probabilities will be p(ON) = 0.666 and p(OFF) = 0.333.
This case is the same as the example in Section 1.2 so we can use formula (3) to calculate forelink H for segment 1, which becomes:

Similarly, for segment 2 the forelink H is

As we can see for segment 3, there is only one possible link. No matter whether it is ON or OFF, the probability is 1 and the entropy is 0 because log2(1) = 0.
Using this method, the backlink entropy for segments 3 and 4 in Figure 3b are 0 and 0.918, respectively.
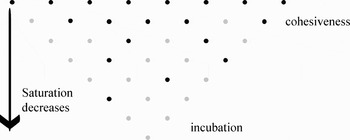
For the horizon link entropy we consider, in this case, the two rows n − 1 and n − 2. Using formula (3) we can attain the entropy of the n − 1 row, which is 0.918, and the entropy of the n − 2 row, which is 1. Because people have limited short-term memory (Miller, Reference Miller1956), if we follow Miller's “magic number seven plus or minus two” objects, linkographs seldom have segments with more than nine links and the number of links between far apart segments will decrease. Figure 4 shows a typical linkograph, which has many cohesive links but very few incubated links. For a fully cohesive link, for example, all ON in n − 1 will have 0 horizon link entropy; similarly, if there is no incubated links that row will score 0 in horizon link entropy as well.
A linkography with typical distribution of links during a design process.

If an idea is weak, it will not have many forelinks, which is represented by low entropy. However, if an idea has too many forelinks, this might indicate fixation; this is also indicated by low entropy. Backlink entropy measures the opportunities according to enhancements or responses. If an idea is very novel, it will not have backlinks. The resulting entropy is low. Conversely, if an idea is backlinked to all previous ideas, it is not novel. Hence, it is represented by low entropy. Horizon link entropy measures the occurrence of incubated segments. Low horizon link entropy indicates complete cohesiveness. Horizon link entropy measures the opportunities relating to cohesiveness and incubation.
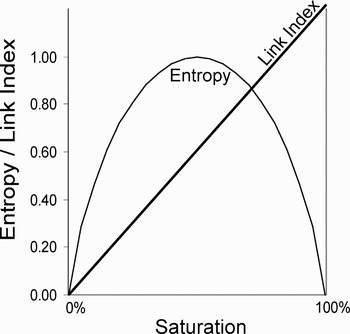
In general, we agree that intensive linking design moves may yield good designs. However, the intensity should only advance to a certain point. In the early stage of designing, fixation is not desirable. Fixation is indicated by a move with near-saturated forelinks. Kan and Gero (in press) suggested that forelink entropy measures the idea generation opportunities in terms of new creations or initiations. Figure 5 compares the link index measurement with the entropy measurement of a move. A heavily linked and a sparsely linked linkograph will have low entropy values. However, the link index increases as the number of links increases. The slope of the link index in the Figure 5 is not fixed, because it is determined by the total number of move of the linkograph. In this particular graph, we can observe that the link index agrees with the entropy until the lines intersect at about 75% of saturation. It is very rare to have linkographs over 10 moves with that level of saturation. After this point, entropy drops while the link index score continues to increase.
A comparison of the link index and entropy measurement.

In our cumulative entropy measurement we are counting the contribution of each move in three different ways: according to initiations (forelinks), responses (backlinks), and cohesiveness (horizon links).
3. RESULTS
A previous study showed that the overall cognitive activity in the blindfolded condition dropped below the activity in the sketching condition approximately after 20 min (halfway) into the design sessions (Bilda & Gero, Reference Bilda and Gero2007). This drop in performance can be explained by higher cognitive demands and limitations of visuospatial working memory in blindfolded conditions. However, with this drop of cognitive activity in the blindfolded condition, the architects could still produce satisfactory designs. Their design outcomes (sketches) were judged by a qualified jury of three designers. It was surprising that all the blindfolded sessions received a higher score compared to the corresponding sketch sessions. We attempt to explore these phenomena by using entropy measures of the linkographs.
3.1. Linkographs of the sessions
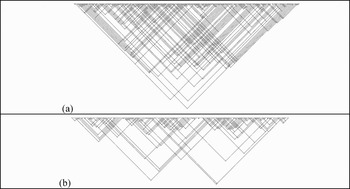
After coding the links, the 12 linkographs of the sessions were produced. They exhibit different patterns that reflect different design processes. For example, the linkograph in Figure 6a reflects a relatively holistic design process (the linkograph is well integrated), whereas the linkograph in Figure 6b represents a process of trying out different options (there are obvious clusters in the linkograph). This observation was confirmed with our qualitative analysis.
Linkographs of (a) a sketch session and (b) a blindfolded session.

The detailed qualitative analysis of the 12 linkographs is beyond the scope of this paper. Here we examine whether the drop in cognitive activity in the blindfolded session is reflected in the linkograph.
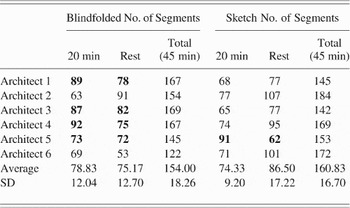
Looking at the linkograph, some of the blindfolded sessions seem to suggest a more productive process according to Goldschmidt's definition because of the visual density of links. Bilda et al. (Reference Bilda, Gero and Purcell2006) showed that for the six architects' design sessions, the frequencies of cognitive activities were correlated to the number of links: more activities will result in more links. However, inspecting the linkographs we cannot track down where the cognitive activity started to drop as reported by the previous study (Bilda et al., Reference Bilda, Gero and Purcell2006). Each design session was approximately 45 min. We count the segments of the first 20 min in all the sessions compared to the rest of the session (Table 2). The blindfolded sessions have slightly more segments in the first half of the session; this is consistent with the previous result (Bilda et al., Reference Bilda, Gero and Purcell2006). Again, assuming cognitive activity can be reflected in the number of segments, will the number of links among segments drop as well? Visually the number of links does not seem to drop in the second half. The average and standard deviation in Table 2 are for reference only; each case should be looked at individually.
Number of segments in the first 20 min and the rest of the session

The sessions where the number of segments drop after 20 min are in bold.
3.2. Entropy of the sessions
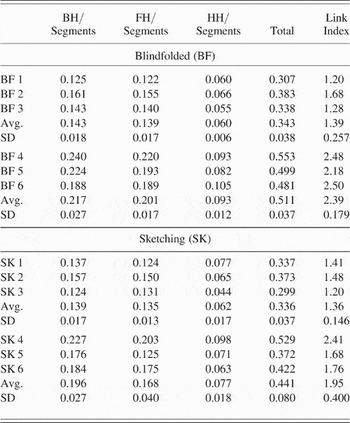
We use Eq. (3) to calculate the forelink and backlink entropy of each segment in a linkograph. To produce a picture of the whole session, we add the entropy of each segment to obtain the total forelink and backlink entropy of a session. Likewise, we obtain the total horizon link entropy by adding the entropy of all the horizontal rows. We normalize the results by dividing the entropy by the total number of segments in that session. Table 3 shows the normalized results of entropy of each session together with their link index. Average and standard deviation values are calculated for the two groups of experiments. Overall, the blindfolded sessions have higher entropies and link indices in both groups. Only the first architect in the first group does not follow this trend.
Entropy and link index of each session

BH, entropy of backlinks; FH, entropy of forelinks; HH, entropy of horizon links.
Table 3 shows that the first group of three architects' blindfolded and sketch sessions have very similar link indices (averages = 1.39 and 1.36) and entropy values (averages = 0.343 and 0.336). For the second group of architects, the average link index and average total entropy are higher in the blindfolded condition compared to their sketch condition (0.511 and 0.441 vs. 2.39 and 1.95) with a relatively small standard deviation in the blindfolded condition. We observe that for the second group of architects the link index and the entropy of the blindfolded sessions are the highest. This difference could be because of the experimental condition. The second group received the sketching exercise first and the blindfolded exercise later. The second group had an increased familiarity with the problem, including the site geometry and the environmental factors around the building. This familiarity with the problem could have improved the second group's potential for idea development, hence higher entropy. In general, the BF sessions have higher entropy. Could this account for their better design outcome?
In general, backlink entropy is higher than forelink entropy, with the exception of one sketch session (SK 3) and one blindfolded session (BF 6, small difference). SK 3 received the highest rank by the judges in the categories of “innovative” and “creative.” Can this indicate that forelink entropy reflects idea generation potential based on new initiations that may reflect creativity? The relationship between forelink entropy and creativity needs further investigation, and is inconclusive based on these results.
The horizon link entropy is much lower than forelink and backlink entropies because of this fundamental dissimilarity. Forelink and backlink entropy examines links in each move, but horizon link examines the degree of cohesion and incubation of the segments. This measure needs further exploration.
3.3. Entropy in the first half and second half of the sessions
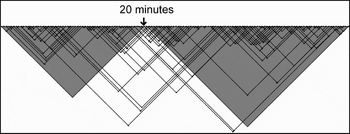
In this section we explore whether the entropy drops halfway through the blindfolded design process because of working memory limitations. In Table 2 we can see the total number of segments dropped after 20 min in the blindfolded session, but looking at the linkographs the density of links does not appear to drop. If we use the segment at 20 min to divide the linkographs, we can calculate to see if entropy drops as the cognitive activities drop. Figure 6 shows the division to calculate the entropy of the first and second half of a linkograph. We compared them to determine if there is a significant difference between the blindfolded and sketch conditions. We chose 20 min as a demarcation, based on a previous study, where the first three participants' cognitive performance under blindfolded conditions dropped below their performance under sketch conditions, after around 20 min (Bilda et al., Reference Bilda, Gero and Purcell2006).
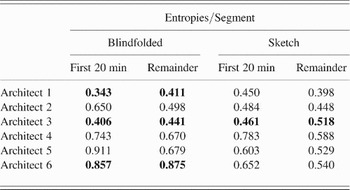
In this calculation we ignore those links outside the shaded triangles in Figure 7. The results in Table 4 show that in both conditions there is a drop in entropy in the second half of the sessions. Under the sketch condition, five of the six sessions has lower entropy in the second half; conversely, half of blindfolded sessions have higher entropy. There is no direct relationship between cognitive activities drop and entropy drop.
Calculating the entropies of the first and second half of the linkograph. Only links within the gray triangles are counted.

Total normalized entropies of each session

The sessions without entropy drop after 20 min are in bold.
Generally, the entropy per segment of the second half of the session is lower than the first half. This parallels our assumption that entropy measures the opportunities for idea generation. In the second half, designers are approaching the end of a session and the design converges to a particular approach. Therefore, fewer opportunities occur for idea development. Consequently, the entropy values would be lower in the second half compared to the first. What accounts for the increases of entropy in three of the BF sessions?
To understand what is happening to the idea links, we have to refer to Eq. (3) plotted in Figure 5. Either a heavily linked or a sparsely linked second half linkograph will have low entropy values. Reviewing the 12 linkographs, we conclude they all fit into the second case, that is, the linked ideas are sparse. A higher value of entropy implies more linkage among segments, hence better integration of ideas. According to Table 4, half of the blindfolded sessions have higher entropy in the second half of the session. This might suggest that working with limited visuospatial working memory under the BF condition does not have a noticeable impact on the interconnectivity of ideas compared to the SK condition.
3.4. Change of entropy over time
From the linkographs of Figure 7 and number of segments in Table 4, it is possible to infer that the entropy varies across the time line. In this section we explore the change of entropy over a design session to see if the entropy will decrease toward the end of a session.
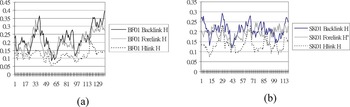
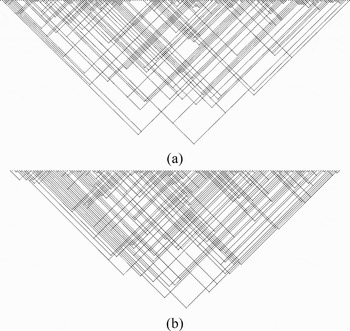
There are two approaches for monitoring these changes; one uses a fixed time frame as a reference window as in Figure 7, and the other uses a fixed number of segments as the width of window. It is easier to use a fixed number of segments for reference as the procedure can be readily automated. Figure 8 shows A1's backlink, forelink, and horizontal link entropy changes using 28 segments as a window width. Figure 9 shows the corresponding linkographs.
The change of entropy in (a) a blindfolded condition and (b) a sketch condition. [A color version of this figure can be viewed online at www.journals.cambridge.org]

Linkographs of (a) a blindfolded session and (b) a sketch session.

We can identify two regularities in these graphs: the relationship between the three types of link entropies and the overall trend. The backlinks, forelinks, and horizontal links vary in the same direction. The trend of the variation shows the same pattern.
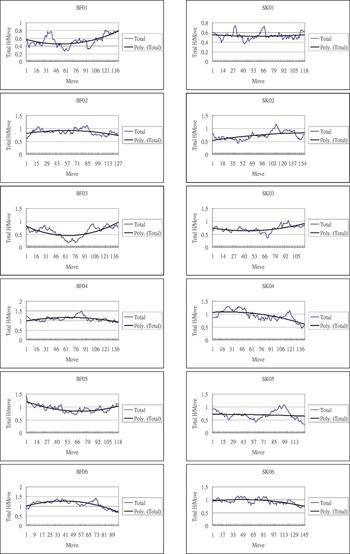
Figure 10 shows the overall trends for all 12 sessions with a quadratic (second degree) polynomial fit of the total normalized entropy. There are three basic shapes of a quadratic equation: linear, concave, and convex. The concave shape trend suggests that the entropy values are climbing toward the end of the session, whereas the convex shape trend suggests the opposite. It can be observed that this trend remains the same in each architect's blindfolded and sketch session. Can this represent the style of thinking? More studies are needed to relate the graphs and the qualitative analysis. Another interesting observation is that the top three highest scored sessions have concave shape curves and the bottom three lowest scored sessions have convex shape curves.
The polynomial fit of the total normalized entropy with the three highest and three lowest scored sessions highlighted in darker and lighter gray, respectively. [A color version of this figure can be viewed online at www.journals.cambridge.org]

As explained in the previous section, higher entropy toward the end of the session suggests better interconnectivity of ideas. Can this better integration of ideas toward the end suggest the quality of a session, and hence receive better score? There are insufficient cases to validate this; however, this is an instance that suggests the design outcome could be related to the change of entropy of the linkograph that is worth investigating.
4. CONCLUSIONS
Kan and Gero (in press) showed that an entropy measure of linkographs could be a useful tool to measure idea development. In this paper we tested this method to determine whether this measurement gives any meaningful result with 12 design sessions in two different conditions, and if working memory limitations has an impact on the potential for idea development—better integration of ideas in these cases as indicated by our entropy measure.
The results in this paper are that there were indications that linkograph entropy reflects design outcome and the integration of segments (ideas) did not necessarily decrease after some time during the use of imagery alone.
All but one blindfolded designing session had higher entropy than their corresponding sketch sessions (Table 3). This paralleled the results of the judges: all the blindfolded sessions received better scores than their corresponding sketch sessions. The session that had forelink entropy higher than backlink entropy received the highest rank in the categories of innovative and creative. Further investigations are required to study these speculations.
Bilda and Gero (Reference Bilda and Gero2007) suggested that the cognitive load (working memory load) might be related to perceptual activity rather than functional activity. The visuospatial tasks that require executive resources in working memory might create the cognitive load, but not necessarily the concept/meaning formation. Similarly, assuming that idea development in imagery is concept related rather than figure related, results in this paper support these previous findings.
In conclusion, entropy measurement of linkographs provides a way of interpreting linkographs that requires further inquiry. Using this measurement we find evidence that the visuospatial working memory load does not have negative effects on idea development. Further, we hypothesize that idea development could be dependent more on a conceptual modality than the visuospatial modality.
5. QUESTIONS AND ANSWERS
5.1. Question 1
“I'm having trouble understanding why you think this entropy measurement is meaningful because these links represent different kinds of information. You treat each link as if they were the same kind of “thing.” If you consider that the links might represent how difficult it is to deal with the information, then perhaps the link density might actually measure information density and the difficult of flow of data between the links.”
5.2. Answer 1
“In this exploration, we used linkograph to capture the interconnectivity of ideas/moves. Previous studies (Goldschmidt, Reference Goldschmidt and Kalay1992; Van der Lugt, Reference Van der Lugt2003) suggested that linkograph could reveal the quality of design ideas. We proposed to use Shannon's entropy, as a new method, to abstract information from linkographs based on the premise that an empty and a fully linked linkograph are not interesting. If all moves are unrelated, there are no converging ideas; hence, very low opportunity for idea development. If all moves are interconnected there is no diversification, hinting that a premature crystallization or fixation of one idea may have occurred; therefore, there is a very low opportunity for novel idea. A high entropy value indicates almost half of the moves/ideas are linked, which we consider as a desirable process. A low entropy value indicates either links are very sparse or very dense. Although this abstraction represents a different kind of information compared to the original data, our results show some correlation between entropy and design outcome. Entropy measurement of coded protocol data is at its infancy stage of development; we anticipate it may provide a new approach to look at protocol studies data, and may offer insight on design activities.”
ACKNOWLEDGMENTS
This research was supported by an International Postgraduate Research Scholarship and a University of Sydney International Postgraduate Award. Facilities were provided by the Key Centre of Design Computing and Cognition. We thank the architects who participated in this study.
Jeff W.T. Kan is a PhD student at the University of Sydney, holding the International Postgraduate Research Award by the Australian Department of Education. His study focuses on developing quantitative methods to study the cognitive behavior of designers. He formerly taught design studio and computer-aided design at the Department of Architecture, Chinese University of Hong Kong. He has published papers on architectural visual information system, online interactive teaching materials, architectural visual impact studies, and methods to study design activities.
Zafer Bilda is currently a Research Associate at Creativity and Cognition Studios. He completed his PhD in design computing and cognition at the University of Sydney. He was awarded an International Postgraduate Research Award (IPRS) by the Department of Education Australia to undertake his PhD, and he is a holder of a Fulbright Scholarship awarded by the American–Turkish Association. His research agenda involves cognitive studies of designers and cognitive studies of interactive experiences. Dr. Bilda has published on design studies, computer-aided design, cognitive science, and recently on interactive art experiences.
John S. Gero is a Research Professor at the Krasnow Institute for Advanced Study and in the Department of Computer Science, George Mason University, and Visiting Professor at the Massachusetts Institute of Technology. Formerly he was a Professor of Design Science and Co-Director of the Key Centre of Design Computing at the University of Sydney. Dr. Gero is the author/editor of 43 books and has published over 550 research papers. He has been a Visiting Professor of architecture, civil engineering, cognitive psychology, computer science, design and computation, and mechanical engineering in the United States, United Kingdom, France, and Switzerland. His research focuses on computational, cognitive, and neurocognitive studies of designing.