I. INTRODUCTION
Advances in the fabrication of nanostructures of different materials with desired tunable morphologies have been fueled up due to the demonstration of their prominent aspects in optoelectronics, catalysis, sensing, and medicine, Reference Kido, Kimura and Nagai1–Reference Li, Cunin, Link, Gao, Betts, Reiver, Chin, Bhatia and Sailor9 as compared to the bulk material, not only in basic scientific research but also in technological applications. Among various oxides, ZnO is a fascinating material containing the most plenteous family of the nanostructures with a wide band gap and large exciton binding energy. Additionally, the reason for focusing more attention on research toward the ZnO material is due to its promising versatile semiconducting and excellent piezoelectric properties, and ease of use in fabrication. Reference Schmidt-Mende and MacManus-Driscoll10–Reference Qin, Yang and Wang12 One-dimensional ZnO nanostructures e.g., nanorods, nanobelts, nanohelix, nanobridges, nanonails, mesoporous polyhedral cages, and nanotubes, Reference Lee, Minegishi, Park, Park, Ha, Lee, Lee, Ahn, Kim, Jeon and Yao13–Reference Israr, Sadaf, Yang, Nur, Willander, Palisaitis and Persson18 etc. have proven their potential in diverse fields. In many applications, the growth of the crystalline structure, a large surface-to-volume ratio, shape, size, and density of the nanostructures are the key factors. Reference Garcia and Semancik19–Reference Wang, Waje, Wang, Tang and Haddon23 These factors play a crucial role in the agglomeration in the growth process to achieve diverse shaped morphologies. The extension of the surface area can be achieved by decreasing the particle size and designing the structural morphology of the material. The majority of the vapor-based synthesis techniques are expensive and environmentally hazardous, whereas aqueous chemical solution methods offer a number of advantages over other processes due to their low temperature requirements, simplicity in growth, cost efficiency, and environmentally benign nature for large-scale production. In addition, solution growth processes have depicted their talent for controlled, homogeneous and unique diverse designs for the growth of nano/microstructures. Despite these successes, the development of cost-proficient and straightforward devices with controlled dimensions for industrial application is still a long-term challenge.
The formation of systematic single crystalline hierarchical complex structures from the self-assembly order of the single crystalline nanoscale structures has become the burning topic of materials research. Generally, ZnO complex structures are being grown homogeneously using single- or multistage reactions using additives such as poly-ethylene glycol, citrate ions, etc.; Reference Liu, Huang, Sulieman, Sun and He24−Reference Liu and Zeng26 however, research on the heterogeneous synthesis of hierarchical structures without using any external precursor is very rare. Here we report a single step, fast, and facile low-temperature (80 °C) solution growth technique for the fabrication of ZnO ellipsoids on a silicon substrate (001) without using any template or external precursors. Two different trends of structural modification from nanorods to ellipsoidal structures with respect to the reaction duration of the solution are presented. The grown ZnO ellipsoids have a high density, uniformity, and a smooth surface with their sizes in the range of micrometers. In addition, optical properties of the intermediate and the final structures have been analyzed by cathodoluminescence (CL).
II. EXPERIMENTAL DETAILS
A. Synthesis of ZnO nanostructures
Zinc nitrate hexahydrate and hexamethylenetetramine were commercially purchased from Sigma Aldrich with a purity of 99.99% and were used without further purification. Silicon wafer (001) was cut into smaller substrates and consequently washed in acetone and ethanol organic solutions for 10 min each by using an ultrasonication bath. The cleaned substrates were washed in distilled water followed by a nitrogen blow to dry them. Two separate aqueous solutions, 0.05 M concentration of zinc nitrate hexahydrate and 0.075 M concentration of hexamethylenetetramine, of volume 75 mL for each solvent were prepared and then mixed together. The prepared aqueous chemical solution was placed in a preheated laboratory oven at 80 °C for 1, 2, 3, and 4 h. The resulting products were washed with deionized water and dried with nitrogen blow for further characterization.
B. Morphological and structural characterizations
The surface morphology and dimensions of the grown ZnO nano/microstructures were observed by using field emission scanning electron microscope (FESEM JEOL JSM-6335F).The chemical composition of the final structure of the ellipsoid was measured by using an energy dispersive spectrometer attached with the FESEM equipment. Transmission electron microscopy (TEM Philips CM20 UT) was used to take a deeper look to confirm the growth pattern of primary and secondary nanorods, the crystalline nature, and the growth orientation of the synthesized product. Moreover, x-ray powder diffraction (XRD) with Cu Kα radiation (λ = 1.54 Å) (Bragg–Brentano diffractometer) was used to derive the conclusion about the crystal structure and the purity of the ZnO ellipsoids.
C. Optical characterization
A high spatial resolution CL setup mounted on the FEI quanta 200 scanning electron microscope (SEM) using liquid nitrogen cooled charge-coupled device camera was used to derive the conclusions about the defect distribution in the intermediate and final structures of the ZnO ellipsoids and monochromatic CL images were obtained for selected wavelengths using a single-channel photomultiplier tube.
III. RESULTS AND DISCUSSION
In this study, we kept all the remaining parameters unchanged, and the crystal growth procedure of the different stages of the ZnO ellipsoid was governed merely by the function of reaction time. To understand the growth mechanism of ZnO ellipsoids, the kinetics of the crystal nucleation in the solution need to be taken into account. The classical theory for the nucleation and crystal growth indicates that the free energy change is governed by the production of the precipitate of nanoparticles from the solution onto a surface, where this precipitation of a solid phase is associated with the solution conditions. Gibbs has introduced a formal equation for the free energy change during the formation of new phase which is the combination of the free energy change for the formation of the nucleus surface and the free energy change for the phase transformation. Reference Myerson27 Thus,
 $$\Delta G = \Delta {G_{\rm{S}}} + \Delta {G_{\rm{v}}} = \beta {L^2}\sigma + \alpha {L^3}\Delta {G_{\rm{v}}}\quad .$$
Here, σ is the interfacial energy per area between liquid and vapor; β is the area and α is the volume shape factors grounded on the characteristic length L, respectively; and ∆G v is the free energy difference per volume between the vapor and liquid phases. Volmer has reported the treatment of the energies of forming liquid nuclei on solid bodies from supersaturated vapor. The free energy difference, ∆G cr, between a liquid nucleus of critical size and the supersaturated vapor is: Reference Myerson27
 $$\Delta {G_{{\rm{cr}}}} = {{16\pi {\sigma ^3}{v^2}} \over {3{{\left( {nkT\ln \;S} \right)}^2}}}\quad ,$$
where S represents the degree of supersaturation in the solution, n is the aggregation number, k is the Boltzmann’s constant, and T is the temperature. At the beginning the nucleation of the solid phase can be either homogeneous or heterogeneous, depending on the net interfacial energy of the system. However, the heterogeneous nucleation in the presence of the foreign substrate in the solution is more favorable than homogeneous nucleation due to the presence of lower interfacial energy. Turnbell and Vonnegut predicted that the kinetics of the heterogeneous nucleation can be described by a single parameter, contact angle θ, in addition to the parameters required for the homogeneous nucleation. Reference Turnbull and Vonnegut28
The free energy of formation, ∆G cr*, of a liquid nucleus of critical size on the catalyst surface is:
 $$\Delta G_{{\rm{cr}}}^* = \Delta {G_{{\rm{cr}}}}f\left( \theta \right)\quad ,$$
 $$f\left( \theta \right) = {{\left( {2 + \cos \theta } \right){{\left( {1 - \cos \theta } \right)}^2}} \over 4}\quad .$$
For θ < 180° f(θ) < 1 and
 $\Delta G_{{\rm{cr}}}^* \lt \Delta {G_{{\rm{cr}}}}$
.
As mentioned earlier, the present work is focused on the qualitative observation about the transition of structural morphology of the different stages of the ZnO ellipsoid under the function of the reaction time. The interface activation energy barriers between the solid phase and the solution are always higher than the interface energy between the two solid phases. This is the reason the heterogeneous nucleation of the solid phase from the solution on the substrate is highly auspicious over the homogeneous nucleation. This is basic phenomena behind the deposition of the nanoparticles/cluster on the substrate. It was observed that nonseeded substrate played a vital role in the randomly oriented nucleation of the nanoparticles due to the presence of low interfacial energy between the newly formed solid cluster and the substrate. These nanoparticles provide the nucleation sites for further growth of the nanorods along preferred oriented directions of [0002] and
 $\left[ {000\mathop \bar2} \right]$
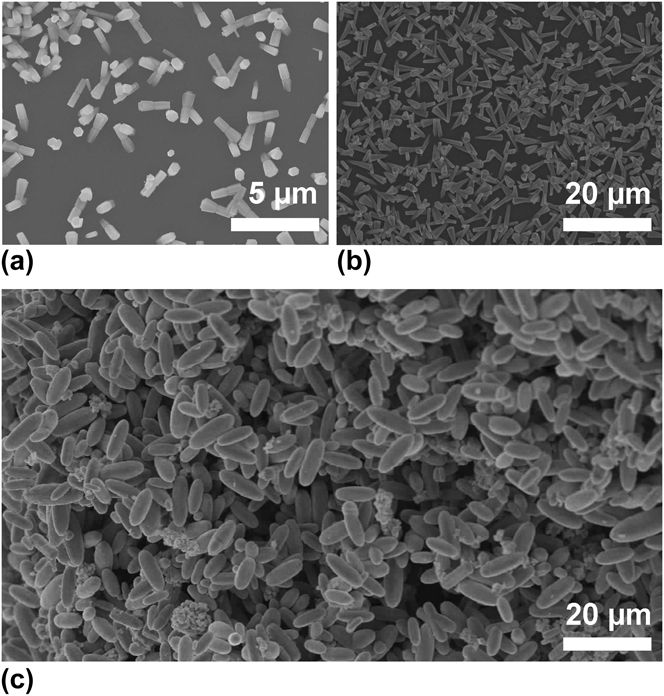
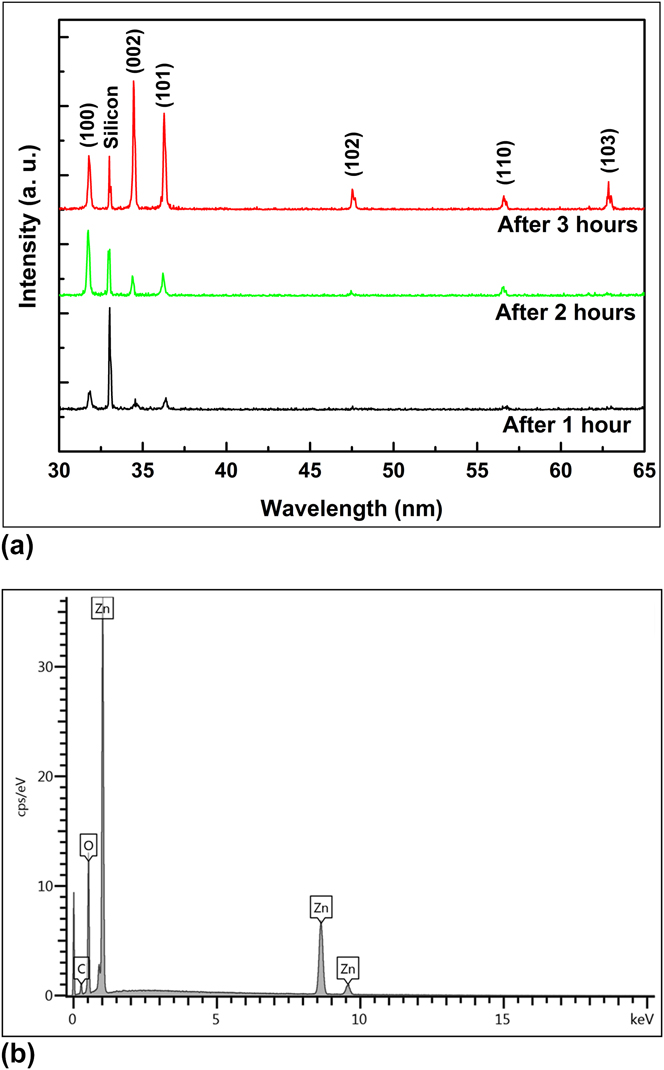
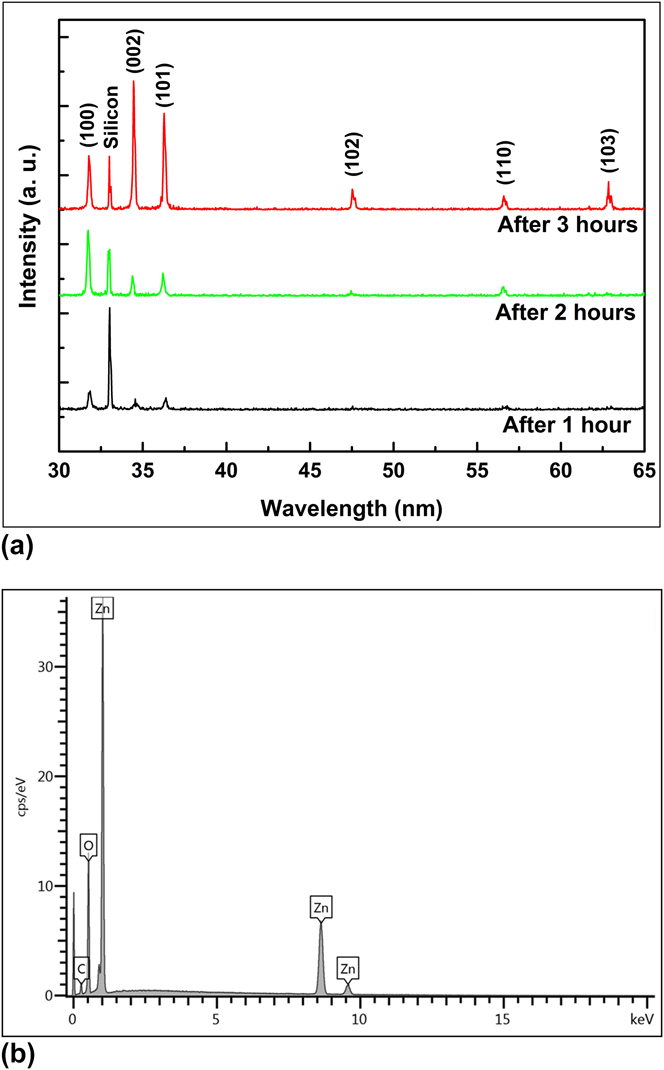
due to the large energy difference between the polar and nonpolar surfaces. Hence the initial stage of the ZnO ellipsoid growth can be understood by the nucleation phenomena at the flat surface of the substrate which is likely heterogeneous. Figure 1(a) illustrates the initial stage of ZnO ellipsoids with rod-like structures obtained after a reaction time of 1 h grown in random directions with a joint at the central position. This central joint that has more defect states provides the nucleation active sites for the secondary growth of the ZnO nanorods along the crystal's preferred growth direction [0002] beside the initial nanorods. Figure 1(b) depicts the intermediate stage of the ellipsoid with the prolongation of the reaction time to 2 h where these nanorods form a branched structure due to the fast growth crystal's habit of the secondary nucleation mechanism as compared to the primary ZnO nanorods. A further extension in the reaction time to 3 h leads to the desired smooth and fuselage structure of the ZnO ellipsoids [Fig. 1(c)]. Figure 2(a) illustrates the corresponding XRD patterns of the initial, intermediate, and final stages of the ZnO ellipsoid structures that are shown in Fig. 1. All the diffraction peaks are well defined to the pure hexagonal structure of the ZnO with lattice constants of a = 0.32487 nm and c = 0.52039 nm (JCPDS # 36-1451). However, the random growth orientation of the grown structures leads to the difference in the intensities of the relative diffraction peaks. No external impurity peaks were observed except a single peak from the silicon substrate. Moreover, the chemical composition and purity of the final structure of the ZnO ellipsoid was observed through energy dispersive x-ray spectroscopic (EDS) measurements. The EDS pattern shown in Fig. 2(b) illustrates the merely zinc- and oxygen-related energy peaks which confirms that the grown ZnO ellipsoid structure is pure and impurity free.
Low magnified SEM images at different stages of the ZnO ellipsoid as a function of reaction times: (a) 1 h, (b) 2 h, and (c) 3 h.

(a) Corresponding XRD patterns of initial, intermediate, and final stages of ZnO ellipsoid structures grown for 1, 2 and 3 h, respectively. (b) EDS pattern of ZnO ellipsoid structure.
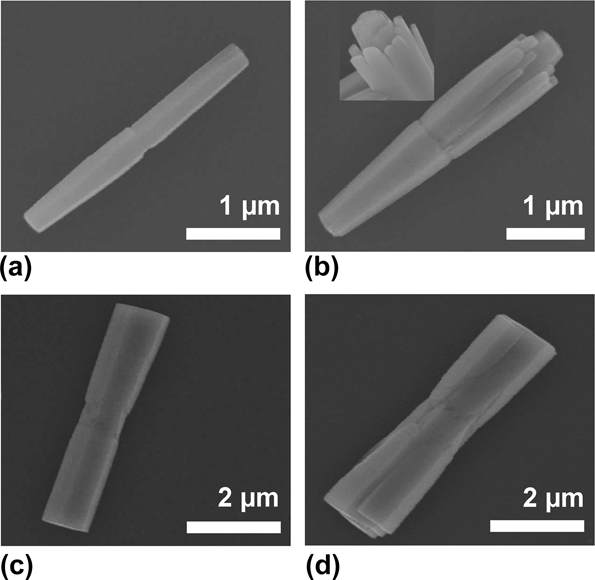
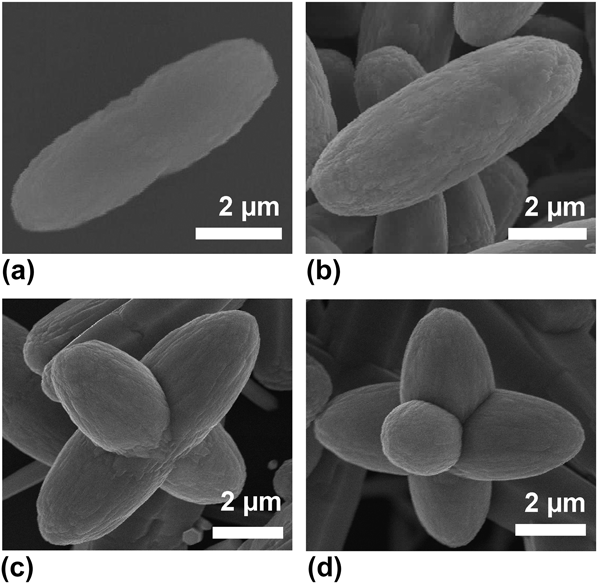
The qualitative observation about the transition of the structural morphology of the different stages of the ZnO ellipsoids can be seen in Fig. 3. Figures 3(a) and 3(c) show two different evolution trends of the same growth habit at the initial stages of the ellipsoids. The former shows twinned nanorods having the smaller common joint at the center, whereas the central joint is quite bigger in the case of the latter. The reason behind the smaller and bigger central joints could be due to the formation of the size of the initial nanoparticle on the substrate. In the highly magnified SEM image, it is clear that the initial stage of the ZnO ellipsoid has a hexagonal shape at the both the edges, showing good crystalline quality. The secondary heterogeneous crystal nucleation at this central portion is observed in both the cases which could be possibly due to the presence of the crystal defects at the joint of the primary nanorods. As seen in Fig. 3(b), the growth orientation of the secondary nanorods is along [0002] while they are directed in a slightly outward direction from the primary nanorod. Interestingly, secondary nucleation of the branched nanorods is observed only along one side of the twinned primary nanorods from the smaller joint. The inset demonstrates a more prominent view of the primary nanorods surrounded by the secondarily grown nanorods. However, Fig. 3(d) shows the nucleation of the secondary nanorods in both directions from the comparatively bigger central joint. As a result of the secondary nucleation, it is observed that the thickness of the structure is different throughout its length and the rate of increase in the diameter and length of the primary nanorod is quite different from the bunch of nanorods. As the reaction time is prolonged, secondary nanorods start to share their nonpolar faces with the primary nanorod and when their lengths become equal to that of the primary nanorods, they start to fuse with the primary nanorods. At this stage of the growth process, simultaneously two kinds of face-specific growth processes are realized: (i) along the polar direction, called axial growth and (ii) along the nonpolar direction, called equatorial growth. Reference Garcia and Semancik19 The effect of these processes dominates and the crystals grow faster in both ways, especially, due to the low density of the particles on the nonseeded substrate. However, the axial growth seems faster when compared with the equatorial growth as shown in Figs. 3(b) and 3(d). It is observed that when the length of the secondarily grown nanorods becomes equal to that of the primary nanorods, merging of these nanorods in parental nanorods would reduce the whole energy of the system. Reference Wang, Shi and Zhong29 This thermodynamically stable state results in the formation of the compact ellipsoidal shape, as shown in Fig. 4. In the final growth stage, the formation mechanism of the smooth surfaced ZnO ellipsoidal structure can be understood by the Ostwald ripening effect which works through the formation of the bigger crystals at the expense of the edges of the intermediate structures [Figs. 4(a) and 4(b)]. These results are consistent with the results already published about the formation of different 3D thermodynamically stable morphologies. Reference Jiang, Zhou, Fang, Wang, Wang and Xie30–Reference Zhang, Sun, Zhang, Yan and Yan33 Besides the large arrays of ZnO ellipsoids, few complex ZnO structures like multipods have also been synthesized as the reaction time reaches 4 h. At this stage of the growth process, it was observed that either ZnO ellipsoids begin to amalgamate with each other [Fig. 4(c)] or the central common joint of the ellipsoids provides more sites as the seeds for further protrusion of more arms perpendicular to its surface leading to complex structures as shown in Fig. 4(d).
Highly magnified SEM images of the morphological evolution of the initial and intermediate stages of ZnO ellipsoid structure showing two different trends of crystal growth habits containing branched nanorods: (a, b) along one side at 1 and 2 h, (c, d) along both sides of the central joint at 1 and 2 h.

(a) Conversion of the intermediate stage into final shape of ZnO ellipsoid. (b) Final shape of ZnO ellipsoid at 3 h. (c, d) Complex structures (multipods) after the reaction time of ∼4 h.

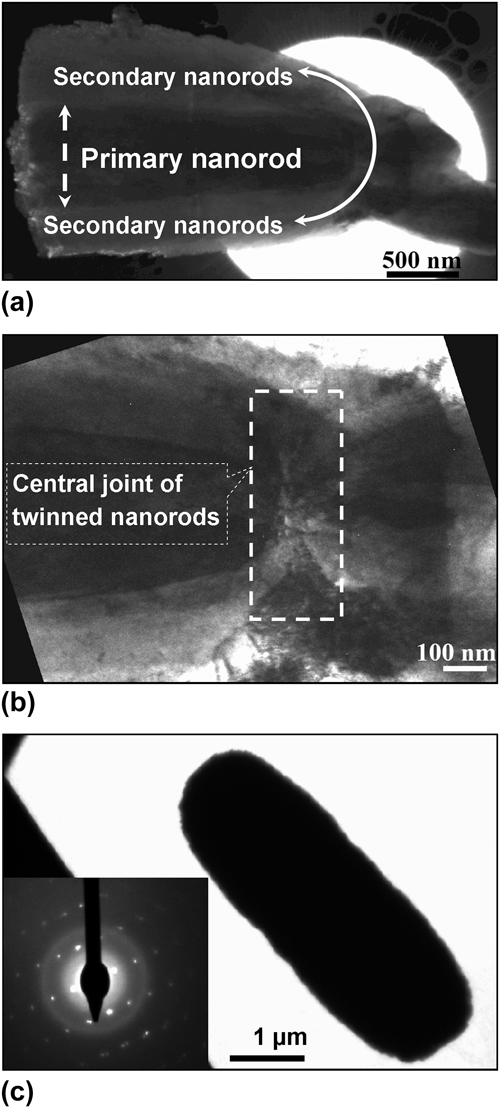
TEM examination was carried out for further structural characterization and confirmation of the above discussion about the variation in defect concentration along the whole length of the structures. The low resolution TEM image of the intermediate structure of the ellipsoid illustrates that the middle portion containing the primary nanorod is dark compared to the surrounding area [Fig. 5(a)], which means that the thickness of the primary nanorod is higher than that of the secondary ZnO nanorods. A highly magnified image of the central portion of the same structure clearly shows the joint of the twinned primary nanorods and the presence of the defects [Fig. 5(b)]. The low resolution TEM image of a single ZnO ellipsoid illustrates that its thickness is quite high ∼4 µm [Fig. 5(c)]. In the inset of Fig. 5(c), the corresponding selected area electron diffraction (SAED) pattern displays the single crystalline nature of the ZnO ellipsoid and the growth direction (i.e., along [0002]).
(a) Low resolution TEM image of intermediate stage of ZnO ellipsoid showing the primary and secondary nanorods. (b) Highly magnified TEM image of the same image showing the central joint section. (c) Low resolution image of final ZnO ellipsoid structure (inset shows the SAED pattern).

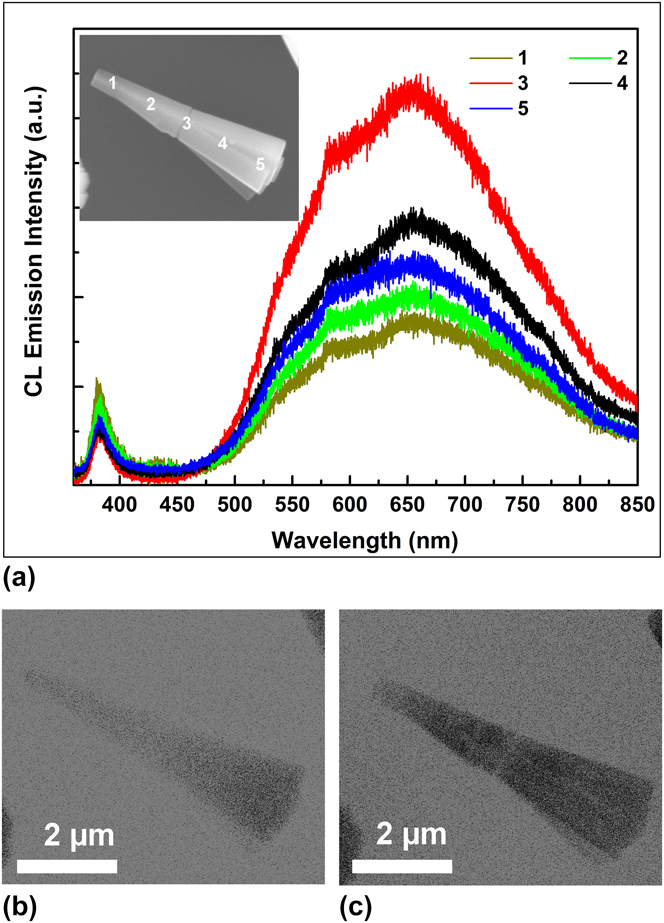
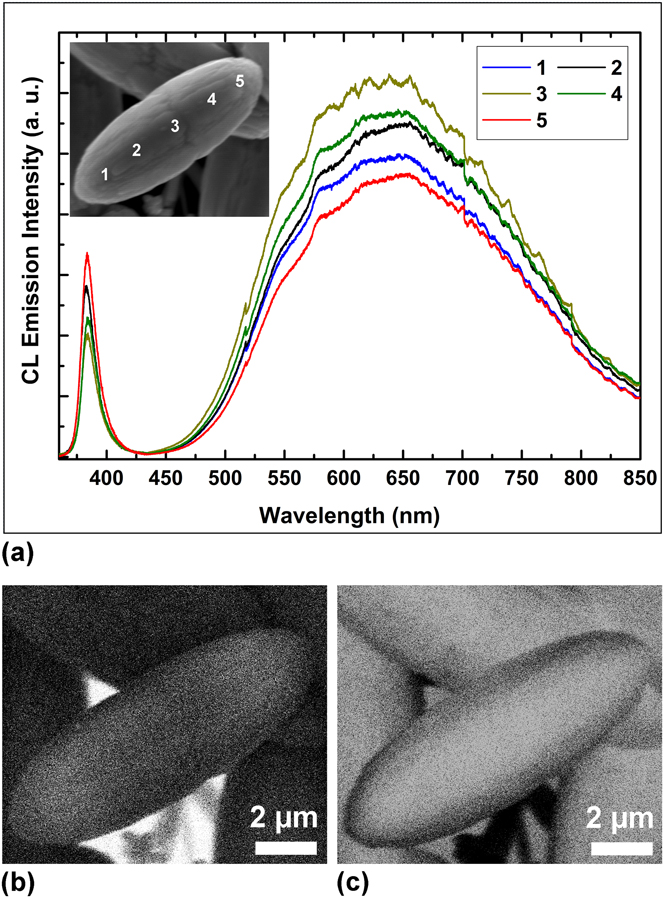
Figure 6 shows the room-temperature CL emission spectra of the intermediate structure of the ZnO ellipsoid which are analyzed at different probing positions along the length of the synthesized structure. The SEM image of the ellipsoid in the inset of Fig. 6(a) indicates the positions of the corresponding emission spectra. The CL emission spectra of the structure emit two emission peaks that are UV and visible emission bands with centers at 383 and 650 nm, respectively. Generally, the origin of the peak emission at 383 nm is attributed to the near band edge emission (NBE) where the emission peak at 650 nm can be assigned to the defects related to the deep-level emission (DLE). Reference Israr, Sadaf, Yang, Nur, Willander, Palisaitis and Persson18,Reference Djurišić, Leung, Tam, Hsu, Ding, Ge, Zhong, Wong, Chan, Tam, Cheah, Kwok and Phillips34–Reference Willander, Israr, Rana and Nur36 It is observed that the emission spectrum from the central joint of the structure emits the defect related emission with higher intensity and it decreases slowly when we move toward the edges of the grown structure. It can be concluded that the central portion contains a higher density of defects compared to the edges of the grown structure. Figures 6(b) and 6(c) show the monochromatic CL images of the same structure at the two fixed wavelengths of 383 and 650 nm to observe the emission distribution of the UV and visible emission across the structure. In Fig. 7(a), a similar procedure was used to understand the luminescence distribution in the final structure of the ZnO ellipsoid, where CL emission spectra were recorded from different spots marked on a single ellipsoid as shown in the inset of Fig. 7(a). The stronger visible luminescence is due to deep level defect states and the weaker one from the near-band edge emission similar to the case of the intermediate stage of the ellipsoid. In Figs. 7(b) and 7(c), it can be clearly seen that the monochromatic UV emission is not uniform across the ellipsoid and it is more prominent near the ellipsoidal boundary of the structure; however, the contribution of the visible emission band is much higher at the central portion when compared to both the edges. This intense visible emission is generally interpreted to the intrinsic and extrinsic defect levels. Reference Panigrahy, Aslam, Misra, Ghosh and Bahadur35–Reference Zhao, Klason, Willander, Zhong, Lu and Yang38 In addition, the intensity ratios between NBE and DLE of all the spectra could be used as a criterion to figure out the crystal quality at different positions of the structure. Reference Sun, Fuge, Fox, Riley and Ashfold39 However, this is also coherent with the former conclusion about the defect ratios being related to the crystal quality of the structure.
(a) Room-temperature CL emission spectra of intermediate stage of ZnO ellipsoid taken from different positions along the length of the structure. The probing positions are mentioned on the SEM image shown in inset. CL images of single ZnO intermediate ellipsoid structure recorded at monochromatic wavelengths of (b) 383 nm and (c) 650 nm.

(a) Room-temperature CL emission spectra of final structure of ZnO ellipsoid by probing at different positions mentioned in inset. CL images show the emission contribution for monochromatic wavelengths of (b) 383 nm and (c) 650 nm.

IV. CONCLUSION
In this paper, a well-controlled procedure has been developed for the synthesis of ZnO ellipsoids using a low-temperature (80 °C) growth technique. The absence of the growth modifiers, as well as the reaction time, is found to be the vital factors that control the growth process. The presented method provides an optimized control of the different stages of the ZnO structure having a single crystalline nature. The heterogeneous nucleation and growth of the primary nanorods in opposite directions occur from the central joint and the sequential secondary nucleation at this defect-rich central joint plays a crucial role in the formation of the branched nanorod structure, which finally results in the ZnO ellipsoid through Ostwald ripening. TEM and room temperature CL analysis depicted good consistency with our discussion about the higher density of the defect states at the central joint and the improvement in the crystalline quality of the material as the reaction time was prolonged. The synthesis of single crystalline ZnO ellipsoids along [0002] by using this facile method may provide an important application for self-polarization properties due to the dipole nature and high ionicity of ZnO materials.
ACKNOWLEDGMENTS
We are humbly grateful to Prof. Le Si Dang from the Institut Néel-CNRS, Grenoble, France, for his help regarding cathodoluminescence measurements. The authors also acknowledge the financial support from the Higher Education Commission (HEC), Pakistan.