I. INTRODUCTION
The crystallization of polymers in thin films can be strongly influenced by geometrical confinement and interfacial interactions, Reference Liu and Chen1–Reference Löhmann, Henze and Thurn-Albrecht6 resulting in changes in orientation, crystallinity, and crystallization kinetics. These effects are especially important for functional polymers like semiconductor polymers which in devices are typically used as thin films. Usually, it is assumed that the interface to the substrate plays the dominant role for the above-mentioned effects, for example, by acting as a nucleation site Reference Sear7 or by affecting the molecular dynamics in the vicinity of the interface. Reference Ma, Hu and Reiter5,Reference Napolitano and Wübbenhorst8–Reference Martinez-Tong, Vanroy, Wübbenhorst, Nogales and Napolitano11 On the other hand, detailed investigations of materials containing alkyl chains showed surface induced ordered or crystalline structures. Examples are simple n-alkanes, Reference Wu, Ocko, Sirota, Sinha, Deutsch, Cao and Kim12–Reference Gautam, Kumar, Wermeille, Robinson and Dhinojwala15 long-chain alcohols, Reference Gang, Wu, Ocko, Sirota and Deutsch16 poly(n-alkyl acrylates), Reference Prasad, Jiang, Sinha and Dhinojwala17 and ionic liquids. Reference Jeon, Vaknin, Bu, Sung, Ouchi, Sung and Kim18 In all these examples, the alkyl chains orient perpendicular to the surface with partial or complete in-plane ordering leading to surface freezing. In many cases, though, not much is known about the effect of interfacial ordering on the crystal texture of thicker films.
Within the class of conjugated polymers regioregular poly(3-hexylthiophene) (P3HT) is among the most extensively studied materials due to its interesting optoelectronic properties. Thus, in early studies P3HT was often used as a model material, Reference Sirringhaus, Brown, Friend, Nielsen, Bechgaard, Langeveld-Voss, Spiering, Janssen, Meijer, Herwig and de Leeuw19–Reference Bao, Dodabalapur and Lovinger24 although at present there exist a large number of alternative materials with improved properties. Reference Müller-Buschbaum25 P3HT is a semicrystalline polymer with substituted alkyl side chains. The semicrystalline morphology of P3HT consists of the usual stacks of crystalline lamellae or whiskers separated by amorphous interlayers. Reference Hugger, Thomann, Heinzel and Thurn-Albrecht26–Reference Brinkmann and Rannou28 While early reports suggested an orthorhombic unit cell, Reference Prosa, Winokur, Moulton, Smith and Heeger29–Reference Joshi, Grigorian, Pietsch, Pingel, Zen, Neher and Scherf31 more recent studies proposed a monoclinic structure. Reference Wu, Petzold, Henze, Thurn-Albrecht, Lohwasser, Sommer and Thelakkat27,Reference Brinkmann and Rannou28 The performance of electronic and optoelectronic devices made from P3HT depends strongly on molecular parameters such as molecular weight (MW), Reference Kline, Mcgehee, Kadnikova, Liu and Frechet32–Reference Ballantyne, Chen, Dane, Hammant, Braun, Heeney, Duffy, McCulloch, Bradley and Nelson34 regioregularity (RR), Reference Sirringhaus, Brown, Friend, Nielsen, Bechgaard, Langeveld-Voss, Spiering, Janssen, Meijer, Herwig and de Leeuw19,Reference Kim, Cook, Tuladhar, Choulis, Nelson, Durrant, Bradley, Giles, McCulloch, Ha and Ree35 as well as specific processing conditions such as the choice of solvents and annealing procedures. Reference Bao, Dodabalapur and Lovinger24 These factors also influence the microstructure and semicrystalline morphology of the material. Reference Brinkmann36,Reference Schulz and Ludwigs37 However, knowledge about the relations between molecular characteristics and processing, the resulting structure formation, and electronic transport properties in thin P3HT films is still quite limited due to the difficulty to characterize the influence of all relevant parameters. Reference Virkar, Mannsfeld, Bao and Stingelin38 Nevertheless it seems quite certain that there is a strong correlation between hole mobility and crystallinity. Reference Boudouris, Ho, Jimison, Toney, Salleo and Segalman39–Reference Singh, Gupta, Lohwasser, Engmann, Balko, Thelakkat, Thurn-Albrecht and Hoppe41
Technically it is not trivial to distinguish the substrate from the air interface in a thin film experiment, although depth sensitive X-ray scattering techniques are available and have been used to separately study order close to the surface of a thin film. These techniques were used for example for polyimides, Reference Factor, Russell and Toney42 polypropylene, Reference Kawamoto, Mori, Nitta, Sasaki, Yui and Terano43 poly(ethylene terephthalate), Reference Jukes, Das, Durell, Trolley, Higgins, Geoghegan, Macdonald, Jones, Brown and Thompson44 and polyethylene. Reference Yakabe, Tanaka, Nagamura, Sasaki, Sakata, Takahara and Kajiyama45 Differences in chain packing, Reference Factor, Russell and Toney42,Reference Kawamoto, Mori, Nitta, Sasaki, Yui and Terano43,Reference Yakabe, Tanaka, Nagamura, Sasaki, Sakata, Takahara and Kajiyama45 crystallinity, Reference Kawamoto, Mori, Nitta, Sasaki, Yui and Terano43,Reference Jukes, Das, Durell, Trolley, Higgins, Geoghegan, Macdonald, Jones, Brown and Thompson44 and crystallization kinetics Reference Jukes, Das, Durell, Trolley, Higgins, Geoghegan, Macdonald, Jones, Brown and Thompson44 were observed. Grazing incidence wide angle X-ray scattering (GIWAXS) Reference Sirringhaus, Brown, Friend, Nielsen, Bechgaard, Langeveld-Voss, Spiering, Janssen, Meijer, Herwig and de Leeuw19,Reference Müller-Buschbaum25,Reference Kline, Mcgehee and Toney46–Reference Jimison, Himmelberger, Duong, Rivnay, Toney and Salleo48 has also been used to characterize the crystalline structure and the morphology of thin P3HT films. It is sometimes assumed that strongly oriented edge-on crystallites are induced by the favorable interaction of the side chains with the substrate, Reference Kline, Mcgehee and Toney46,Reference Jimison, Himmelberger, Duong, Rivnay, Toney and Salleo48,Reference Skrypnychuk, Boulanger, Yu, Hilke, Mannsfeld, Toney and Barbero49 although others suggest an orientation effect at the film surface. Reference Schmidt-Hansberg, Sanyal, Klein, Pfaff, Schnabel, Jaiser, Vorobiev, Müller, Colsmann, Scharfer, Gerthsen, Lemmer, Barrena and Schabel50 For the first case, self-assembled monolayers (SAMs) have been used as an underlying film layer to enhance the orientation of the polymer crystals. Reference Kline, Mcgehee and Toney46,Reference Jimison, Himmelberger, Duong, Rivnay, Toney and Salleo48,Reference Kim, Jang, Park and Cho51–Reference Anglin, Lane and Massari54 In addition, there are indications that the morphology of thin films varies with thickness. Reference Huang, Glynos, Frieberg, Yang and Green55 But since common GIWAXS experiments probe the complete film thickness, it is still difficult to unambiguously assign the origin of the oriented crystals. In contrast to the assumption of a substrate induced orientation, Choi et al. observed a higher density and a better ordering of crystalline lamellae at the film surface compared to the bottom by atomic force microscopy (AFM). Reference Choi, Jin, Lee, Kim, Chung, Hong, Yang, Jung, Kim, Ree and Park52 Also face-on orientations at the SAM interface have been suggested based on transmission electron microscopy (TEM) and grazing incidence diffraction (GID). Reference Kim, Jang, Park and Cho51 At the surface of melt-crystallized samples usually ordered stacks of crystalline lamellae are found even for films on amorphous substrates. Reference Hugger, Thomann, Heinzel and Thurn-Albrecht26,Reference Wu, Petzold, Henze, Thurn-Albrecht, Lohwasser, Sommer and Thelakkat27,Reference Zen, Saphiannikova, Neher, Grenzer, Grigorian, Pietsch, Asawapirom, Janietz, Scherf, Lieberwirth and Wegner33,Reference Singh, Gupta, Lohwasser, Engmann, Balko, Thelakkat, Thurn-Albrecht and Hoppe41,Reference Choi, Jin, Lee, Kim, Chung, Hong, Yang, Jung, Kim, Ree and Park52 Also simulations suggest a preferred orientation at the interface to the vacuum. Reference Yimer, Dhinojwala and Tsige56 And from spectroscopy Anglin et al. concluded that the order of the main chains in contact with the SiO2/Si substrate drastically reduces upon annealing below the melting temperature or melt-crystallization. Reference Anglin, Speros and Massari53 Nevertheless a comprehensive structural model of thin P3HT films as a function of film thickness is lacking.
We here present an investigation of the vertical structure of a series of films of P3HT with different thicknesses which were crystallized from the melt state on two different substrates, namely, silicon nitride (SiN) and silicon (SiO2/Si). Using GIWAXS with variable incidence angle and AFM, we find for all thicknesses a highly oriented crystalline layer at the surface of the films with a thickness of about 50 nm, below which the arrangement of the crystals is more or less isotropic. Although in most devices films are prepared from solution, samples crystallized by cooling from the melt are of general interest as their structure is not much affected by kinetic effects and can therefore often more clearly reveal the underlying fundamental driving forces. Our results complement a recent study in which we determined the crystallinity of thin P3HT films with fast scanning calorimetry. Reference Balko, Rinscheid, Wurm, Schick, Lohwasser, Thelakkat and Thurn-Albrecht57
II. EXPERIMENTAL SECTION
A. GIWAXS
GIWAXS measurements were used to probe the height dependent structure and the orientation of the P3HT crystallites in the thin film samples. By varying the incident angle αi around the critical angle of the polymer, the penetration depth Λ(αi) of the primary beam into the polymeric film can be tuned in a range from about Λ = 10–30 nm to Λ > 1000 nm. In the first case, the measurement is exclusively surface-sensitive and in the second case the complete film is probed.
Reference Prasad, Jiang, Sinha and Dhinojwala17,Reference Factor, Russell and Toney42,Reference Breiby, Bunk, Andreasen, Lemke and Nielsen58
GIWAXS experiments were performed at the Dutch-Belgian Beamline (DUBBLE CRG), station BM26B at the European Synchrotron Radiation Facility (ESRF) in Grenoble, France. A cryogenically cooled Si-111 double-crystal monochromator and a focusing toroidal mirror provided a beam with a wavelength of λ = 1.04 Å (12.4 keV) and a beam size of 400 μm × 800 µm in the vertical and the horizontal directions, respectively. The maximum photon flux was approximately 1011 photons/s/100 mA at the position of the sample. Beam monitors were used to measure the photon flux along the beamline. An area detector (FReLon charge coupled device [CCD] camera, ESRF) was placed at a sample to detector distance of L
SD = 0.1632 m. It has an input field of about 100 mm × 100 mm (2048 × 2048 pixel) with a spatial resolution of 46.8 µm spanning a q-range of 1 ≤ q ≤ 18 nm−1. The Bragg reflections of an aluminum/silver behenate blend were used to calibrate L
SD. Thin film samples with a length of about 10 mm in the direction of the primary beam were placed on a Huber sample stage such that the primary beam hits the sample at an angle of incidence
 ${\alpha _{\rm{i}}} \lt \alpha _{\rm{c}}^{{\rm{sub}}}$
, where
 $\alpha _{\rm{c}}^{{\rm{sub}}}$
is the critical angle of the substrate. Surface-sensitive measurements were performed under the condition
 ${\alpha _{\rm{i}}} \lt \alpha _{\rm{c}}^{{\rm{pol}}}$
, where
 $\alpha _{\rm{c}}^{{\rm{pol}}} = 0.11^\circ \lt \alpha _{\rm{c}}^{{\rm{sub}}}$
is the critical angle for the polymer film for λ = 1.04 Å. The critical angle
 $\alpha _{\rm{c}}^{{\rm{pol}}}$
was experimentally determined with X-ray reflectivity (XRR) as described below. Using Eq. (3) it was converted for λ = 1.04 Å.
All measurements were performed under ambient conditions with an exposure time of 60 s. To improve the signal-to-noise ratio partially multiple exposures were taken. To prevent degradation by beam damage, the samples were laterally shifted providing a fresh surface after several exposures. Visually we could not observe any sign of degradation such as discoloration. The detected intensity corrected for was dark current and detector efficiency and normalized with respect to incident photon flux and acquisition time.
For hard X-rays the complex index of refraction can be approximated as
 $n\left( {\vec r} \right) = 1 - \delta \left( {\vec r} \right) + {\rm{i}}\beta \left( {\vec r} \right)$
, where
 $\left[ {1 - \delta \left( {\vec r} \right)} \right]$
is the real part (δ > 0, δ ≈ 10−6) and
 $\beta \left( {\vec r} \right)$
the imaginary part, respectively. For a homogenous medium and wavelengths λ distinct from absorption edges the following relations hold
 $$\delta \approx {{{\lambda ^2}} \over {2\pi }}{r_{\rm{e}}}{\rho _{\rm{e}}}\quad ,$$
 $$\beta \approx {\lambda \over {4\pi }}\mu \quad .$$
Here r e, ρe, and μ are the classical electron radius, the electron density, and the linear absorption coefficient, respectively. Applying Snell’s law yields the critical angle of total external reflection
 $${\alpha _{\rm{c}}} \approx \sqrt {2\delta } = \lambda \sqrt {{{{r_{\rm{e}}}{\rho _{\rm{e}}}} \over \pi }} \quad .$$
For all incident angles αi < αc the incident beam is completely reflected by the surface and only an evanescent wave field illuminates the film. Generally, the depth of the surface layer from which the signal is scattered is determined by the scattering depth calculated by Dosch et al. Reference Dosch, Batterman and Wack59 For exit angles γ ≫ αi [Fig. 1(b)] the scattering depth is well approximated by the penetration depth Reference Tolan60
 $$\Lambda \left( {{\alpha _{\rm{i}}}} \right) = {\lambda \over {\sqrt 2 \pi }}{\left( {\sqrt {{{\left( {\alpha _{\rm{i}}^2 - \alpha _{\rm{c}}^2} \right)}^2} + 4{\beta ^2}} - {{\left( {\alpha _{\rm{i}}^2 - \alpha _{\rm{c}}^2} \right)}^2}} \right)^{ - {1 \mathord{\left/ {\vphantom {1 2}} \right. \kern-\nulldelimiterspace} 2}}}\quad ,$$
which is depicted in Fig. 1(a) for a P3HT film (λ = 1.04 Å,
 $\alpha _{\rm{c}}^{{\rm{pol}}} = 0.11^\circ$
, β = 6 × 10⁻⁹). Thus the structural information is obtained from a surface layer with thickness Λ (αi).
(a) Penetration depth of the incident beam as a function of the incident angle (β = 6 × 10⁻⁹, δ = 2 × 10⁻⁶). The critical angle of the P3HT film is
 $\alpha _{\rm{c}}^{{\rm{pol}}}$
= 0.11° (λ = 1.04 Å). (b) Setup of the GIWAXS experiments at the DUBBLE beamline.

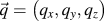
The scattering geometry and an exemplary scattering pattern are shown in Fig. 1(b). Taking into account refraction effects, the components of the scattering vector
 $\vec q = \left( {{q_x},{q_y},{q_z}} \right)$
can be obtained from the angles δ and γ,
 $$\left( {\matrix{ {{q_x}} \cr {{q_y}} \cr {{q_z}} \cr} } \right) = {{2\pi } \mathord{\left/ {\vphantom {{2\pi } \lambda }} \right. \kern-\nulldelimiterspace} \lambda }\left( {\matrix{ {\cos \delta \cos \left( {\gamma - {\alpha _{\rm{i}}}} \right) - \cos {\alpha _{\rm{i}}}} \cr {\sin \delta \cos \left( {\gamma - {\alpha _{\rm{i}}}} \right)} \cr {{{\left( {{{\sin }^2}{\alpha _{\rm{i}}} - {{\sin }^2}{\alpha _{\rm{c}}}} \right)}^{{1 \mathord{\left/ {\vphantom {1 2}} \right. \kern-\nulldelimiterspace} 2}}} + {{\left( {{{\sin }^2}(\gamma - {\alpha _{\rm{i}}}) - {{\sin }^2}{\alpha _{\rm{c}}}} \right)}^{{1 \mathord{\left/ {\vphantom {1 2}} \right. \kern-\nulldelimiterspace} 2}}}} \cr} } \right)\quad.$$
A resulting exemplary two-dimensional reciprocal space map is shown in Fig. 3: GIWAXS patterns of melt-crystallized films of (a) SEP200 film (D = 655 nm, αi = 0.17°) and (b) P3HT-3 (D = 487 nm, αi = 0.13°) on SiN (Fig. 3). For an orientational analysis we directly transformed the 2D diffraction patterns as shown in Fig. 1(a) into one-dimensional pole figures of the (100) Bragg reflection using the software FIT2D (ESRF). 61 To this end, the pixel coordinates (X, Y) of the detector were converted into polar coordinates (q, χ), where q is the magnitude of the scattering vector and χ the azimuthal angle. By integrating the intensity over the q-range of the (100) reflection, we obtained pole figures,
 $${I_{100}}\left( \chi \right) = {1 \over {2\Delta q}}\int_{{q_{{\rm{max}}}} - \Delta q}^{{q_{{\rm{max}}}} + \Delta q} {I\left( {q,\chi } \right)\,{\rm{d}}q} \quad .$$
In this procedure, refraction effects are neglected and a small range of the reciprocal space around the q z -axis is excluded. The validity and advantages of this approximation will be discussed in conjunction with the analysis of the data shown in Fig. 4. To correct for air and substrate scattering, we performed empty substrate measurements for several αi. The corresponding pole figures I bg(χ) were scaled according to the background intensity from selected samples with negligible scattering intensity in the wings of the pole figure and then subtracted from I 100(χ).
B. XRR
XRR measurements performed with a laboratory diffractometer EMPYREAN (PANalytical, Almelo, The Netherlands) served to determine the critical angle
 $\alpha _{\rm{c}}^{{\rm{pol}}}$
and the thickness D of the P3HT thin films. In the incident beam path, a multilayer mirror provided a parallel and monochromatic beam with λ = 1.541 Å (Cu Kα). A 1/32° slit in front of the mirror and the 10 mm mask after the mirror collimated the incident beam in the scattering plane and the lateral direction, respectively. In the diffracted beam path, we used a parallel plate collimator with an acceptance angle of 0.27°, a collimator slit of 0.1 mm in height, and Soller slits to control the axial divergence. A PIXcel3D detector (Medipix2, CERN, Meyrin, Switzerland) was used as a point detector with an opening of 1.045 mm in the scattering plane. A programmable beam attenuator prevented beam damage of the detector at small incident angles θ. We performed scans in the symmetric θ–2θ geometry for 0.04° ≤ θ ≤ 3.5° with a step size of Δθ = 0.01° and a counting time of 8.8 s per step.
The critical angle
 $\alpha _{\rm{c}}^{{\rm{pol}}}$
was estimated from the position q
c at the intensity edge of the range of total external reflection. The film thickness was calculated as D = 2π/Δq
z
, where Δq
z
is the separation of two adjacent maxima of the Kiessig fringes. In the high q-range of the XRR curve, the P3HT (100) Bragg reflection shows up. The width of this reflection was analyzed to estimate the crystalline thickness L
100 according to the Scherrer equation
Reference Scherrer62
 $$\beta _{\rm{S}}^{100}\left( {2\theta } \right) = {{K\lambda } \over {{L^{100}}\cos {\theta ^{100}}}}\quad,$$
where
 $\beta _{\rm{S}}^{100}\left( {2\theta } \right)$
is the width (full width at half maximum [FWHM]) of the (100) Bragg reflection due to the finite crystal size. The measured FWHM
 ${\beta ^{100}} = {\beta _i} + \beta _S^{100}$
includes an additional instrumental broadening βi = 0.8 mrad which was approximated by the width of the primary beam. The constant K depends in detail on the definition of the width, the shape of the crystals, and the distribution of the crystalline widths.
Reference Langford and Wilson63
Since we have no information about the crystalline width distribution, we approximate K to 0.9.
Reference Holzwarth and Gibson64
C. AFM
An atomic force microscope NanoWizard I from JPK Instruments (Berlin, Germany) was used to characterize the surface morphology. Intermittent contact (tapping) mode measurements in the net repulsive regime were performed with cantilevers OMCL-AC240TS-R3 from Olympus (k = 2 N/m and ω0 = 70 kHz) with an excitation frequency ω < ω0.
D. Materials
Commercially available Sepiolid P200 (SEP200) sample was purchased from BASF (Ludwigshafen, Germany). The sample P3HT-3 was synthesized using the Grignard metathesis (GRIM) polymerization developed by McCullough and co-workers.
Reference Sheina, Liu, Iovu, Laird and McCullough65
The basic characteristics such as molecular weight, polydispersity (PDI), RR, and the number of repeating units are given in Table I. The molecular weights and the polydispersities were determined by size exclusion chromatography (SEC) as described elsewhere.
Reference Balko, Lohwasser, Sommer, Thelakkat and Thurn-Albrecht66
The peak maximum of the molecular weight distribution
 $M_{\rm{p}}^{{\rm{SEC}}}$
measured by SEC is about twice the number-average molecular weight
 $M_{\rm{n}}^{{\rm{MALDI}}}$
as determined by matrix-assisted laser desorption/ionization mass spectroscopy measurements with time of flight detection (MALDI-TOF MS) which gives an absolute value. The number-average molecular weight of the latter method was used to calculate the number of repeating units and the contour length using half of the unit cell parameter along the backbone c/2 = 0.385 nm.
Reference Balko, Lohwasser, Sommer, Thelakkat and Thurn-Albrecht66
The RR was determined by 1H nuclear magnetic resonance (NMR).
Molecular characteristics of the samples in this study.

∗ The molecular weight
 $M_{\rm{n}}^{{\rm{MALDI}}}$
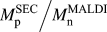
≈ 20 kg/mol was not directly measured but was estimated using the ratio
 ${{M_{\rm{p}}^{{\rm{SEC}}} } \mathord{\left/ {\vphantom {{M_{\rm{p}}^{{\rm{SEC}}} } {M_{\rm{n}}^{{\rm{MALDI}}} }}} \right. \kern-\nulldelimiterspace} {M_{\rm{n}}^{{\rm{MALDI}}} }}$
≈ 1.9 which was determined elsewhere.
Reference Balko, Lohwasser, Sommer, Thelakkat and Thurn-Albrecht66
Silicon and SiN were used as substrates, since the latter is the material of the chip sensor in the complementary calorimetric study.
Reference Balko, Rinscheid, Wurm, Schick, Lohwasser, Thelakkat and Thurn-Albrecht57
Substrates were purchased from Si-Mat (Kaufering/Germany). The SiN substrates consist of a p-doped silicon wafer with a thickness of 275 µm and a diameter of 2″ which is covered with the 500 nm thick SiN layer. The SiN layer was deposited using low pressure chemical vapor deposition at T = 820 °C resulting in a low-stress amorphous top layer. We checked the amorphous nature of the SiN layer with AFM and X-ray diffraction (XRD) which showed neither crystallites nor Bragg reflections.
Reference French, Sarro, Mallee, Fakkeldij and Wolffenbuttel67
The critical angle of amorphous SiN
 $\alpha _{\rm{c}}^{{\rm{SiN}}}$
= 0.14° (λ = 1.541 Å) was obtained with XRR from
 $q_{\rm{c}}^{{\rm{SiN}}}$
= 0.033 Å−1. This value is in good agreement with the density of amorphous SiN, ρSiN = 2.6 g cm−3, given in Ref. Reference Aiyama, Fukunaga, Niihara, Hirai and Suzuki68. P-doped silicon wafers with a native oxide layer (SiO2/Si) served as reference substrates (
 $q_{\rm{c}}^{{{{\rm{Si}}{{\rm{O}}_2}} \mathord{\left/ {\vphantom {{{\rm{Si}}{{\rm{O}}_2}} {{\rm{Si}}}}} \right. \kern-\nulldelimiterspace} {{\rm{Si}}}}}$
= 0.030 Å−1).
E. Sample preparation
Before use, the substrates were cleaned with concentrated sulfuric acid for 5 min. After rinsing them with distilled water, they were further cleaned and dried with a CO2 snow jet cleaning gun. The P3HT materials were dissolved in chloroform (Roth, Karlsruhe, Germany; purity ≥99%) at slightly elevated temperatures to improve the solubility. After cooling down the solution to room temperature, it was spin coated for 60 s either on SiN or SiO2/Si. By changing the weight concentration in the range of 0.0675 wt% to 2 wt% and the speed of rotation (2000 or 300 rpm), we varied the film thickness in the range of 7 ≤ D ≤ 655 nm. The film thickness was determined using XRR for D ≲ 50 nm and using AFM for thicker films. After spincoating the films were placed in a nitrogen atmosphere and heated to a temperature at least 20 K above their melting point as obtained from the melting peak position in differential scanning calorimetry. The oven temperatures were T = 280 °C for SEP200 and T = 200 °C for P3HT-3, respectively. By switching off the oven, the films crystallized during cooling from the melt to room temperature at an estimated rate of <3 K/min. For the synchrotron measurements, the substrates were cut. The substrate size in the direction of the primary beam was 10 mm. The critical angle of melt-crystallized P3HT is
 $\alpha _{\rm{c}}^{{\rm{pol}}}$
= 0.11° (λ = 1.04 Å,
 $q_{\rm{c}}^{{\rm{pol}}}$
= 0.02 Å−1) as calculated from the XRR value and Eq. (3). The reflectivity data are shown for qualitative inspection in Fig. S1.
To probe the thin film bottom side with AFM, a stack of SiN/P3HT/SiN was prepared (D ≈ 650 nm), melt-crystallized as described above, and cleaved from each other after immersing it into liquid nitrogen.
III. RESULTS AND DISCUSSION
A. AFM: Semicrystalline morphology at the surface
Generally, upon crystallization from the melt or from solution P3HT forms long lamellar or whisker-like crystals separated by amorphous regions. Reference Wu, Petzold, Henze, Thurn-Albrecht, Lohwasser, Sommer and Thelakkat27,Reference Singh, Gupta, Lohwasser, Engmann, Balko, Thelakkat, Thurn-Albrecht and Hoppe41,Reference Crossland, Rahimi, Reiter, Steiner and Ludwigs69 AFM can be used to image the semicrystalline morphology of P3HT films at the surface. Figures 2(a)–2(d) show a series of such measurements, here AFM phase images of melt-crystallized SEP200 films on SiN with a number of different thicknesses in the range from 8 nm up to about 650 nm. All films show the mentioned morphology, but for the thinnest film it is the least well ordered indicating the influence of the underlying substrate [see also the discussion of Figs. 2(e) and 2(f)]. As shown below, the crystalline lamellae generally have an edge-on orientation, i.e., the a-axis of the crystalline lattice is perpendicular to the film plane and the long axis of the lamellae corresponds to the π–π stacking direction. Reference Wu, Petzold, Henze, Thurn-Albrecht, Lohwasser, Sommer and Thelakkat27,Reference Singh, Gupta, Lohwasser, Engmann, Balko, Thelakkat, Thurn-Albrecht and Hoppe41 Films on SiN with D = 100 nm and D = 250 nm (here not shown) and films on the SiO2/Si substrates have the same morphology (see Fig. S2).
AFM phase images of the surface of melt-crystallized SEP200 films on SiN with a film thickness of (a) 8 nm, (b) 14 nm, (c) 27 nm, and (d) 642 nm. AFM phase (e) and height (f) images of a melt-crystallized SEP200 film (D ≈ 650 nm) from the bottom side which was in contact with the substrate SiN. The arrows indicate regions in which the semicrystalline morphology is completely absent (image size: 1 × 1 µm).

For a qualitative comparison, we also tried to image the interface of the film bottom at the SiN substrate after separation from the substrate as described above. The AFM images look quite different as shown in Figs. 2(e) and 2(f). The interfacial regions with the highest elevation (bright areas in height image) which were in direct contact with SiN during melt crystallization lack the well developed semicrystalline morphology suggesting a suppression of crystallization at the interface, e.g., due to a thin layer of adsorbed and immobilized chains. Reference Ma, Hu and Reiter5,Reference Napolitano and Wübbenhorst8,Reference Vanroy, Wübbenhorst and Napolitano10 An interfacial layer with reduced density and a thickness of a few nanometers was also observed by Choi et al. based on a quantitative analysis of XRR data. Reference Choi, Jin, Lee, Kim, Chung, Hong, Yang, Jung, Kim, Ree and Park52 Both observations, namely, the thickness independent surface morphology as well as the lack of a well developed semicrystalline morphology at the substrate, suggest that the orientated crystallization is caused by the interaction with the free surface in contrast to the assumption that it is caused by the substrate. Reference Kline, Mcgehee and Toney46–Reference Jimison, Himmelberger, Duong, Rivnay, Toney and Salleo48
B. X-ray scattering: Crystal structure and crystal orientation
While AFM only probes the topmost surface of a thin film sample, GIWAXS measurements provide structural information about either the complete film thickness or only near-surface regions. In the following, we therefore use GIWAXS with variable incidence angle to analyze the interior structure of the P3HT films. Figure 3(a) shows an exemplary reciprocal space map for SEP200 with the reflections indexed according to the known unit cell of P3HT. The characteristic (100) reflection at q 100 = 3.8 nm−1 and the (020/002) reflection at q 020 = 16.2 nm−1 correspond to the main chain/side chain layering and the π–π stacking direction, respectively. The sample P3HT-3 with lower molecular weight which is known to show higher order and more Bragg reflections was measured for comparison [Fig. 3(b)]. Based on GIWAXS measurements, Bragg reflections with mixed indices have been reported for P3HT thin films but a complete assignment was not yet performed. Reference Kohn, Rong, Scherer, Sepe, Sommer, Müller-Buschbaum, Friend, Steiner and Hüttner70,Reference Koch, Rivnay, Foster, Müller, Downing, Buchaca-Domingo, Westacott, Yu, Yuan, Baklar, Fei, Luscombe, McLachlan, Heeney, Rumbles, Silva, Salleo, Nelson, Smith and Stingelin71 We conducted an analysis of the observed reflections (see Supplementary Materials Fig. S3, Table S1) based on complementary high resolution measurements performed on the same sample P3HT-3 on beamline ID10B at the ESRF using an area detector PILATUS 300k (Dectris). Assuming a monoclinic unit cell with lattice parameters a = 1.582 nm, b = c = 0.77 nm, and γ = 95.5°, all reflections of P3HT-3 could be indexed. Electron diffraction experiments by Kayunkid and Brinkmann Reference Kayunkid, Uttiya and Brinkmann72 are consistent with our results with a slight deviation in γ which might be attributed to different preparation conditions. With the originally proposed orthorhombic unit cell, Reference Prosa, Winokur, Moulton, Smith and Heeger29,Reference Tashiro, Kobayashi, Kawai and Yoshino30 a comparable agreement could not be reached. Reference Joshi, Grigorian, Pietsch, Pingel, Zen, Neher and Scherf31 The differences between low and high molecular weight scattering patterns are in agreement with bulk measurements and have been discussed before. They have been attributed to the suppressed order of the side chains for the high molecular weight and are probably due to kinetic reasons. Reference Wu, Petzold, Henze, Thurn-Albrecht, Lohwasser, Sommer and Thelakkat27 Nevertheless, we generally observed less pronounced (hkl) and smeared (hk0) reflections in bulk samples Reference Balko, Lohwasser, Sommer, Thelakkat and Thurn-Albrecht66 ; exemplary data are shown in Fig. S4.
GIWAXS patterns of melt-crystallized films of (a) SEP200 (D = 655 nm, αi = 0.17°) and (b) P3HT-3 (D = 487 nm, αi = 0.13°) on SiN.

To characterize the crystallite orientation distribution, pole figures of the (100)-reflection were extracted directly from the scattering patterns as described above. A series of (100) pole figures for melt-crystallized SEP200 films on SiN and SiO2/Si and with a number of different thicknesses are shown in Fig. 4. Independently of the substrate, thick films with D ≥ 100 nm feature two intensity contributions: A weaker, broad, and nearly isotropic contribution I b(χ) and a much stronger contribution I s(χ) around χ ∼ 0° related to highly oriented crystals with an edge-on orientation. Films with a thickness D < 100 nm only consist of these edge-on crystals. While the thickness dependence of the structure indicates that the crystal orientation is induced by the upper or lower surface and of limited range, the AFM measurements shown above suggest that the oriented crystalline layer is at the free film surface. To further prove this finding, we used surface-sensitive GIWAXS measurements.
(100) pole figures of melt-crystallized SEP200 films on (a) SiN and (b) SiO2/Si for film thicknesses ranging from 8 ≤ D ≤ 665 nm (αi = 0.17°). The background intensity due to scattering from the air and the substrate was subtracted beforehand. The region below the dotted lines is shown enlarged in the insets.

At this point, a remark concerning the quantitative analysis of pole figures as shown in Fig. 4 seems appropriate. As mentioned above, pole figures measured under grazing incidence conditions are approximate, as only crystals are probed with orientation angles χ in the range from −90° to −θ100 and from θ100 to 90° with θ100 = 1.8°. Reference Baker, Jimison, Mannsfeld, Volkman, Yin, Subramanian, Salleo, Alivisatos and Toney47,Reference Jimison, Himmelberger, Duong, Rivnay, Toney and Salleo48 As pointed out by Baker et al., to obtain the complete angular range an additional measurement under a local-specular condition, here for αi = θ100, is necessary. In fact, the difference is in most cases small and a comparison of measurements taken under the two incidence angles showed good agreement of the (100) pole figures for the thicker films (Fig. S5). However, for D ≤ 12 nm the (100) intensity at χ = 0° taken under the specular condition is markedly enhanced compared to the grazing incidence condition. We attribute this discrepancy to interference effects with the interfaces of the films for the specular measurement. Consistently, also in a comparison of films with different thicknesses the (100) Bragg peak intensity of the XRR measurements is artificially enhanced for films with D < 30 nm (see Fig. S1). Reference Werzer and Resel73 We therefore believe that the data taken under grazing incidence conditions are generally more representative for the real crystal orientation distribution.
C. Surface induced orientation of the crystals
GIWAXS measurements with varying incident angle were used to probe the crystallite orientation distribution for different penetration depths Λ [Eq. (4)]. For an in-depth analysis, a SEP200 film with D = 108 nm was chosen as it contained highly aligned and isotropically oriented crystallites to a similar amount. Analogous GIWAXS measurements of the SEP200 film on SiO2/Si with D = 125 nm (Fig. S6) gave similar but somewhat less pronounced results. Pole figures for different αi are shown in Fig. 5. For
 ${\alpha _{\rm{i}}} \lt \alpha _{\rm{c}}^{{\rm{pol}}}$
a near-surface region with a thickness of ∼10–30 nm is probed and only the signal I
s(χ) of the oriented crystals is detectable. The remaining intensity detected at higher χ is due to background scattering as it is shown by the fact that it does not depend on αi. For
 ${\alpha _{\rm{i}}} > \alpha _{\rm{c}}^{{\rm{pol}}}$
the complete film is probed and the data show two intensity contributions, I
s(χ) and I
b(χ). This result indicates that the nearly isotropic contribution I
b comes from the interior of the film. It is confirmed by the following more detailed analysis. The inset of Fig. 5 shows the incident angle dependent amplitudes of I
s and I
b (see Supplementary Material for illustration how these were determined, Fig. S7). Both contributions have a maximum at αi = 0.13°, slightly above
 $\alpha _{\rm{c}}^{{\rm{pol}}}$
= 0.11°. A maximum around the critical angle is expected as the electric field amplitude of the incident beam and therefore the scattered intensity have a maximum there.
Reference Factor, Russell and Toney42
The small deviation might be caused by uncertainties in αi due to limited precision in the alignment or roughness of the film. For smaller αi the intensity scattered by the oriented crystals monotonically decreases while crossing
 $\alpha _{\rm{c}}^{{\rm{pol}}}$
. In contrast, I
b(αi) features a sharp step to the background level by about an order of magnitude (red line) at the critical angle.
Selected (100) pole figures of the SEP200 film on SiN (D = 108 nm) for varying incident angles αi below (gray) and above (colored) the critical angle of the polymer film,
 $\alpha _{\rm{c}}^{{\rm{pol}}}$
= 0.11°. Note that the background was not subtracted. Inset: amplitude of the intensity contributions scattered from the crystals in the oriented surface layer I
s at χ = 0° (squares) and scattered from the crystals in the bulk I
b at χ = 40° (circles).

D. Layered morphology
Based on the results presented up to now (AFM and GIWAXS), the morphology of P3HT thin films can be described by a model as shown in Fig. 6. Thicker films consist of a highly oriented surface layer, below which the preferred orientation is lost and the crystals are nearly isotropically oriented. Additionally there is some evidence for a very thin layer with reduced crystallinity at the bottom of the film. For a thickness D smaller than about 60 nm, the oriented layer spans nearly the whole film and the isotropic layer does not exist any more. In the following, we will further elaborate and test this model.
The thickness of the surface layer as determined with the Scherrer analysis for the SEP200 films on SiN (circles) and SiO2/Si (triangles). The dashed line indicates the relation d s = D. The schematic drawing visualizes the model of the vertically layered morphology in the limit of thin (left) and thick films (right).

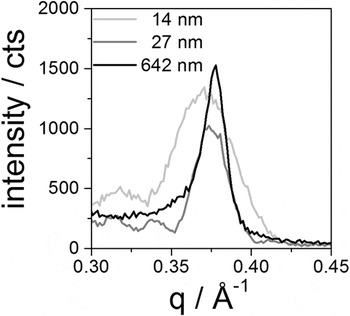
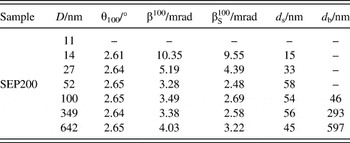
As the scattering signal of the oriented surface layer I s is much stronger than I b around χ ≈ 0°, it is possible to estimate the thickness of the oriented layer by a Scherrer analysis of the (100) Bragg reflection measured in a conventional θ–2θ diffractogram. Eq. (7) allows us to deduce the crystalline thickness L 100 in the vertical film direction; it can be equated with the thickness of the oriented layer d s. As shown for selected data sets in Fig. 7, the width of the (100) Bragg reflection decreases indeed with increasing film thickness D corresponding to an increase of d s. A fit with a Lorentzian was used to extract the peak position and peak width. Hereby the finite resolution of the instrument was taken into account and subtracted as described in Sec. II. The result is shown in Fig. 6. For D ≤ 60 nm the surface layer thickness increases with D, for thicker films d s remains nearly constant. Neglecting a possible very thin bottom layer suggested by the AFM experiments, the thickness of the bulk layer can be estimated with
 $${d_{\rm{b}}} \approx D - {d_{\rm{s}}}\quad .$$
Selected θ–2θ scans of melt-crystallized SEP200 films on SiN in the range of the (100) Bragg reflection.

All values are collected in Table II.
Results of the Scherrer analysis of the (100) Bragg reflection for the SEP200 films on SiN. Film thickness D, Bragg angle θ100, FWHM of the (100) Bragg reflection before β100 and after
 $\beta _{\rm{S}}^{100}$
correction for instrumental resolution, and thickness of the oriented surface layer d
s and the isotropic bulk layer d
b. For the thinnest film (D = 8 nm) no Bragg reflection could be detected.
We further cross-checked the consistency of the values obtained in this way for d s and d b with a quantitative analysis of the intensity of the two contributions to the (100) pole figures shown in Fig. 4. The integrated intensities scattered from the surface layer and from the bulk layer were determined as
 $${J_{\rm{s}}} = \int_{\Delta \chi } {{I_{\rm{s}}}\left( \chi \right)\sin \chi \,{\rm{d}}\chi } \quad ,$$
 $${J_{\rm{b}}} = \int_{ - 90}^{ + 90} {I\left( \chi \right)\sin \chi \,{\rm{d}}\chi - {J_{\rm{s}}}} \quad .$$
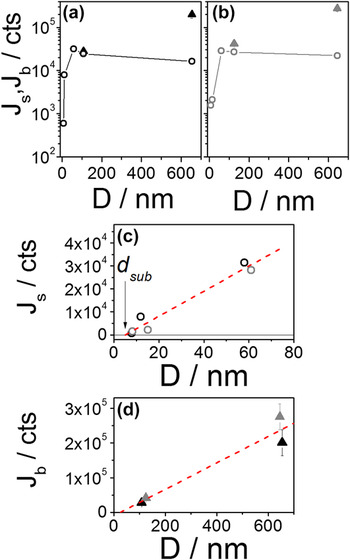
Here Δχ is the range of I s. To separate the two contributions for the thick films, we fitted I b(χ) with a fifth-order polynomial in the range |χ| > 30° and subtracted the extrapolated polynomial from the measured values. The analysis of the resulting integrated intensities is shown in Fig. 8. As expected, J s increases proportionally to the film thickness for D ≤ 60 nm and levels off for larger D (Figs. 8a–c). This result was found for both substrates and is in full agreement with the result of the Scherrer analysis shown in Fig. 6. A linear fit of J s(D) extrapolates to zero intensity already at a finite thickness d sub = 5 nm, consistent with the assumption of a very thin noncrystalline layer at the bottom of the film, as it was suggested by the AFM results (Fig. 8c). For the thick films, the intensity J b scattered from the bulk layer also increases with D [Figs. 8(a) and 8(b)]. Again, as Fig. 8d shows, the result of the extrapolation to intensity zero is consistent with the existence of an oriented surface layer of finite thickness. For the analysis of the intensities above, we neglected the correction for absorption and polarization. This leads to only minor uncertainties for the films with D ≲ 100 nm. Reference Müller-Buschbaum25,Reference Baker, Jimison, Mannsfeld, Volkman, Yin, Subramanian, Salleo, Alivisatos and Toney47 For the thicker films with D ≈ 600 nm, we estimate the underestimation of the intensity to less than 8%. The adjustment of the incident angle, the background subtraction, and the separation of I s(χ) from I b(χ) is more critical. For the values of I b in Figs. 8(a)–8(d), we estimated a relative uncertainty of 13–18%.
(a) and (b) Integrated intensities of the surface contribution J s(χ) (circles) and the bulk contribution J b(χ) (triangles) versus film thickness D of the (100) pole figures for the SEP200 films on SiN (a) and SiO2/Si (b). (c) Enlarged view for D ≤ 80 nm (black—SiN, gray—SiO2/Si) showing J s versus D in linear presentation. The dashed line is a linear fit for the range D ≤ 60 nm. (d) Linear presentation of J b versus D. Again, the dashed line corresponds to a linear fit.

E. Discussion
By combining AFM, GIWAXS, and XRD measurements, we developed a comprehensive model for the vertically layered morphology of P3HT films as it is depicted in Fig. 6. Thin films with D ≤ 60 nm consist of highly oriented crystals with edge-on orientation. Thicker films, on the other hand, exhibit below the oriented surface layer an additional bulk layer with nearly isotropic crystal orientation. Furthermore, we have some evidence for a very thin layer at the substrate with a thickness of a few nanometers only in which crystallization is partially suppressed. Similar results were found for both substrates, but it should be mentioned that they seem limited to materials with higher molecular weights. The low molecular weight material P3HT-3, which was studied for comparison, showed the same edge-on orientation but over the complete film also for higher thicknesses (see in Supplementary Material Figs. S8, S9, and Table S2).
We propose that the observed vertically layered morphology is caused by an effect similar to the effect of surface freezing. Surface induced ordering of alkyl side chains is known for poly(n-alkyl acrylates). Reference Gautam and Dhinojwala14,Reference Gautam, Kumar, Wermeille, Robinson and Dhinojwala15,Reference Prasad, Jiang, Sinha and Dhinojwala17 It is caused by a corresponding decrease in surface energy and has also been proposed to happen for P3HT based on simulations. Reference Yimer, Dhinojwala and Tsige56,Reference Yimer and Tsige74 We believe that in the case of P3HT surface ordering couples to crystallization and that during cooling from the melt the ordered side chains induce oriented crystal growth with the a-axis perpendicular to the surface. Since the π–π stacking direction is the direction in which P3HT crystals grow the fastest, the complete surface is quickly covered with crystallites by growth within the plane of the film. Growth into the vertical direction, i.e., the a-direction of the P3HT crystals, is slower and finally stopped by encountering competing crystals initiated by nucleation in the bulk of the film. P3HT generally shows high nucleation densities in crystal growth. Reference Crossland, Rahimi, Reiter, Steiner and Ludwigs69,Reference Koch, Heeney and Smith75 We assume that similarly, for spin-coated films, the strong crystal orientation is rather an effect induced by the surface than by the substrate. Reference Gurau, Delongchamp, Vogel, Lin, Fischer, Sambasivan and Richter76,Reference Oosterbaan, Bolsee, Gadisa, Vrindts, Bertho, D’Haen, Cleij, Lutsen, McNeill, Thomsen, Manca and Vanderzande77 Of course for an unequivocal proof of crystallization induced by surface freezing, it would be necessary to perform in situ experiments at high temperatures which is beyond the scope of the current paper.
A last remark concerns the question to what extent the GIWAXS measurements shown above could be used for a quantitative determination of the crystallinity in the thin films. In a previous paper, we used fast scanning calorimetry (FSC) to this end and could show that thin film confinement leads to a reduced crystallinity for P3HT. Reference Balko, Rinscheid, Wurm, Schick, Lohwasser, Thelakkat and Thurn-Albrecht57 While the results presented here do not indicate a strong effect of film thickness on crystallinity, the analysis in Fig. 8 also shows that a quantitative comparison of the intensities from films of different thicknesses is connected with rather large experimental errors. A comparison with results from FSC measurements is furthermore difficult due to different thermal histories. The films investigated by X-ray experiments at the synchrotron were stored under ambient conditions for several days before the measurement, i.e., the effective time available for crystallization was much longer than that for the FSC samples. A comparison of crystallinities determined by two different techniques remains therefore difficult and FSC is certainly a much simpler approach to determine crystallinity. The morphology on the other hand can only be obtained by X-ray analysis.
IV. CONCLUSIONS
Using grazing incidence X-ray diffraction with variable incidence angle in combination with AFM and X-ray diffraction on a series of P3HT films with different thicknesses, we could show that the often encountered dominant edge-on orientation of crystalline domains in P3HT thin films is in fact surface induced and limited in depth leading to a complex layered morphology for films with a thickness above around 60 nm. We assume that the observed surface induced orientation is related to surface freezing as it is well known for alkanes and alkyl-substituted amorphous polymers. However, a direct proof of this mechanism would require additional in situ high temperature GIWAXS measurements. Our finding is in contrast to the often found assumption of a dominantly substrate induced ordering. Given the fact that semiconductor polymers are often substituted with alkyl side chains, the phenomenon might well be of relevance for a broader class of materials than only the polymer P3HT. Our work shows that in general to achieve full control over crystal orientation in thin films of semicrystalline polymers interactions with the substrate as well as with the surface might have to be taken into account depending on the specific interaction of the polymers with both interfaces. Given the anisotropic crystal structure and optoelectronic properties, orientation control is relevant for potential applications.
Supplementary Material
To view supplementary material for this article, please visit https://doi.org/10.1557/jmr.2017.107
ACKNOWLEDGMENTS
This work was supported by the German Research Foundation (DFG) within the framework of the priority program SPP 1355 and the collaborative research center SFB/TRR 102. J.B. acknowledges financial support by the German Economy Foundation (sdw). Experiments were performed on beamlines DUBBLE/BM26B and ID 10B at the ESRF, Grenoble, France. We are grateful to Oleg Konovalev at the ESRF for providing assistance in using beamline ID10B.