

1. Introduction
Technical assistance (TA) is, for the EU, an important component of Aid for Trade (AfT), responding to the need to help the private sector in Southern partners, in particular low-income ones, cope with increasingly stringent SPS and product standards. Among the many forms of assistance counted as AfT (see WTO/OECD, 2011), TA may also be, together with export promotion, one of the most genuinely trade-focused ones.Yet, we don't know much about its impact and effectiveness.
In general, rigorous studies on the effectiveness of AfT are few. As for its allocation, Gamberoni and Newfarmer (Reference Gamberoni and Richard2009) found that, after controlling for absorption capacity, it correlated with an indicator of `demand’ based on indices of under-trading. As for its impact, the early literature looked for effects on donor trade, a natural choice since a good chunk of aid was tied. Wagner (Reference Wagner2003) found donor exports to the recipient country were indeed boosted by aid. By contrast, using a gravity equation in first differences on four European donors and 26 African recipients, Osei et al. (Reference Osei, Oliver and Tim2004) found an unstable and, on the whole, insignificant impact of aid on trade flows from donor to recipient. Nelson and Silva (Reference Nelson and Silva2008) used a more conventional gravity equation including bilateral aid flows as a regressor (instrumented by their one year lagged value) and found a significant although small elasticity, again for flows from donor to recipient.
Only some of the most recent studies have looked at whether aid raised the export capacity of recipient countries. Cali and te Velde (Reference Cali and te Velde2009) regressed trade costs and the value of exports on control variables and lagged AfT disbursements, using data from the OECD's Credit Reporting System, on a panel of countries covering 1995–2007.Their various specifications together suggest that aid to trade facilitation and infrastructure seems to have a significant effect (the former on trade costs, the latter on export values), while aid to productive capacity is insignificant. The same results hold when looking at sectorally targeted aid and controlling for country-sector fixed effects. Brenton and von Uexkull (Reference Brenton and von Uexkull2009) combined mirrored product-level (HS4) export data with a long panel of export development aid data from the GTZ and from the OECD/WTO Trade Capacity Building Database for 48 countries. They used a difference-in-differences approach regressing exports on lagged exports, country and year-product fixed effects, and contemporaneous and lagged aid coded in binary form. By and large, once outliers were dropped, propensity-score matching yielded insignificant coefficients, suggesting that once selection effects were taken into account, export development programs provided little significant boost to exports. By contrast, Ferro et al. (Reference Ferro, Portugal-Perez and Wilson2011) found significant effects of aid to services on the export performance of downstream manufacturing industries, using an original identification strategy that combined cross-country data on aid flows to services with data on the service intensity of downstream manufacturing industries from input-output tables. All in all, it is fair to say that, as the literature stands, the effect of AfT on the export performance of beneficiary countries has been established only weakly on the basis of aggregate numbers, Ferro et al. (Reference Ferro, Portugal-Perez and Wilson2011) being possibly the strongest exception.
There is even less specifically on technical-assistance programs (see Marcano and Ruprah, Reference Marcano and Ruprah2009). A brochure published by the EU Commission (EC, 2006) tells the interesting story of a Kenyan fruit and vegetable exporter who got assistance from the EU's Pesticides Initiative Program (PIP); the case study presents the program as:
to provide support to companies like Myner [the Kenyan exporter], to help them get up to speed with European food safety and traceability requirements … Since it began in July 2001, the PIP has had a positive effect on more than 26,000 ACP producers, many of whom are small-scale farmers. Nearly 6.25 million Euros has been committed to the program, with each applicant allocated around 86'000 Euros. In line with the principles of the ACP–EU partnership agreement signed in Cotonou in 2000, the PIP aims to contribute to the development of the ACP's private sector and to promote regional integration.
As for the case study itself, the brochure explains that:
[w]hen Myner Exports began working with the Pesticides Initiative Program, or PIP in 2002, it was exporting about 300 tonnes of French beans, snow peas, passion fruit, and sugar snaps a year to the European Union. Today, the company exports some 900 tonnes a year.
Quoting this particular case study in their assessment of the EU's trade related assistance (TRA), te Velde et al. (Reference Te, Dirk, Adrian and Massimiliano2006) noted that ‘in an ideal world, one would compare this supported company with a similar one that was not supported’. This is precisely what we set up to do in the present paper, although using Senegal instead of Kenya as our sample of study. This paper investigates whether the PIP has significantly affected the export performance of Senegal's horticulture industry. We chose Senegal because the data we had access to provided a unique combination that made it possible to construct a treatment group of firms that got assistance and a control group of firms that did not, and this for a sample period that ran from before the program to its end.
Using this rich data set, we used a wide array of approaches to estimate the effect of the PIP on firm-level exports of fresh fruit and vegetables (FFV). We ran DID regressions of the value of exports, by product×firm×destination, on control variables as well as a dummy variable marking ‘treatment’ by the PIP. In order to deal with selection issues, we combined the DID approach with propensity-score matching. We also used a control-function approach similar to Heckman's selection model (Heckman, Reference Heckman1979).
In most specifications we tried, we failed to find a significant impact. Only when considering a firm's aggregate exports of FFV to the EU did we find a positive and significant effect of the program. Given the small size and peculiarities of the sample, our results should be treated with caution and we would stop short of concluding that the PIP was useless on the basis of this single impact-evaluation exercise. Additionally, beneficiary firms self-selecting in the program would introduce a bias in the estimated treatment effect. However the direction of the bias is not clear. If self-selected firms are larger and potentially more efficient than others, the estimated treatment effect should be biased upwards. Inversely, less productive firms may be more likely to rely on financial aid or rent-seeking, biasing the effect downwards. If so, clearly more research is needed on this issue, possibly on other, larger samples to assess whether the PIP had any impact or not.
The paper is organized as follows. Section 2 presents some stylized facts on the exporting environment of Senegalese FFV producers and on how the PIP addresses its objective of alleviating some of the constraints that these producers face. Section 3 presents the impact evaluation: data, estimation issues. Section 4 presents the baseline results and some robustness tests. Finally Section 5 concludes.
2. Stylized facts
2.1 Senegal's exports of fresh fruits and vegetables
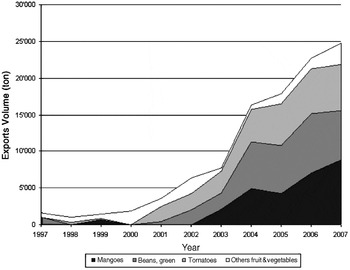
According to Senegal's National Horticultural Direction, national exports of fresh fruits and vegetables (FFV) have been rising at a rate of about 15% a year since 2001. French beans account for most of this increase, with volumes up from 652 to almost 9,000 tons between 2001 and 2007 (Figure 1). In 2007, export volumes of FFV were dominated by French beans (42%), followed by cherry tomatoes (23%), mangoes (16%), and other minor crops, including melons, peppers, and hibiscus.
Horticulture exports (in tons) from Senegal, 1997–2007

Apart from small volumes shipped to neighboring countries, the European Union (EU) remains the main destination market. In 2007, France accounted for 40% of Senegal's FFV export volumes, followed by the Netherlands (35%) and Belgium (16%). In 2008, Senegal ranked fourth among African suppliers of French beans to the EU, after Morocco, Egypt, and Kenya (Maertens and Swinnen, Reference Maertens and Swinnen2009).
In order to penetrate the EU fruit and vegetable market, Senegal's exporters must comply with strict regulations. Among those, new traceability requirements and recent changes in the EU's pesticides regulation have been of particular concern to the horticultural industry. The EU's pesticide regulation has become notably more stringent since the 1990s. About 350 active substances out of the 823 initially approved for use in the EU have been gradually withdrawn, and Maximum Residue Levels (MRL) and Import Tolerances (IT) are now imposed at levels specific to particular protection chemical–crop combinations. When an IT has not been established, a default value of 0.01 mg/kg corresponding to the level of detection in inspection labs are used. As for traceability, the 2002 General Food Law imposes a ‘one-step-forward, one-step-back’ principle within the EU (with no obligation to keep records in third countries). However, in practice EU buyers tend to go beyond the strict legal requirement. Complete traceability all the way up to the overseas producers is part of many private standards such as the GlobalGAP.
Interestingly, EU's rising standards have also profoundly altered the structure of the supply chain in Senegal's horticulture sector (Maertens and Swinnen, Reference Maertens and Swinnen2009; Maertens et al., Reference Maertens, Liesbeth and Swinnen2011). The costs of compliance with stricter standards have induced consolidation at the intermediation stage, with only larger firms able to cope. Intermediaries exert tighter controls over farming methods, and the structure of upstream farm production has changed, with a sharp decrease in the incidence of contract farming and a rise in that of large-scale estate production.
2.2 The PIP in Senegal
The legislative changes in EU standards and their potential detrimental effects on small growers and exporters were one of the primary drivers behind the launch of the PIP. The program is financed by the European Development Fund and implemented by the COLEACP (Europe-Africa-Caribbean-Pacific Liaison Committee). It has two main objectives: first, to enable ACP exporters of FFV to comply with European traceability and food safety requirements (in particular as regards pesticide residues), and, second, to consolidate the position of small-scale producers in the ACP horticultural value chain. The PIP's support activities are organised around five components: (i) good company practises, (ii) training, (iii) capacity building, (iv) regulation and standards, and (v) information and communication. The core of the support (almost 30% of program budget) goes to component (i), which consists of helping producers and exporters to set up internal food safety management systems in production and marketing operations. The regulation and standards component ensures that all substances recommended in crop protocols are authorized in both the EU and origin country. Additionally, when needed, the program introduces registration of active substances as well as import tolerance applications.
Senegal ranks fourth, after Kenya, Ghana, and Uganda, for the number of PIP protocols signed. In Senegal, PIP beneficiaries produce and export essentially green beans, cherry tomatoes, and mangoes to the European market. Their needs relate to in-company training on hygiene and food safety procedures, development of traceability systems, and safe use of pesticides. Four companies also requested support to obtain GlobalGAP certification; for those, pre-audits were conducted. SEPAM obtained its certification in 2004, whereas Soleil Vert, Baniang, and AgriConcept are in the process of certification. Except for SEPAM, SAFINA, and GDS, Senegal's FFV exporters have outgrower contracts with smallholders rather than own production sites. In 2006, in cooperation with Senegal's ANCAR (Agence Nationale de Conseil Agricole et Rural) the PIP launched ‘Golden Bean’, an awareness campaign directly targeting 1,000 small FFV producers.
2.3 Selection into the program
Each applicant submits a request for intervention. To qualify, the requested intervention must help achieve product compliance with EU traceability and food safety regulations. The request identifies by self-assessment the problems, possible fixes, and anticipated results. It also assesses a time line and budget. Applications are considered on a first-come, first-serve basis. No prioritization or selection criteria apply. Upon acceptance, a protocol detailing actions to be implemented by each party on a cost-sharing basis (50% except for smallholders who are expected to contribute only 20%) is signed between the beneficiary and the PIP. Wages and investment costs are de facto excluded. Actions are chosen under each of the five components and each protocol is specific to a beneficiary. Out of the 320 export companies covered under PIP phase one, 219 benefited from the good company practices component, 153 benefited from training under the capacity-building component.
2.4 The PIP's evaluation
An evaluation of the PIP's phase one was undertaken in June 2008. The PIP detailed objectives, expected results, performance indicators, and outcomes are summarized in the appendix's evaluation matrix. The evaluation relies on trade data reported by the firms themselves and from Eurostat, and data from a survey conducted among PIP beneficiaries and EU importers. The impact of the program is evaluated at the aggregate level. Outcomes for beneficiaries are reported without controlling for location, size, or experience, with the exception of objective (S1), for which outcomes are reported by ACP country or type of intervention.
Overall, the evaluation report drew up a very positive image of the program, contributing to the launch of a second five-year phase in 2009. While fairly comprehensive, the PIP's evaluation suffers from a typical drawback of this type of exercise – namely, the lack of a counterfactual to benchmark the performance of treated firms and products. Precisely, we set up to address this issue and estimate the impact of the PIP on Senegal's FFV export flows by taking similar, untreated export flows as the counterfactual.
3. Impact evaluation
3.1 The data
Our dataset is constructed using three databases which together form a rich and unique combination. First, we have export data at the transaction level (aggregated annually) over 2000–2008. Each record includes the firm's tax ID, the product code, the country of destination, and the export value (in US dollars) and quantity (in tons) for over 500 HS8 products to 90 countries. Second, the PIP's administration in Brussels provided us with a list of the Senegalese firms that got assistance from the program in each year of the sample period. Finally, we obtained data on employment and sales from the Centre National d'Identification (CNI). As the CNI also identifies firms by their tax ID, we could merge the three datasets. Among the reporting firms, almost 3% appear only once in the dataset. That is, they export only one product to one destination in one year. As these observations are likely to be mis-reports or individuals, we drop them from our sample. We also drop international organizations and embassies, as well as trading and transport companies (about a quarter of all observations). This leaves us with a sample of almost 2,000 observations.
Let i be an exporting firm, k a product, j a destination country, and t a year. As the PIP targets products (FFV), some of a firm's products may be covered and some others not. In addition, technical assistance provided under the PIP helps make FFV marketable on EU markets, but does not necessarily help on other markets with different (or no) food safety requirements. In view of this, we take the (i,j,k,t) vector as our unit of observation. Our dependent variable is the annual flow of exports of product k to destination j by firm i in year t, y ijkt That is, we take the intensive margin as our baseline measure of performance.
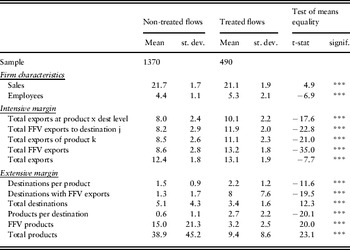
Table 1 gives descriptive statistics of firm-level covariates and performance indicators for treated and non-treated flows. Covariates include firm i's annual (overall) turnover, salesit, and employment, Nemployeeit. Performance indicators at the intensive margin include firm i's exports of product k to destination j in year t, exportijkt; its total exports of FFV to country j in year t, total exportijtFFV; its total FFV exports of product k worldwide, total exportikt; its total exports of FFV worldwide, total exportitFFV; and its total exports worldwide, total exportit. Export performance indicators at the extensive margin include firm i's number of destinations serviced with product k in year t, Ndestikt; its number of destinations served with FFV; NdestitFFV; its total number of destinations, Ndestit; its number of FFV products to destination j, NprodijtFFV; its number of FFV products worldwide, NproditFFV; and its total number of products worldwide, Nprodit.
Descriptive statistics, non-treated and treated flows

Notes: *, **, and *** denote statistical significance at the 10%, 5%, and 1% levels, respectively.
Two observations are noted. First, participating firms are larger than non-participating ones. Thus, size must be controlled in order for non-participating firms to provide a credible counterfactual. Second, these are small firms as regards product and destination margins. The average numbers of products and destinations are small.
3.2 Estimation issues
Estimating the effect of the PIP poses a standard missing-data problem – estimating how much smaller would have been the export flows with assistance, had they not had assistance. Formally, let

and
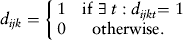
That is, d ijk marks the treatment group. The basic estimator for the problem at hand is the difference-in-differences (DID)

where x is a vector of observable export flow characteristics, δ ijkt and δ t are respectively firm×destination×product and time fixed effects, and u ijkt is an error term. Fixed effects δ ijk control for time-invariant firm characteristics potentially affecting both performance and selection into the program, like managerial ability (see Angrist and Krueger, Reference Angrist, Alan, Ashenfelter and Card1999; Smith, Reference Smith2000; Jaffee, Reference Jaffee2002). Next, in order to deal with selection issues, we combine the DID estimator (1) with matching, following Heckman et al. (Reference Heckman, Hidehiko and Petra1997). From now on, for simplicity of exposition, let us denote by a ‘flow’ a (firm×product×destination) triplet. Using results by Rosenbaum and Rubin (Reference Rosenbaum and Rubin1983), matching is done on the basis of the estimated propensity score (PS), using a probit of the participation status on a vector z of observable firm characteristics. Letting v ijk be an error term, the first-stage selection equation can be written as

In (2), the vector z is identical to x as no outside determinant of participation is available. It must be evaluated at the time the participation decision is made – typically its initial value. The estimated propensity score is then retrieved from (2), and the control group is constructed by selecting untreated firms whose propensity scores are ‘close enough’ to those of treated ones. Under nearest-neighbour matching, each treated flow is matched with the untreated flow having the closest PS within a fixed range.Footnote 1 Practically, DID-with-matching estimation is done in two steps. In the first, the participation equation is estimated, yielding an estimated PS and a common support; in the second, the DID equation is estimated on the common support. The common support is formed by disregarding unmatched individuals as well as those with estimated PS of zero or one. We also control for selection using a control-function approach that closely resembles the Heckit procedure (Heckman, Reference Heckman1979). The approach proceeds in two steps. The first-step regression is as before, i.e. (2). In the second step, inverse Mills ratios retrieved from the first step are added to (1) as additional regressors.
Note that, besides selection bias, other issues may complicate the estimation of γ in (1). One is serial correlation. Persistence in the process driving the error term may be aggravated by the extreme form of serial correlation in the treatment variable. Bertrand et al. (Reference Bertrand, Esther and Sendhil2004) show that ignoring this source of serial correlation can lead to an inflated probability of type-I errors (i.e. being over-optimistic in the evaluation of the treatment's impact). They suggest a correction in two steps. In Step 1, individual performance for both treated and untreated individuals is regressed on all observables except the treatment. In Step 2, residuals from Step 1 for the treated individuals only are retrieved and averaged for (i) the pre-treatment period, (ii) the treatment period. Those average residuals form a two-period panel and are then regressed on an indicator variable τ that takes value 1 for the treatment period. The estimated ATT is the coefficient on τ in the second step.
4. Results
4.1 Baseline results
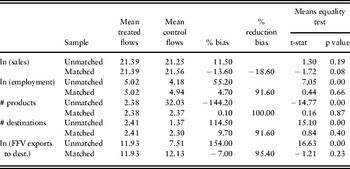
Balancing properties are addressed by testing for equality of means between treated and matched controls for nearest-neighbour matching (Rosenbaum and Rubin, Reference Rosenbaum and Rubin1983). Table 2 reports results for each covariate included in the probit model determining selection into treatment. Covariates include the natural logarithm of firm i's initial turnover, the natural logarithm of its initial number of employees, the initial number of products exported by firm i to destination j, the initial number of countries served with product k, and the natural logarithm of total initial export value of FFV products from firm i to destination j. Results show that, for many covariates, there is a strong bias before matching but matching eliminates it. The null hypothesis of balanced sub-samples is not rejected except for turnover.Footnote 2
Balancing properties of covariates in treated and control groups

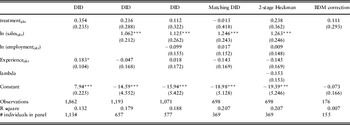
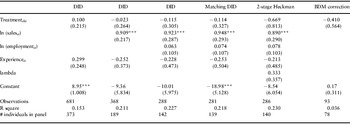
Table 3 reports difference-in-differences (DID) estimates on the treated for our baseline specification. That is, the average effect of the PIP on assisted firms' export performance. The dependent variable is the natural logarithm of the export value of product k from firm i to country j in time t. Our main variable of interest is the treatment indicator variable d ijkt taking value 1 if firm i exporting product k to destination country j benefited from the PIP program in year t. All regressions are run at the i,j,k,t level, and control for (firm×product×country) and time fixed effects. Standard errors are clustered at the firm level. Coefficients in all specifications are not significant, suggesting no effect of the program. Columns 1–3 report DID estimates without matching. Control variables include the natural logarithm of annual turnover of firm i in year t, ln (salesit), the natural logarithm of the number of employees for firm i in year t, ln(Nemployeesit) and firm i's experience in servicing product k to country j, Experienceijkt. This is a dummy variable taking value 1 if the firm exported for at least two years product k to country j before time t. Column 4 reports DID estimates with matching, i.e. restricting the sample to the common support defined using the Nearest Neigbhour(NN)-PSM procedure. Matching is done at the firm×product×destination level and results are reported using the NN estimator with caliper (0.04).Footnote 3 Column 5 reports the treatment-effect estimate using Heckman's two-step procedure, i.e. estimates from the second-step regression run with the inverse Mills ratio λ retrieved from the first step. Column 6 reports results from the second step of the procedure suggested by Bertrand et al. (BDM) (Reference Bertrand, Esther and Sendhil2004). Residuals from the first step are retrieved and averaged for the pre-treatment period and the treatment period.
Baseline results, average effect of the PIP on assisted firms

Notes: Robust standard errors clustered at firm level are in parentheses. *, **, and *** denote statistical significance at the 10%, 5%, and 1% levels, respectively.
Results from the first-step participation regression, which is common to the matching DID and Heckman estimations, are available from the authors upon request. The regression is run at the i,j,k level. Results suggest that the probability of treatment correlates positively with sales and FFV exports, employment, and initial performance at the destination margin, although negatively with product diversification. Thus, treatment seems to have targeted relatively large firms concentrated on a few products. Results for the first step of the BDM procedures are also available from the authors upon request. The regression is run at the i,j,k,t level and the dependent variable is the log value of exports. Individual performance for both treated and untreated individuals is regressed on all observables except the treatment. Only initial sales have a positive significant effect on subsequent growth, suggesting diverging export performances across firms.
4.2 Robustness
In this section, we present estimation results of the effect of the PIP on assisted firms, for two alternative export performance indicators. The choice of aggregation of export flows across all EU-15 destinations and across FFV products follows from the fact that the PIP helped firms achieve FFV products compliance with EU traceability and food safety regulations.
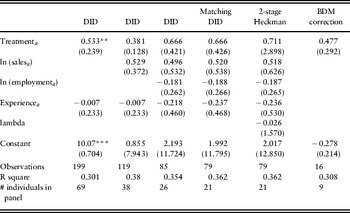
Table 4 reports estimation results when considering firm i exports of product k to the EU-15 in year t, as the export performance indicator. Balancing tests are satisfied and are available upon request. At the firm-product level there is no problem of unbalanced covariates in our model. Regressions are run at the i,k,t level and the coefficients on the treatment variable treatmentikt are not significant for any of the specifications in Table 4. Finally, Table 5 reports results from regressions run at the level of the firm instead of the (firm×product×destination) combination. Estimation at the firm level may drastically reduce sample size and means mixing up exports that are covered by the program with exports that are not (namely, products other than FFV). However, it is advisable, since the decision to participate and some of the covariates are at the firm level. The export performance indicator is the export value of FFV to the EU-15 exported by firm i in year t. Balancing test results are also satisfied. The coefficient on the treatment variable treatmentit is significant at the 5% level only in column (1).
Robustness I, average effect of the PIP on assisted firms

Notes: Robust standard errors clustered at firm level are in parentheses. *, **, and *** denote statistical significance at the 10%, 5%, and 1% levels, respectively.
Robustness II, Average Effect of the PIP on Assisted Firms

Notes: Robust standard errors clustered at firm level are in parentheses. *, **, and *** denote statistical significance at the 10%, 5%, and 1% levels, respectively.
All in all, results suggest that while there seem to be an effect of the program when considering total FFV exports to the EU, the effect disappears when looking at a more disaggregated level (Table 3 and Table 4). These results are in line with findings in the program evaluation report – namely, the share of ACP exporters in EU imports of FFV increased from 6.1% to 6.2% between 2001 and 2006.
5. Concluding remarks
By and large, we find no significant impact of the PIP on Senegal's FFV export flows when taking similar, untreated export flows as the counterfactual. There are two ways of interpreting such a no-impact result.
The naive interpretation is that the PIP simply fails to achieve its objective. That may well be true, but our failure to reject the null of no impact is not sufficient to reach that conclusion. First, the choice of Senegal as a testing ground was driven by data availability. It has no claim to be a representative or random sample. Different conclusions may be reached from other samples, and clearly a full, cross-country impact evaluation should be undertaken. Second, and more importantly, it is possible that the PIP affected not only the treated export flows, but also the untreated ones, through spillovers. Participating firms are the largest and more efficient of Senegal's FFV sector. On the one hand, this means that they are more susceptible than others to benefit from the program. Thus, what we obtain is an estimate of the average effect of the treatment on the treated (ATT), which may over-state the program's potential effect on the whole population of producers. On the other hand, it may also mean that smaller firms, although left out of the program, can benefit from it through imitation of best practices and even unobserved assistance from larger firms. The argument is even more potent for untreated products: when a firm gets PIP assistance for its FFV activities, it is quite possible (indeed, likely) that its other activities benefit as well from improved managerial practices; or destination countries: export flows to non-EU destinations may benefit from the program for the same reason. In the presence of such unmeasured spillovers, the PIP's impact would be underestimated by impact-evaluation methods. This is important to keep in mind, as public assistance (whether from local governments or donors) should be justified by market failures, like spillovers, rather than a positive rate of return to beneficiaries (which would simply create a market demand for assistance services without justifying the use of public funds). Thus, impact evaluation of technical-assistance programs like the PIP is a double-edged sword and must be interpreted with caution.
The second conclusion that should be avoided is that, either because the data are not sufficiently reliable or comprehensive or because of the caveats just discussed, rigorous impact evaluation should not be undertaken. The lack of rigorous impact evaluation undermines the credibility of claims about the program's benefits made on the basis of case studies, because it is impossible to know whether they are representative or not. Indeed, this is the message conveyed by the 2006 assessment of the impact of EU TRA (te Velde et al., Reference Te, Dirk, Adrian and Massimiliano2006). Worse, in a context where taxpayers are asking for accountability and results in development aid, Paul Milgrom's ‘unraveling principle’ applies. Rational taxpayers are likely to take all the news that is not told to be detrimental. In other words, the bad news that impact evaluation can possibly generate (as in the present case) is probably fully anticipated. The more the development community can provide rigorous evidence that at least some programs do make a difference, or that some components do, or that, when not, failure is part of useful experimentation and action is being taken to remedy the observed ineffectiveness, the more support there will be for development aid.
However, as the present study highlights, it is difficult to ‘improvise’ impact evaluation ex-post when a program was not designed to be evaluated. Far better would be to think seriously about evaluation ex-ante so that TRA programs generate experimental settings out of which useful lessons could be drawn.