I. INTRODUCTION
High-energy heavy ions passing through a material can generate narrow trails of damage along their paths, so-called ion tracks. Ion track formation results from inelastic interactions of the projectile ions with the target electrons Reference Dunlop and Lesueur1,Reference Meftah, Costantini, Khalfaoui, Boudjadar, Stoquert, Studer and Toulemonde2 and has been observed in many crystalline and amorphous materials such as semiconductors, Reference Levalois, Bogdanski and Toulemonde3–Reference Bierschenk, Giulian, Afra, Rodriguez, Schauries, Mudie, Pakarinen, Djurabekova, Nordlund, Osmani, Medvedev, Rethfeld, Ridgway and Kluth6 insulators Reference Trautmann, Toulemonde, Schwartz, Costantini and Mueller7–Reference Meftah, Brisard, Costantini, Dooryhee, Hage-Ali, Hervieu, Stoquert, Studer and Toulemonde10 , and various metals. Reference Barbu, Dunlop, Lesueur and Averback11,Reference Dufour, Audouard, Beuneu, Dural, Girard, Hairie, Levalois, Paumier and Toulemonde12
Potassium titanyl phosphate (KTiOPO4 or KTP) has a variety of applications spanning from nonlinear optics to electro–optics due to its large nonlinear optical coefficients and high optical damage threshold. Reference Liu, Dentz and Belt13,Reference Zumsteg, Bierlein and Gier14 The characterization of the ion track morphology is essential for photonic applications Reference Chen15 and integrated optical devices with waveguide fabrication by swift heavy ion irradiation (SHII) of KTP. Reference Opfermann, Höche, Klaumünzer and Wesch16 Some studies are available concerning the waveguide properties and ion radiation damage of KTP using Rutherford backscattering spectroscopy/channeling Reference Bindner, Boudrioua, Loulergue and Moretti17–Reference Wang and Shi20 ; however, a detailed investigation of the ion track morphology in SHII KTP is still lacking.
Small angle x-ray scattering (SAXS) is sensitive to nano-scale density changes and it has been demonstrated to be a powerful technique for the measurement of ion track damage. Reference Rodriguez, Afra, Trautmann, Toulemonde, Bierschenk, Leslie, Giulian, Kirby and Kluth21–Reference Kluth, Pakarinen, Djurabekova, Giulian, Ridgway, Byrne and Nordlund24 It is nondestructive, does not require elaborate sample preparation and measures the entire ion track. Changes in track radii can be determined with very high precision and quick acquisition times enable in situ studies, for example to identify the track annealing kinetics. Reference Afra, Lang, Rodriguez, Zhang, Giulian, Kirby, Ewing, Trautmann, Toulemonde and Kluth25
In this paper, the morphology of ion tracks in SHII KTP is investigated using SAXS, transmission electron microscopy (TEM), and atomic force microscopy (AFM). Results are compared with calculations using an inelastic thermal-spike (i-TS) model.
II. EXPERIMENTAL
Single crystalline wafers of both z-cut and x-cut KTP were irradiated with 185 MeV Au ions with fluences of 1 × 10¹⁰ and 1 × 10¹¹ ions/cm2 at the ANU Heavy Ion Accelerator Facility. Z-cut and x-cut KTP refer to the surface normal parallel to the z-axis and x-axis, respectively. Irradiation was performed at normal incidence and room temperature. For the irradiation energy used, the nuclear energy loss is negligible and the electronic energy loss at the surface amounts to approximately 22 keV/nm. All KTP samples had a thickness of 1 mm before irradiation. After irradiation, samples were mechanically polished from the backside to a thicknesses of ∼30 µm to reduce parasitic scattering from the substrate during the SAXS experiments. The final thickness exceeds the ion range of ∼15 µm, and as such the entire tracks are contained in the samples.
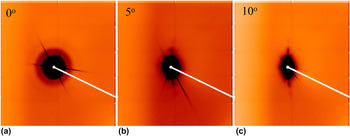
Transmission SAXS measurements were carried out at the SAXS/WAXS beamline at the Australian Synchrotron Reference Kirby, Mudie, Hawley, Cookson, Mertens, Cowieson and Samardzic-Boban26 using an x-ray energy of 11 keV and a sample-to-detector distance of 1588 mm. For precision alignment of the samples in the x-ray beam, a 3-axis Bruker goniometer (Bruker Corporation, Billerica, MA) was utilized. Measurements were performed at 0, 5, and 10° tilt of the ion tracks with respect to the x-ray beam. Scattering from a sample without ion tracks was measured for background removal. For calibration of the scattering intensities to absolute values, a glassy carbon standard was measured. Reference Zhang, Ilavsky, Long, Quintana, Allen and Jemian27 A Pilatus 1M detector (DECTRIS Ltd., Baden-Dättwil, Switzerland) was used for data collection with exposure times between 5 and 10 s. Figure 1 shows scattering images of ion tracks in x-cut KTP irradiated with a fluence of 1 × 10¹¹ ions/cm2. The isotropic image in (a) results from the parallel orientation of the ion tracks to the x-ray beam and is consistent with a circular cross section of the tracks. Reference Meftah, Brisard, Costantini, Dooryhee, Hage-Ali, Hervieu, Stoquert, Studer and Toulemonde10 The scattering images of the tracks tilted by 5° (b) and 10° (c) resemble slightly curved streaks. These patterns result from the extremely high aspect ratio of the ion tracks that are approximately 15 µm long, yet only a few nanometres wide. The intense straight diffraction lines in the SAXS patterns originate from the single crystalline substrate. The scattering signal from ion tracks can be detected in all irradiated samples.
SAXS images of x-cut KTP irradiated with 185 MeV Au ions to a fluence of 1 × 10¹¹ ions/cm2 with the tracks (a) collinear with the x-ray beam, showing an isotropic scattering pattern, (b) tilted by 5° and (c) tilted by 10° with respect to the x-ray beam.

Both plan-view and cross-section TEM was performed on the samples using a JEOL 2100F microscope (JEOL Ltd., Tokyo, Japan) operating at 200 kV. Standard sample preparation using polishing and ion milling was used. Under the given measurement conditions, we have not observed any changes of the ion tracks during imaging.
The surface morphology of the irradiated KTP samples was measured using AFM. These measurements were performed under ambient conditions on a Bruker Multimode VIII microscope (Bruker Corporation, Billerica, MA), operating in tapping mode at a cantilever frequency of 250 ± 10 kHz.
III. RESULTS AND DISCUSSION
A. Small angle x-ray scattering
For SAXS data analysis, the scattering intensities from the curved streaks of oscillating intensities [see Figs. 1(b) and 1(c)] were extracted. The background produced by scattering from the crystalline matrix was removed by subtracting scattering intensities from narrow radial sectors that exclude the high intensity streaks resulting from the tracks. This was found to be essentially the same as scattering from the unirradiated sample, yet better enables the subtraction of fluctuations in the background resulting from air scatter.
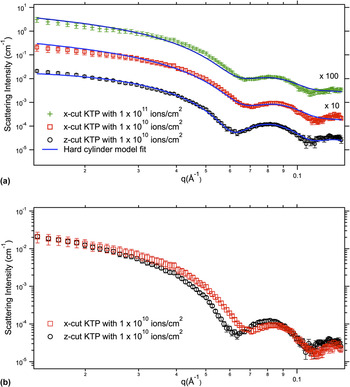
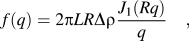
Figure 2(a) shows the scattering patterns from ion tracks in KTP irradiated with 185 MeV Au+ ions to a fluence of 1 × 10¹⁰ ions/cm2 in both x-cut and z-cut and 1 × 10¹¹ ions per cm2 in x-cut. Patterns are shown after background removal and the corresponding model fits (solid lines) are also presented. The strong oscillations in the SAXS intensities of the KTP samples indicate monodisperse track radii with rather abrupt density transitions between track and matrix material. SAXS measures a large number of tracks (approximately 107) and the irradiation generates (almost) identical, parallel, well-separated tracks. The measurements thus correspond to the individual track structure, averaging out fluctuations on an atomic scale. The best model to adequately reproduce the experimental data consists of a cylindrical ion track with constant electron density. Reference Rodriguez, Afra, Trautmann, Toulemonde, Bierschenk, Leslie, Giulian, Kirby and Kluth21 The corresponding scattering amplitude can be expressed as
 $$f\left( q \right) = 2\pi LR\Delta \rho {{{J_1}\left( {Rq} \right)} \over q}\quad ,$$
where L is the track length, R the track radius, Δρ the density contrast between track and matrix, and q the scattering vector. J 1 denotes the first order Bessel function. The change in electron density between the track and matrix is described by a step function. The fits yield a track radius of 6.0 ± 0.1 nm for the x-cut KTP sample and 6.3 ± 0.1 nm for the z-cut KTP sample. The uncertainties listed are the fitting errors from the nonlinear least squares fits. A narrow Gaussian distribution of the radius was used to account for deviations of the track shape from a perfect cylinder such as the variation of the track radius over the track length resulting from changes in the stopping power and deviations from perfectly sharp track boundaries. Reference Kluth, Schnohr, Pakarinen, Djurabekova, Sprouster, Giulian, Ridgway, Byrne, Trautmann, Cookson, Nordlund and Toulemonde22 The width of this distribution for both samples is 0.9 ± 0.1 nm. We note that this is not the statistical uncertainty in the track radius. Figure 2(b) presents the SAXS patterns of both z- and x-cut to visualize the difference between the two. The offset of the SAXS patterns in q of both orientations is clearly apparent in the figure and results in the different fitted track radii. Possible errors related to differences in the experimental setup for both samples (e.g., the sample position) are much smaller than the observed difference in the patterns. While other systematic errors cannot be fully excluded, the samples were measured under identical conditions and as such those can be ruled out to be responsible for the difference as well.
(a) SAXS intensities as a function of scattering vector q for tracks in both x-cut and z-cut KTP irradiated with ion fluences of 1 × 10¹⁰ and 1 × 10¹¹ ions/cm2. The solid lines are the corresponding fits to the theoretical model. The patterns are offset for clarity. (b) SAXS patterns of both x-cut and z-cut KTP samples irradiated under identical conditions.

The density change between track and matrix material can be estimated to 1 ± 0.5%. Track overlap effects can be neglected at the fluences under investigation. This is confirmed estimating the area of modified material d as: d = 1 − exp(−πR 2ν) Reference Riedel and Spohr28 : where R is the track radius and ν the ion fluence. For low ion fluences, the area where ion tracks overlap can then be estimated as πR 2ν − d. For a track radius of 6.0 nm the extent of overlap of the modified area is 2.7% for a fluence of 1 × 10¹⁰ ions per cm2, and 5.6% for a fluence of 1 × 10¹¹ ions/cm2. Both of these fluences are low enough to neglect track overlap.
As indicated above, the track radius in x-cut and z-cut KTP samples differs by ∼5%. This difference in the track radius along two orientations is of the same order of magnitude as that in SHI irradiated quartz samples. Reference Schauries, Lang, Pakarinen, Botis, Afra, Rodriguez, Djurabekova, Nordlund, Severin, Bender, Li, Trautmann, Ewing, Kirby and Kluth29,Reference Schauries, Leino, Afra, Rodriguez, Djurabekova, Nordlund, Kirby, Trautmann and Kluth30 As shown in Sec. 4, different thermal conductivity along different crystal orientations is one factor leading to this difference, which is corroborated by calculations using a thermal-spike model. Additionally, different atomic arrangements along different orientations could also influence ion track formation.
B. Transmission electron microscopy
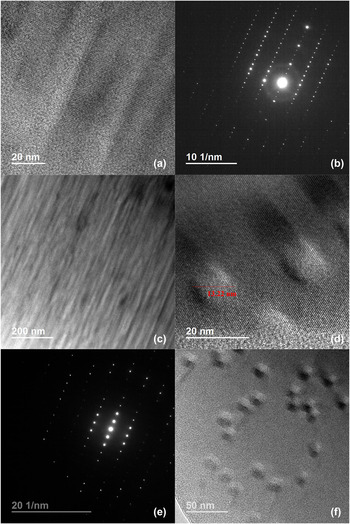
Figure 3 shows cross-section TEM images of ion tracks in z-cut KTP irradiated to a fluence of 1 × 10¹¹ ions/cm2 in (a) and (c) with different magnifications, as well as plan-view TEM images of ion tracks in z-cut KTP with a fluence of 1 × 10¹⁰ ions/cm2 in (d) and (f). The cross-sectional TEM images indicate continuous ion tracks with a different contrast to that of the surrounding crystalline matrix. The diffraction pattern in Fig. 3(b) taken with the electron beam parallel to the zone axis of the substrate shows the crystalline structure of the substrate as well as rings confirming the presence of amorphous material, presumably in the ion track. In the plan-view TEM images, the approximately circular tracks consist of an amorphous core region with a rather sharp transition to the crystalline matrix [Figs. 3(d) and 3(f)]. The orientation of the track in this case is parallel to the zone axis, as determined by diffraction [Fig. 3(e)]. Figures 3(d) and 3(f) confirm that the ion track overlap effect is negligible under this ion fluence. The track diameter was obtained from the ion tracks shown in Fig. 3(d) and is approximately 13 ± 2 nm. The uncertainty was estimated based on the somewhat indistinct choice of the track boundaries in the images. Within these uncertainties, the observed track diameter is consistent with the SAXS results. SAXS provides a more reliable value of the track radius, because it measures a larger number of tracks that are well aligned in a bulk sample in comparison with TEM, which is limited to the observation of a small number of tracks localized in a thin sample surface area. Although SAXS is not able to determine if the sign of the density difference of a scattering object is positive or negative, it is plausible to assume that the mass density of amorphous tracks is less than the surrounding crystalline matrix. Reference Rodriguez, Li, Chen, Trautmann, Bierschenk, Afra, Schauries, Ewing, Mudie and Kluth31 Consequently, we suggest, that the density of the amorphous tracks is 1 ± 0.5% lower than the density of the crystalline matrix. This is also confirmed by the following AFM results.
Cross-section TEM images (a) and (c), and corresponding electron diffraction image (b) of ion tracks in z-cut KTP irradiated with 185 MeV Au ions at fluence of 1 × 10¹¹ ions/cm2; plan-view TEM images of ion tracks in z-cut KTP irradiated with 1 × 10¹⁰ ions/cm2 in (d) and (f) and corresponding electron diffraction image (e).

C. Atomic force microscopy analysis
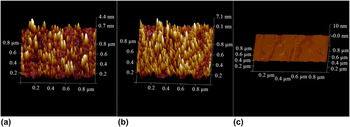
Figure 4 presents the surface morphology of z-cut KTP irradiated with fluences of 1 × 10¹⁰ (a) and 1 × 10¹¹ ions/cm2 (b), as well as that of an unirradiated KTP sample for comparison (c). The virgin KTP has a flat surface with a roughness of 0.2 nm over an area of (1 × 1 µm2). The irradiated KTP surface exhibits conical-shaped hillocks with circular bases [Figs. 4(a) and 4(b)], which correspond to the ion tracks. The hillocks result as a consequence of out of plane expansion of the amorphous material in the track due to a decreased density of the amorphous material with respect to the crystalline phase. Reference Skuratov, Zinkle, Efimov and Havancsak32,Reference Ramos, Bonardi, Canut, Bouffard and Della-Negra33 As apparent from the figure, the number of hillocks increases with increasing fluence. The number of hillocks per unit area of the low fluence sample amounts to approximately 1.5 × 10¹⁰ hillocks/cm2, in agreement with the nominal fluence ∼1 × 10¹⁰ ions/cm2 (within uncertainties). It indicates each ion produces a track and the effect of overlap is negligible. Similar observations were obtained from AFM measurements of the x-cut samples.
AFM surface plots of 185 MeV Au+-irradiated KTP with fluences of 1 × 10¹⁰ (a) and 1 × 10¹¹ ions/cm2 (b), and that of unirradiated KTP for comparison (c).

D. Thermal-spike model
To estimate the local temperature around the ion trajectory of a heavy ion, we utilize an i-TS model. In this model, the energy lost by the ions traversing the solid is deposited into the electronic system and subsequently transferred to the atomic system by electron-phonon interactions. The process can be modeled using two coupled heat-diffusion equations Reference Wang, Dufour, Paumier and Toulemonde34–Reference Toulemonde, Dufour, Meftah and Paumier36 :
 $${C_{\rm{e}}}\left( T \right){{\partial {T_{\rm{e}}}} \over {\partial t}} = \nabla \left[ {{K_{\rm{e}}}\left( T \right)\nabla {T_{\rm{e}}}} \right] + A\left( {r,t} \right) - g\left( {{T_{\rm{e}}} - {T_{\rm{a}}}} \right)\quad ,$$
 $${\rho _{\rm{a}}}{C_{\rm{a}}}\left( T \right){{\partial {T_{\rm{a}}}} \over {\partial t}} = \nabla \left[ {{K_{\rm{a}}}\left( T \right)\nabla {T_{\rm{a}}}} \right] + g\left( {{T_{\rm{e}}} - {T_{\rm{a}}}} \right)\quad ,$$
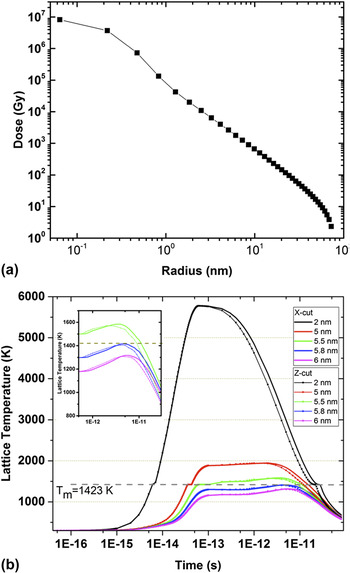
where T e, T a, C e(T), C a(T), K e(T), and K a(T) are the temperatures, the specific heats, and the thermal conductivities of the electronic and atomic subsystems, respectively. g is the coupling parameter governing the strength of the electron–phonon interaction, ρa is the mass density of KTP, and A(r,t) the energy given to the electrons by the ion at a time t and a distance r from the centre of the ion path. This takes the form: A(r,t) = A 0 D(r)exp[−(t − τ)2/2τ2], where τ is the mean flight time of the delta electrons, which is assumed to be of the order of 10−15 s. A 0 is a normalization constant for the total deposited energy such that it is equivalent to S e. D(r) is the initial spatial energy distribution of the electrons and calculated using the formalism by Waligórski et al. Reference Waligórski, Hamm and Katz37 for Au ions with an energy of 185 MeV. The resulting energy distribution is shown in Fig. 5(a), where it is apparent that more than 90% of the energy is deposited within 1 nm radial distance from the ion trajectory.
(a) Radial distribution of energy deposited around the ion path of KTP irradiated with 185 MeV Au ions. (b) Simulated evolution of the lattice temperature versus time at various distances (2, 5, 5.5, 5.8, and 6 nm) from the ion path in both x-cut (solid lines) and z-cut (dotted lines) KTP irradiated by 185 MeV Au+-ions. T m = 1423 K corresponds to the melting temperature of KTP. The inset shows a magnification of the later stages of the lattice temperature to highlight the differences for the two crystal cuts.

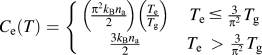
Due to the dielectric nature of KTP, we adopt the approach proposed in Ref. Reference Dufour, Khomenkov, Rizza and Toulemonde38, where the electronic system behaves linearly at temperatures below the band gap, where only a fraction of the electrons are ionized, and as a free electron gas for temperatures above the band gap. The relation between electronic specific heat C e and temperature T e used in this work is thus:
 $${C_{\rm{e}}}\left( T \right) = \left\{ {\matrix{ {\left( {{{{\pi ^2}{k_{\rm{B}}}{n_{\rm{a}}}} \over 2}} \right)\left( {{{{T_{\rm{e}}}} \over {{T_{\rm{g}}}}}} \right)} & {{T_{\rm{e}}}\, \le \,{3 \over {{\pi ^2}}}{T_{\rm{g}}}} \cr {{{3{k_{\rm{B}}}{n_{\rm{a}}}} \over 2}} & {{T_{\rm{e}}}\, > \,{3 \over {{\pi ^2}}}{T_{\rm{g}}}} \cr} } \right.$$
Here T g is the temperature corresponding to the band gap energy, E g = k B T g = 4.9 eV for KTP. k B and n a are the Boltzmann constants and atomic density, respectively. The electron–phonon coupling constant g is related to the mean free path λ through the formula λ2 = K e/g, where λ is considered as an adjustable parameter. For the insulator material KTP with band gap of 4.9 eV, λ is assumed to be 4 nm. Reference Martynenko and Yavlinskii39,Reference Komarov40
For the lattice system, the specific heat was assumed to be constant. The atomic thermal conductivity of KTP varies along different crystallographic directions with K x = 2.0 × 10⁻², K y = 3.0 × 10⁻², and K z = 3.3 × 10⁻² W/cm/K (the subscript denoting the crystallographic direction). For the calculations of tracks parallel to the z-axis (x-axis), the average of K x and K y (K y and K z ) was used. 41
By using the radial energy distribution as the energy input in the heat-diffusion equation for the electronic system shown in Fig. 5(a) we calculated the temperature profile of the lattice at different times.
The electrons near the ion trajectory are excited to very high temperatures on an extremely short time scale. A fraction of their energy is then transferred to the atoms by electron–phonon interactions, which causes the local temperature to increase above the melting point of the material. The lattice temperature decreases with increasing distance from the ion path, and the ion track dimension is related to the largest distance where the temperature exceeds the melting point of T m = 1423 K. Due to the lack of information available for the latent heat of melting for this material, we estimated this value by averaging the latent heat for the elemental composition resulting in 518.85 J/cm3, which probably underestimates the real value. The calculations yield a radius of ∼5.8 and 5.9 nm for tracks along the x-direction (x-cut) z-direction (z-cut), respectively. Figure 5(b) presents the simulated evolution of the lattice temperature versus time at various distances between 2 and 6 nm from the ion path in both x-cut and z-cut KTP irradiated with 185 MeV Au+ ions. The difference in the patterns of x-cut and z-cut results from the different thermal conductivities of the different crystal orientations. As apparent from Fig. 5(b), the effect becomes important at the later stages of the thermal spike, during the cooling phase. The inset in Fig. 5(b) shows a magnification of this area, which highlights these differences. The calculated difference in the track radii is approximately 2%, indicating that the thermal conductivity makes a significant contribution to the observed 5% difference in the ion track radii along both orientations. Anisotropies in other physical properties of KTP such as mechanical and piezoelectric properties Reference Chu, Bierlein and Hunsperger42,43 are also likely to contribute to this effect.
It is important to note that this effect should be present in most crystalline materials, as they often possess different values for the thermal conductivity in different crystallographic directions. This could possibly explain similar differences observed in quartz Reference Schauries, Lang, Pakarinen, Botis, Afra, Rodriguez, Djurabekova, Nordlund, Severin, Bender, Li, Trautmann, Ewing, Kirby and Kluth29,Reference Schauries, Leino, Afra, Rodriguez, Djurabekova, Nordlund, Kirby, Trautmann and Kluth30 and apatite. Reference Li, Kluth, Schauries, Rodriguez, Lang, Zhang, Zdorovets, Trautmann and Ewing44 To resolve the small magnitude of such differences, however, requires accurate measurements of the track radii such as those attainable by SAXS.
IV. CONCLUSION
The morphology and radius of ion tracks generated by 185 MeV Au ions in KTP has been investigated by means of synchrotron SAXS, TEM, and AFM. SAXS results indicate ion track radii depend on the crystalline orientation. The radius obtained from SAXS is consistent with that from TEM results, yet the higher precision of SAXS enables us to resolve a 5% difference between radii in z- and x-cut samples. High-resolution TEM and AFM provide clear evidence that the tracks in KTP are amorphous with approximately circular cross-section, and of lower density than the surrounding crystalline matrix. Calculations using an i-TS model are in good agreement with the experimental results and indicate that differences in the thermal conductivity along the z- and x-axes contribute significantly to the difference in track radii observed along these directions.
ACKNOWLEDGMENTS
The authors acknowledge the National Nature Science Foundation of China (Grant No. 51272135) and the Australian Research Council for financial support and thank the staff of the ANU Heavy Ion Accelerator Facility for technical support. Part of this research was undertaken on the SAXS/WAXS beamline at the Australian Synchrotron, Victoria, Australia.