INTRODUCTION
There are 336 fish species from 107 families in the Persian Gulf, of which about 150 have been reported as edible and marketed (Coad, Reference Coad1992). However, only 35–40 species have been reported as important commercial species (IFRO Experts Group, 2006).
Flatheads (family Platycephalidae) are a group of tropical and temperate marine fish, and two species occur in the Persian Gulf (Mohammadikia et al., Reference Mohammadikia, kamrani, Taherizadeh, Saghghar, Dehghani and Dabbagh2012). These fish are characterized by an elongated body, depressed head and large mouth, with the lower jaw longer than the upper jaw. They do not have tentacles above the eye, and the bony ridges on the head are smooth except for a small spine in front of the eye, two spines on the preoperclum and two or three black longitudinal stripes on the tail fin. These demersal fish are frequently found on muddy or sandy bottoms of the continental shelf, are frequently found shallower than 100 m depth and may extend to 300 m (Knapp, Reference Knapp, Carpenter and Niem1999; Froese & Pauly, Reference Froese, Pauly and Day2007).
Day (Reference Day1878) noted that there were 13 species of flatheads in Indian seas, whilst Imamura (Reference Imamura2007) more recently reported that the Platycephalidae included almost 17 genera. Platycephalus indicus (Iranian name: ‘zaminkan domnavari’) is the largest platycephalid that inhabits the temperate and tropical coastal waters of the Indo-West Pacific region (Jordan & Richardson, Reference Jordan and Richardson1908). So far, the biology and ecology of P. indicus from Iranian waters, as well as information on the age and growth of the species, have not been well studied; however, to manage P. indicus stocks it is important to understand population dynamics, and so an accurate method of age determination is required.
Most studies on growth and age determination have been conducted on P. indicus in Japanese waters. In previous studies, Hiyama (Reference Hiyama1969) used scales, while Chen & Zhao (Reference Chen and Zhao1986) used scales and transverse sections of the whole otolith. Masuda et al. (Reference Masuda, Ozawa, Onoue and Hamada2000) reported a method for determining the age and growth of P. indicus by using transverse sections of otoliths. At present, this is regarded as the best method for age determination for this species. In the present study, these methods were also undertaken to estimate growth and age and mortality rates for this species in Iranian waters, with other biological information also given.
MATERIALS AND METHODS
The main fishing areas for P. indicus in the south-west Persian Gulf are located in the coastal waters of Bandar Abbas (Figure 1). A total of 1106 individual P. indicus were captured from May 2011 to April 2012. Most of the samples were collected from Moshta fishery catches (fixed stake net traps); however, some of the specimens were purchased from fish markets; these specimens had been caught using long line or gillnets at depths of less than 90 m. The collected samples were transferred in iceboxes to the Persian Gulf and Oman Sea Ecological Research Institute laboratory at Bandar Abbas.
A total of 1106 specimens were sexed by observation of the gonads. Total length (LT) to the nearest millimetre and total weight (WT) to the nearest gramme were recorded for each fish in the laboratory. The total length of each individual fish was taken from the tip of the upper jaw to the tip of the caudal fin. The length–weight relationship was described using the relationship W = aLb (Beverton & Holt, Reference Beverton and Holt1996).
Location of the sampling sites of Platycephalus indicus.

The length–frequency data were pooled into groups with 2 cm length intervals.
The von Bertalanffy growth equation was defined as follows (Sparre & Venema, Reference Sparre and Venema1998):
 $$L_{t}= L_{\infty} \lpar 1- e ^{-k \lpar t-t0\rpar } \rpar \comma$$
where L t is the length (mm) and weight (g) and L ∞ is the asymptotic length, K is the growth coefficient, t the age (yr) and t0 is the hypothetical age when length would be zero.
The gonads were dissected from the fish and then weighed to the nearest 0.01 g (W G); sex was checked by the naked eye or a microscope. The gonadosomatic index (GSI) was calculated as:
 $$GSI=\lpar W_{G}/\lpar W_{T}-W_{G}\rpar \rpar \times 100\percnt .$$
The hepatosomatic index (HSI) was calculated as
 $$HSI=\lpar W_{L}/W_{T}\rpar \times 100\percnt \comma$$
where W L is liver wet weight (g) (Mazlan & Rohaya, Reference Mazlan and Rohaya2008).
The monthly length–frequency distributions were analysed using the appropriate routines and subroutines of the FiSAT program (Gayanilo et al., Reference Gayanilo, Sparre and Pauly1998). For the separation of the length–frequency composition into its component distributions, the method of Bhattacharya (Reference Bhattacharya1967) was used. A prime estimate of the asymptotic length (L∞) and the growth coefficient (K) were obtained by applying the method of Wetherall (Reference Whetherall1986). The estimate (K) was ascertained by the equation of Pauly et al. (1998). The resultant growth estimates were then used as seed values in the ELEFAN I program (Pauly & David, Reference Pauly and David1981) for estimating the best combination of L∞ and K.
The instantaneous rate of total mortality (Z) was estimated by the length converted catch curve method described by Pauly (Reference Pauly1983). The instantaneous rate of natural mortality (M) was computed using the following three methods: (1) Pauly's (Reference Pauly1980) empirical equation; (2) Ralston's (Reference Ralston, Polovina and Ralston1987) regression method; and (3) King (Reference King1995). This formula requires an input of ambient temperature which was 26.5°C for the Persian Gulf. The method is as follows:
 $${\rm M}=-{\rm ln} \lsqb 0.01\rsqb /{\rm t}_{{\rm max}}\comma \; {\rm where\, \, t}_{{\rm max}}$$
is the time required for a fish to reach 95% of the species L∞, or the maximum age. t0 was estimated by employing the equation of Pauly (Reference Pauly1980):
 $${\rm Log} \lpar \!-\!{\rm t}_{0}\rpar =-0.3955 -0.2752\, \, {\rm Log \, \, L}_\infty -1.038\, \, {\rm Log\, \, K}$$
T0 is the hypothetical age when the size is zero, assuming that the animal has always grown according to the von Bertalanffy growth equation. Φ was calculated using the following formula (Pauly & Munro, Reference Pauly and Munro1984):
 $$\Phi = {\rm log\, \, K} + 2\, \, {\rm log\, \, L}\infty$$
The instantaneous rate of fishing mortality (F) was extracted as F = Z-M. The exploitation ratio (E) was calculated as the fraction of death caused by fishing divided by total dead fish, E = F/Z. Resource status was evaluated by comparing estimates of the fishing mortality rate with target (Fopt) and limit (Flimit) biological reference points (BRP), which were defined as: Fopt = 0.5M and Flimit = 2/3M (Patterson, Reference Patterson1992). The length at which 50% of the catch was retained in the net (Lc) was obtained by plotting the curve for probability of capture by length (Pauly, Reference Pauly1984).
Otoliths were removed from the fish, washed with tap water, and then kept in a dried condition. Sectioned sagittal otoliths were used to estimate age. Previous work (e.g. Musada et al., Reference Masuda, Ozawa, Onoue and Hamada2000) suggested that sectioned otoliths were easier to interpret and produced more accurate estimates of age than whole otoliths. One otolith of each fish was embedded in clear resin and sectioned (2 mm thick) transversely through a focus with a microcutter (type MC-201, Maruto, Tokyo, Japan). The sectioned otoliths were polished using a grinder (type 9820, Makita, Tokyo, Japan) up to the focus, leaving a consequent thickness of 0.2 mm, and mounted on a glass slide with nail enamel (Musada et al., Reference Masuda, Ozawa, Onoue and Hamada2000). The right sagittae was used for age determination (although the left sagittae was used if the right sagittae was damaged when extracted from the fish or during the sectioning process). Opaque zones on sectioned otoliths were counted by three readers under a binocular microscope (25× magnification) with reflected light against a black background, and when the resulting counts of the opaque zones for them were agreed, they were adopted.
RESULTS
Length–weight relationship
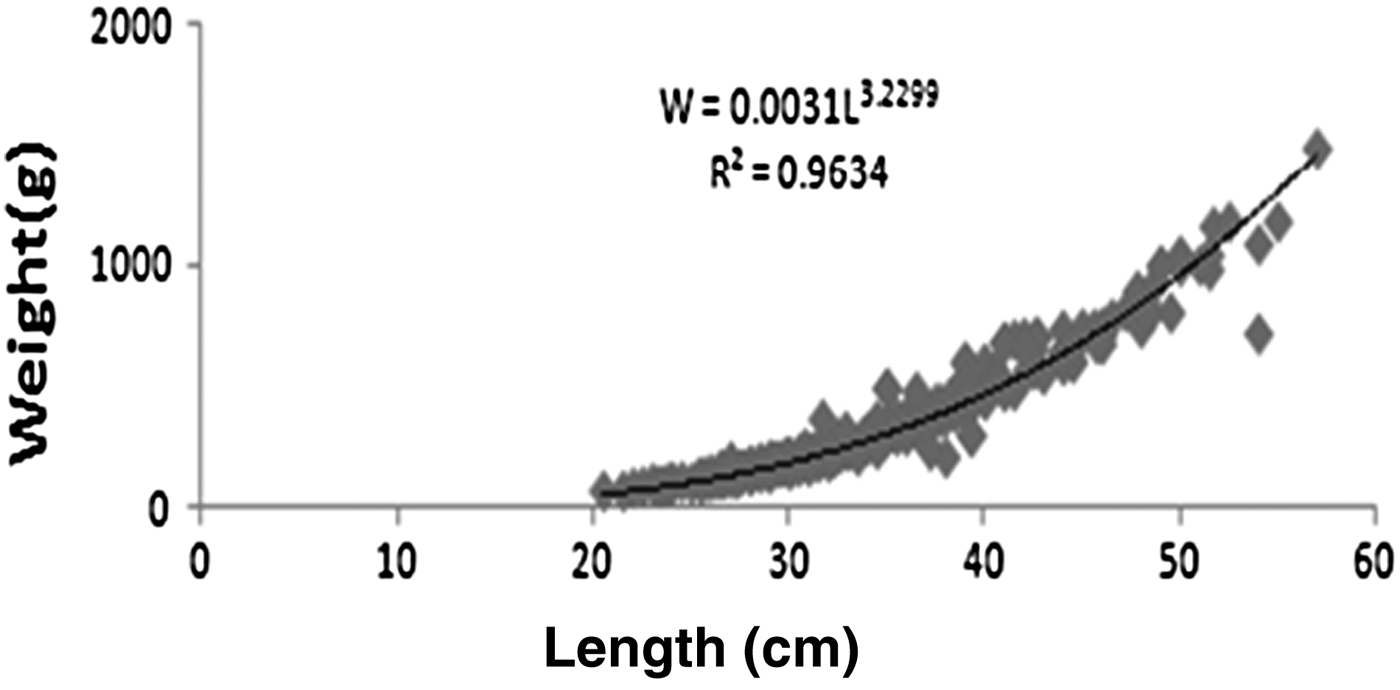
The total length measurements of the P. indicus specimens ranged from 18 to 57 cm with an average length of 34.12 ± 2.06 cm. The total weight measurements varied from 81 to 480 g with an average of 321 ± 66.75 g. The length–weight relationship (sexes combined, Figure 2) was calculated as W = 0.0031 L3.2299 (N = 472, R² = 0.9634), respectively.
The length–weight relationship curve for Platycephalus indicus.
Frequency distribution
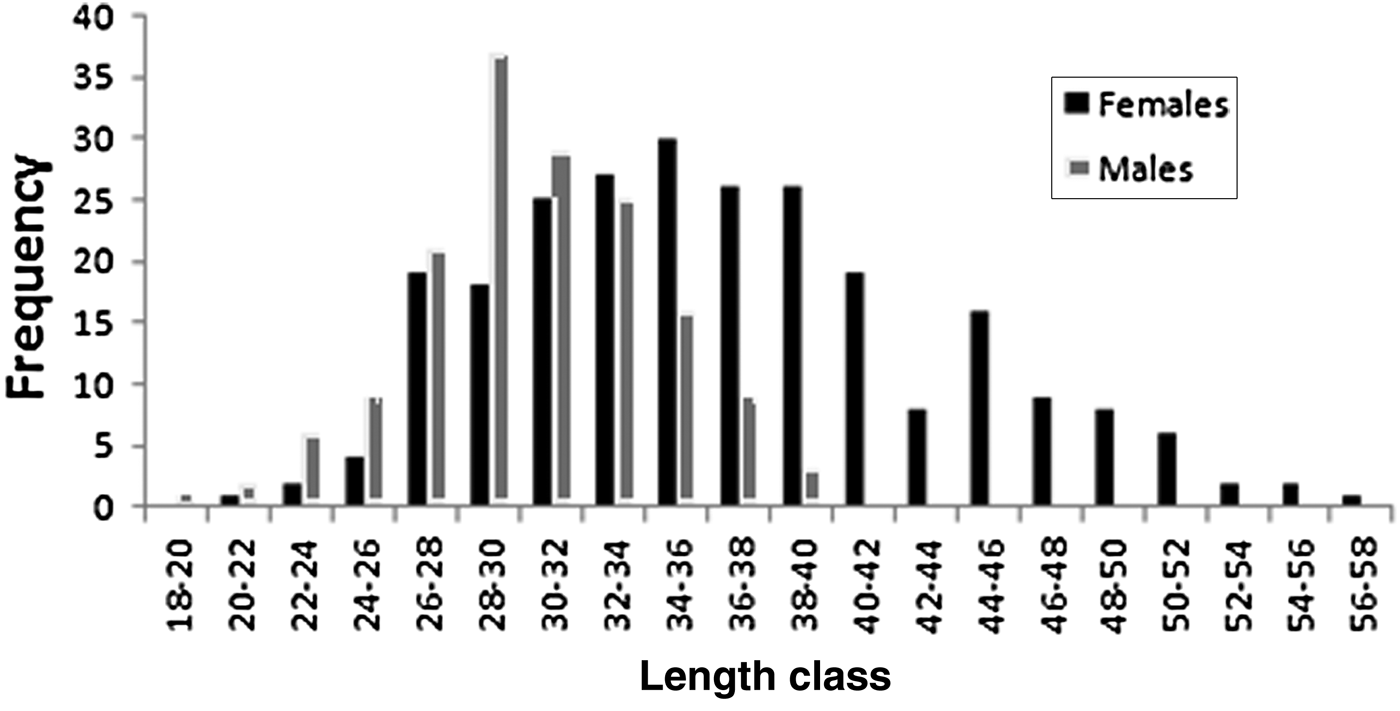
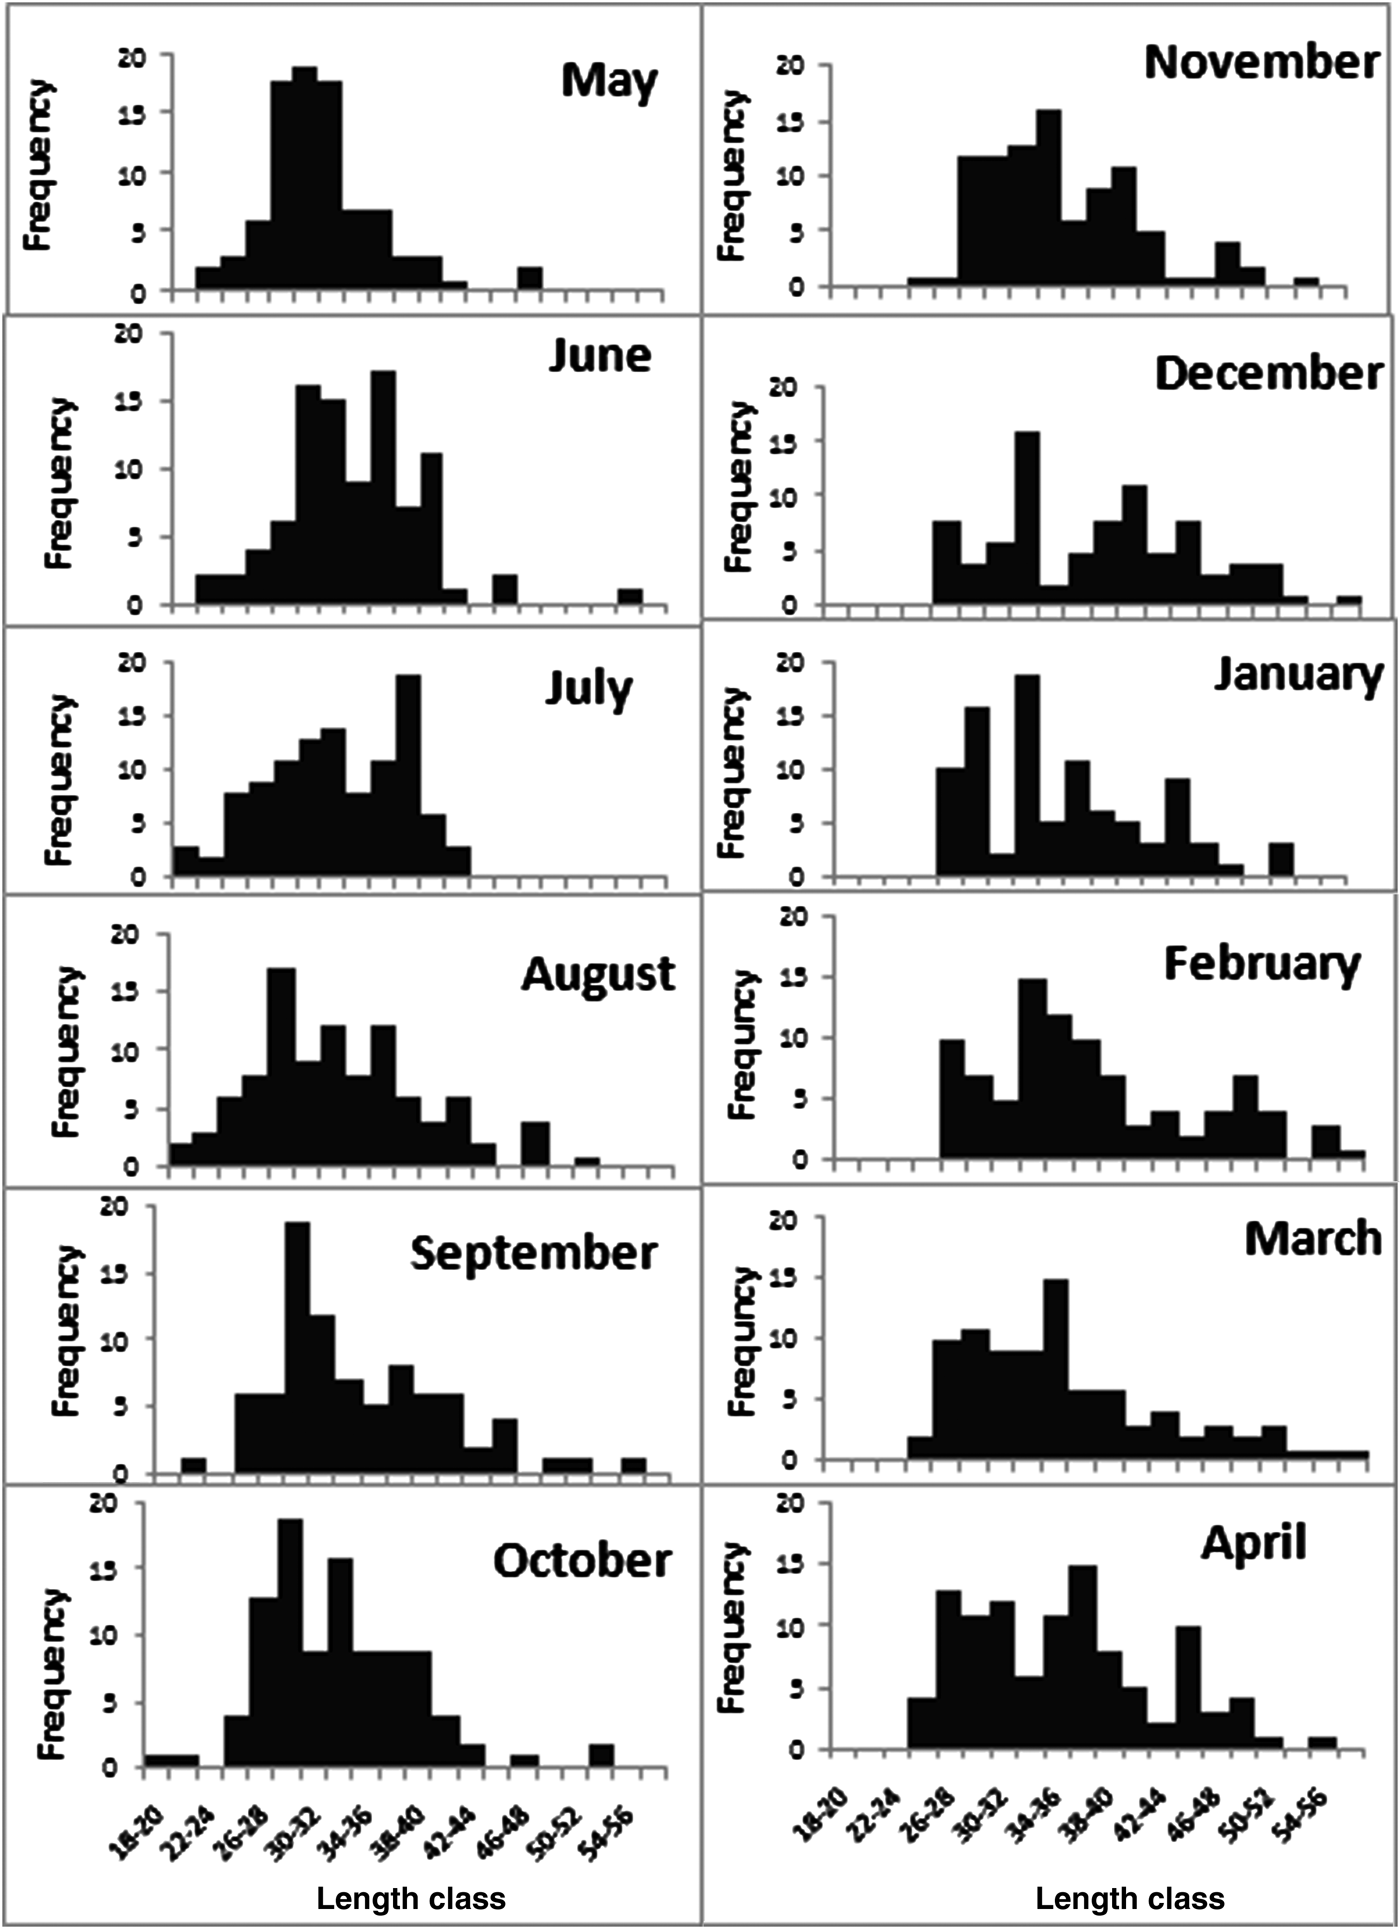
In this study, the smallest males observed were 18 cm LT, and the smallest females were 21 cm LT. Overall, 74% of the specimens were male, although the proportion of males gradually decreased with increasing total length (Figure 3), with the largest male 39.2 cm LT. Specimens larger than 39 cm in LT were female. Thus, the sex-ratio changed markedly according to the length of the fish. Length–frequency distributions clearly showed the sexual dimorphism in length attained (Figure 4).
The length–frequency relationship for total fish of Platycephalus indicus.
Monthly length–frequency of Platycephalus indicus (male and female) from May–April, 2011–2012.
Sections of otoliths
Of the 279 specimens that were used for age determination, 28 were excluded from analysis due to disagreement between the three readers. For the other otoliths, both clear dark opaque and bright translucent zones were observed (Figure 5). The readings showed eight age-classes from 0+ to 7 + yr. A new opaque zone found on the otolith of a fish sampled in January was also observed in January and February for two to three opaque zones, and in January to December for four to seven opaque zones.
Photographs of sectioned left sagitta: (A) 1 + yr old male, 32 cm; (B) 2 yr old male, 32 cm; (C) 3 + yr old female, 33 cm; (D) 4 + yr old male, 39 cm; (E) 4 + yr old female, 38 cm; (F) 6 yr old female, 41–42 cm.
Growth in length
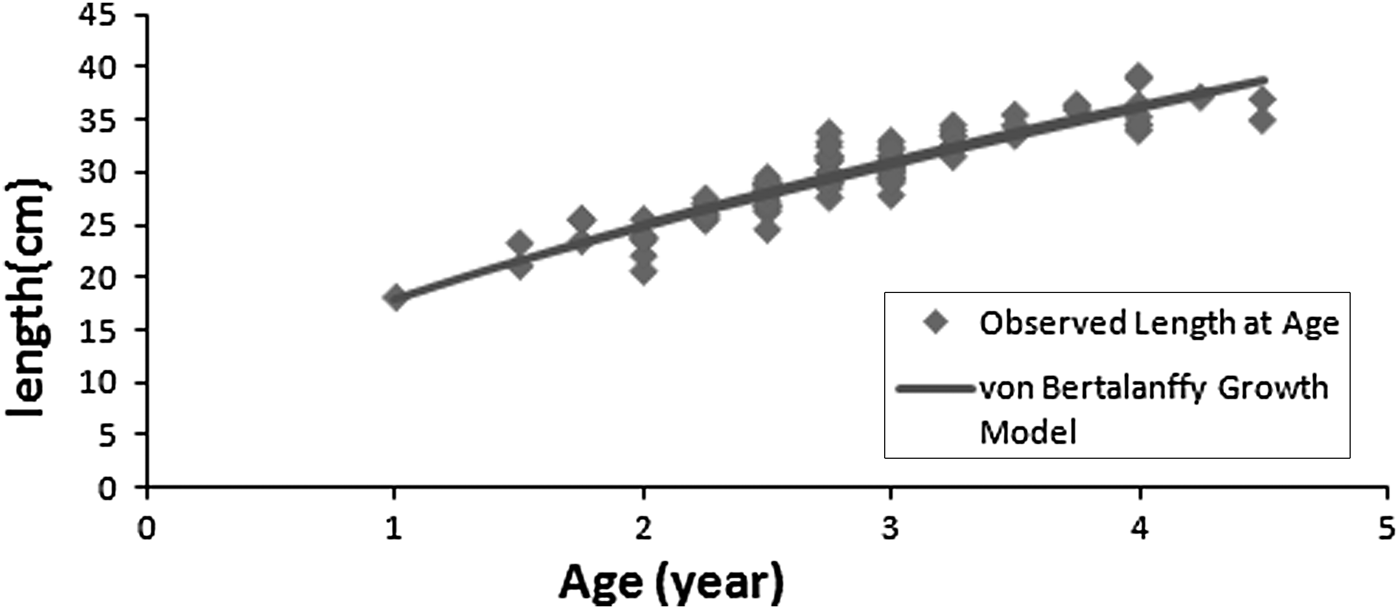
The model lengths corresponding to the various ages for males and females of P. indicus are given in Table 1. The results showed that females had a higher growth rate than males (Figure 6).
Von Bertalanffy growth curves fitted to length at age data derived from the sagittal otoliths of female and male Platycephalus indicus.
Summary of the growth parameter estimates of Platycephalus indicus made by Masuda et al. (Reference Masuda, Ozawa, Onoue and Hamada2000) and the present study.
Growth parameters
The values obtained for K were 0.46 for males and 0.49 for females, while L∞ = 43.40 cm is (males) and 63 cm (females). The results show that K for females was higher than that for males, which indicates a faster decrease in the growth rates of females.
Estimation of T0
The estimated values of t0 were −0.30 for females and −0.328 for males.
von Bertallanfy
For males,
 $${\rm Lt} = 43.40 \, \, \lcub 1 - {\rm exp}\, \lsqb\! -\!0.45 \, \lpar {\rm t} + 0.328\rpar \rsqb \rcub \semicolon$$
for females,
 $${\rm Lt} = 63 \, \, \lcub 1 - {\rm exp}\, \lsqb \!-\!0.50 \, \lpar {\rm t} + 0.30\rpar \rsqb \rcub .$$
Total mortality coefficient, Z
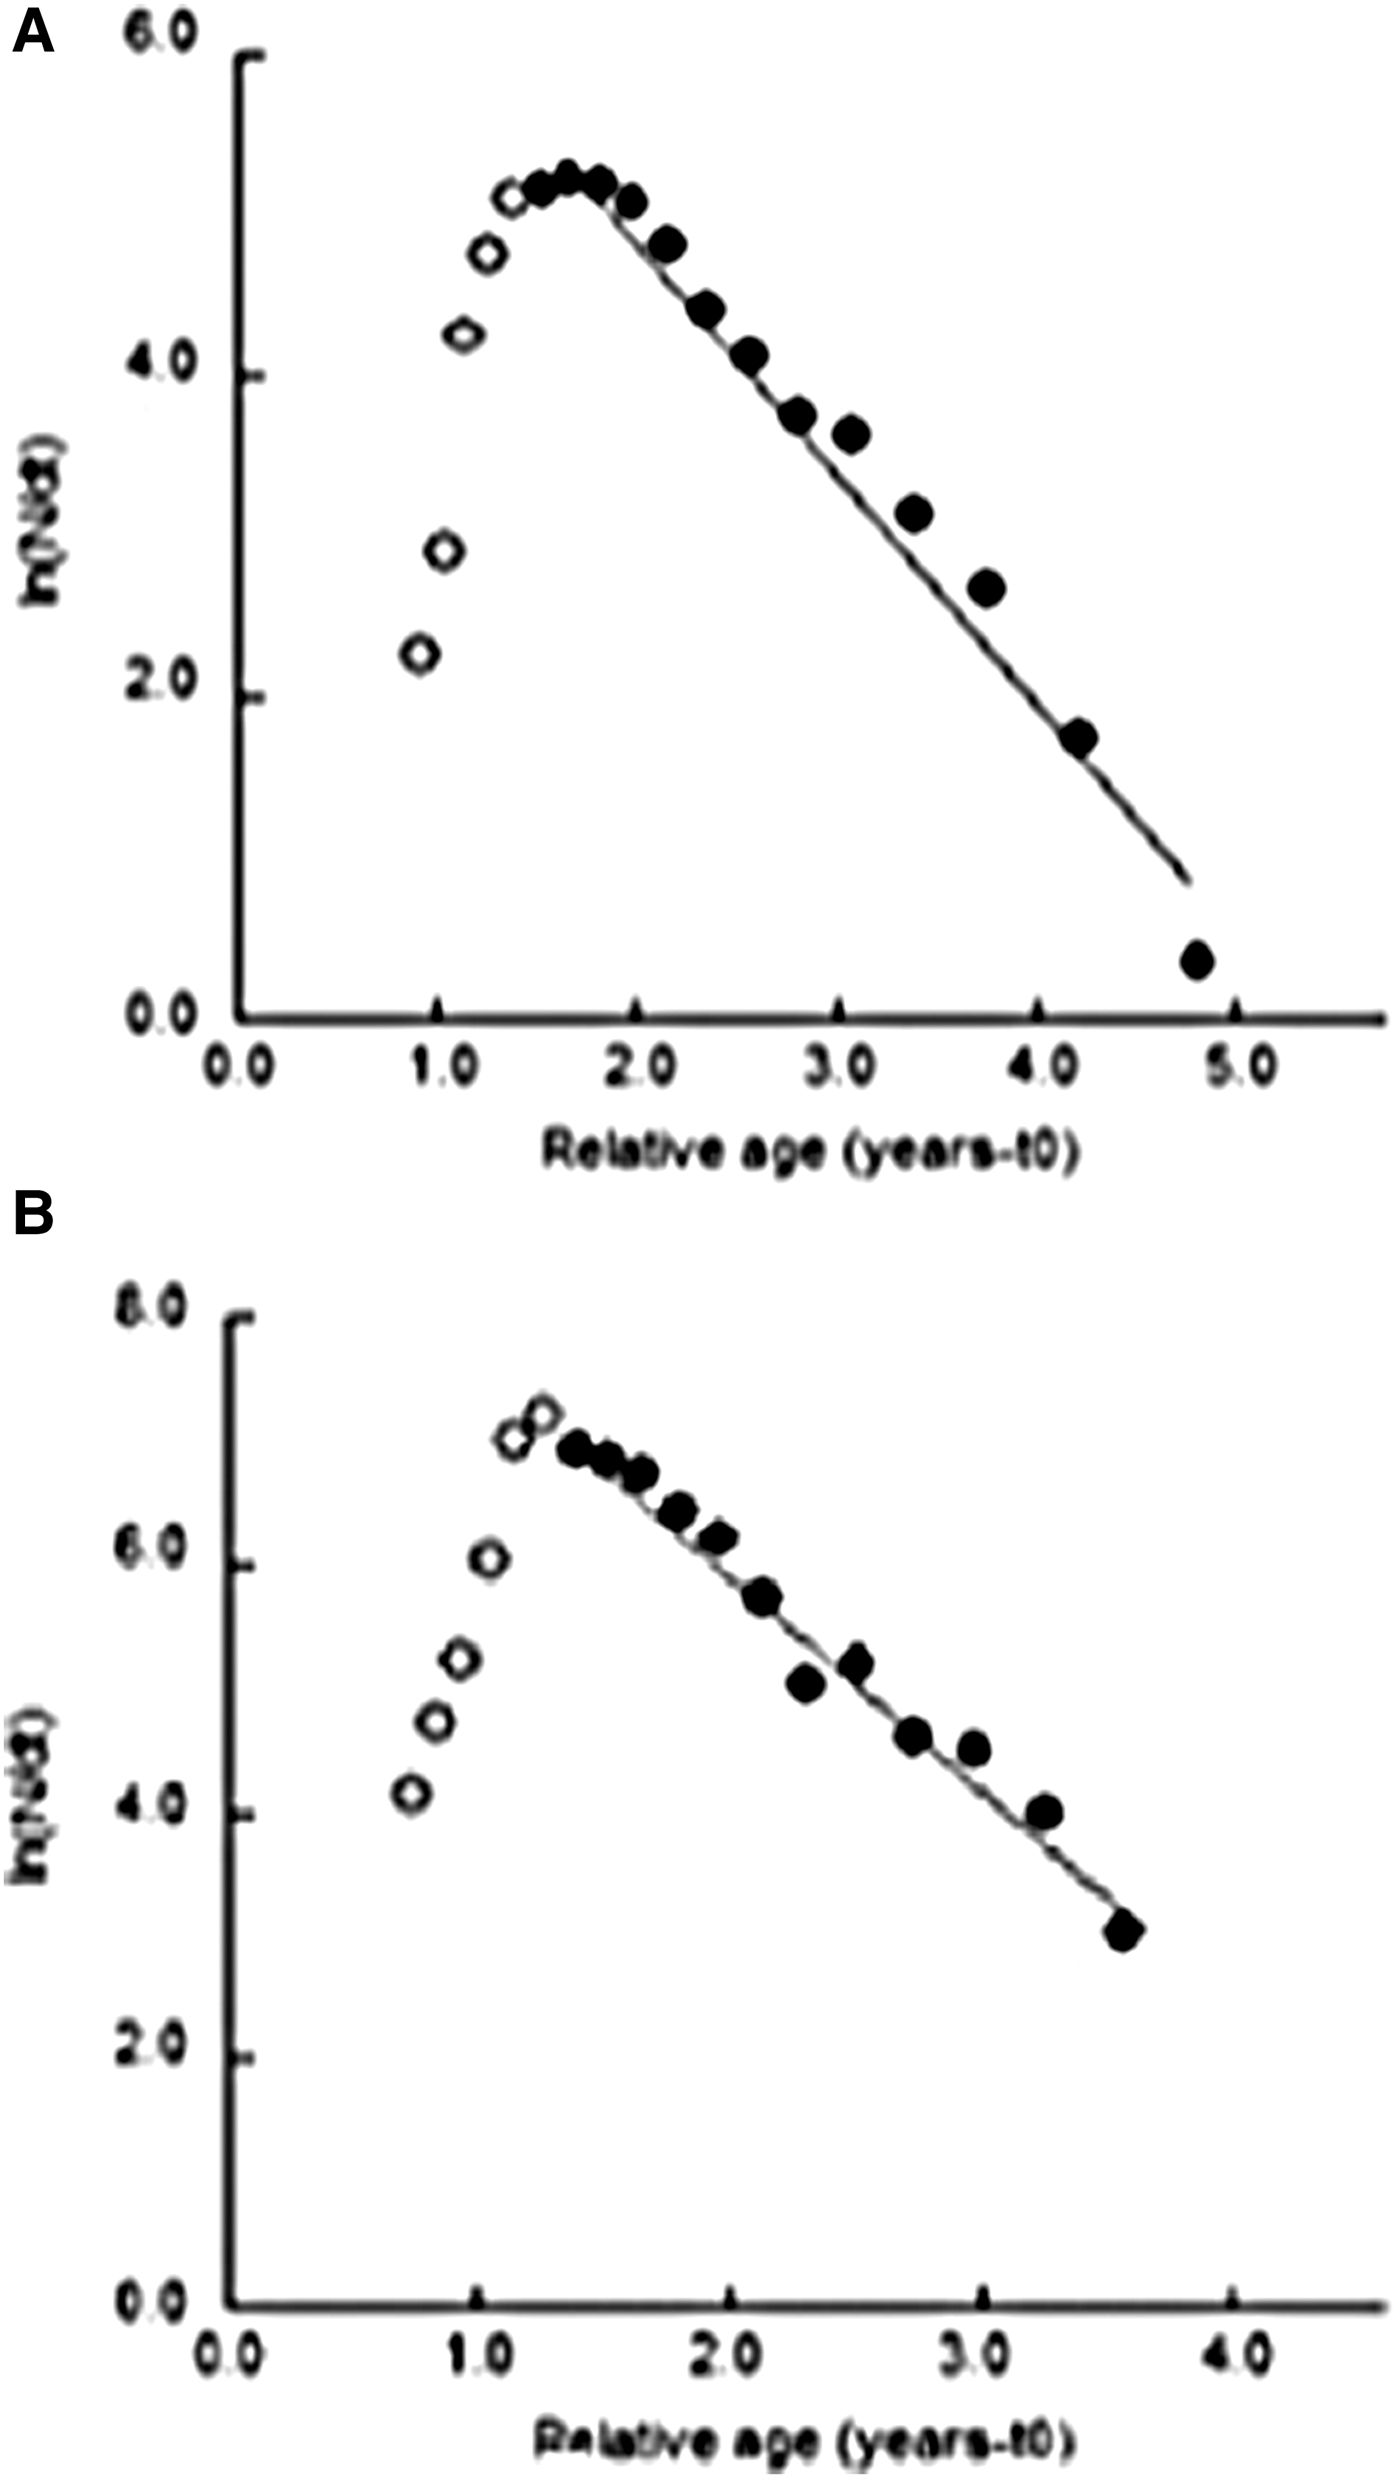
The total mortality rate was estimated using the length converted catch curve (Pauly, Reference Pauly1983) and the estimated Z value was 1.43 yr−1, CI: 1.27–1.59 for females (Figure 7A) and 1.62 year−1, CI: 0.87–2.59 for males (Figure 7B).
Estimation of total mortality coefficient Z of Platycephalus indicus from the Persian Gulf for: (A) females; (B) males.
The von Bertalanffy growth parameters and the mean annual water temperature of the Persian Gulf (T = 26.5°C) were used in Pauly's empirical equation (Reference Pauly1980), and the resultant estimates of natural mortality were M = 0.886 yr−1 for females and 0.736 yr−1 for males.
Fishing mortality coefficient, F
Using the relationship Z = M + F, the values obtained for F were 0.544 for females and 0.884 for males. Also, the results indicated the target (Fopt = 0.443) and limit (Flimi = 0.5847) biological reference for females as well as the target (Fopt = 0.368) and limit (Flimi = 0.4858) for males.
Estimation of Φ
The estimated values of Φ were 3.295 for females and 2.938 for males.
Exploitation rate
The rate of exploitation (E) was estimated at 0.54 for males and 0.38 for females.
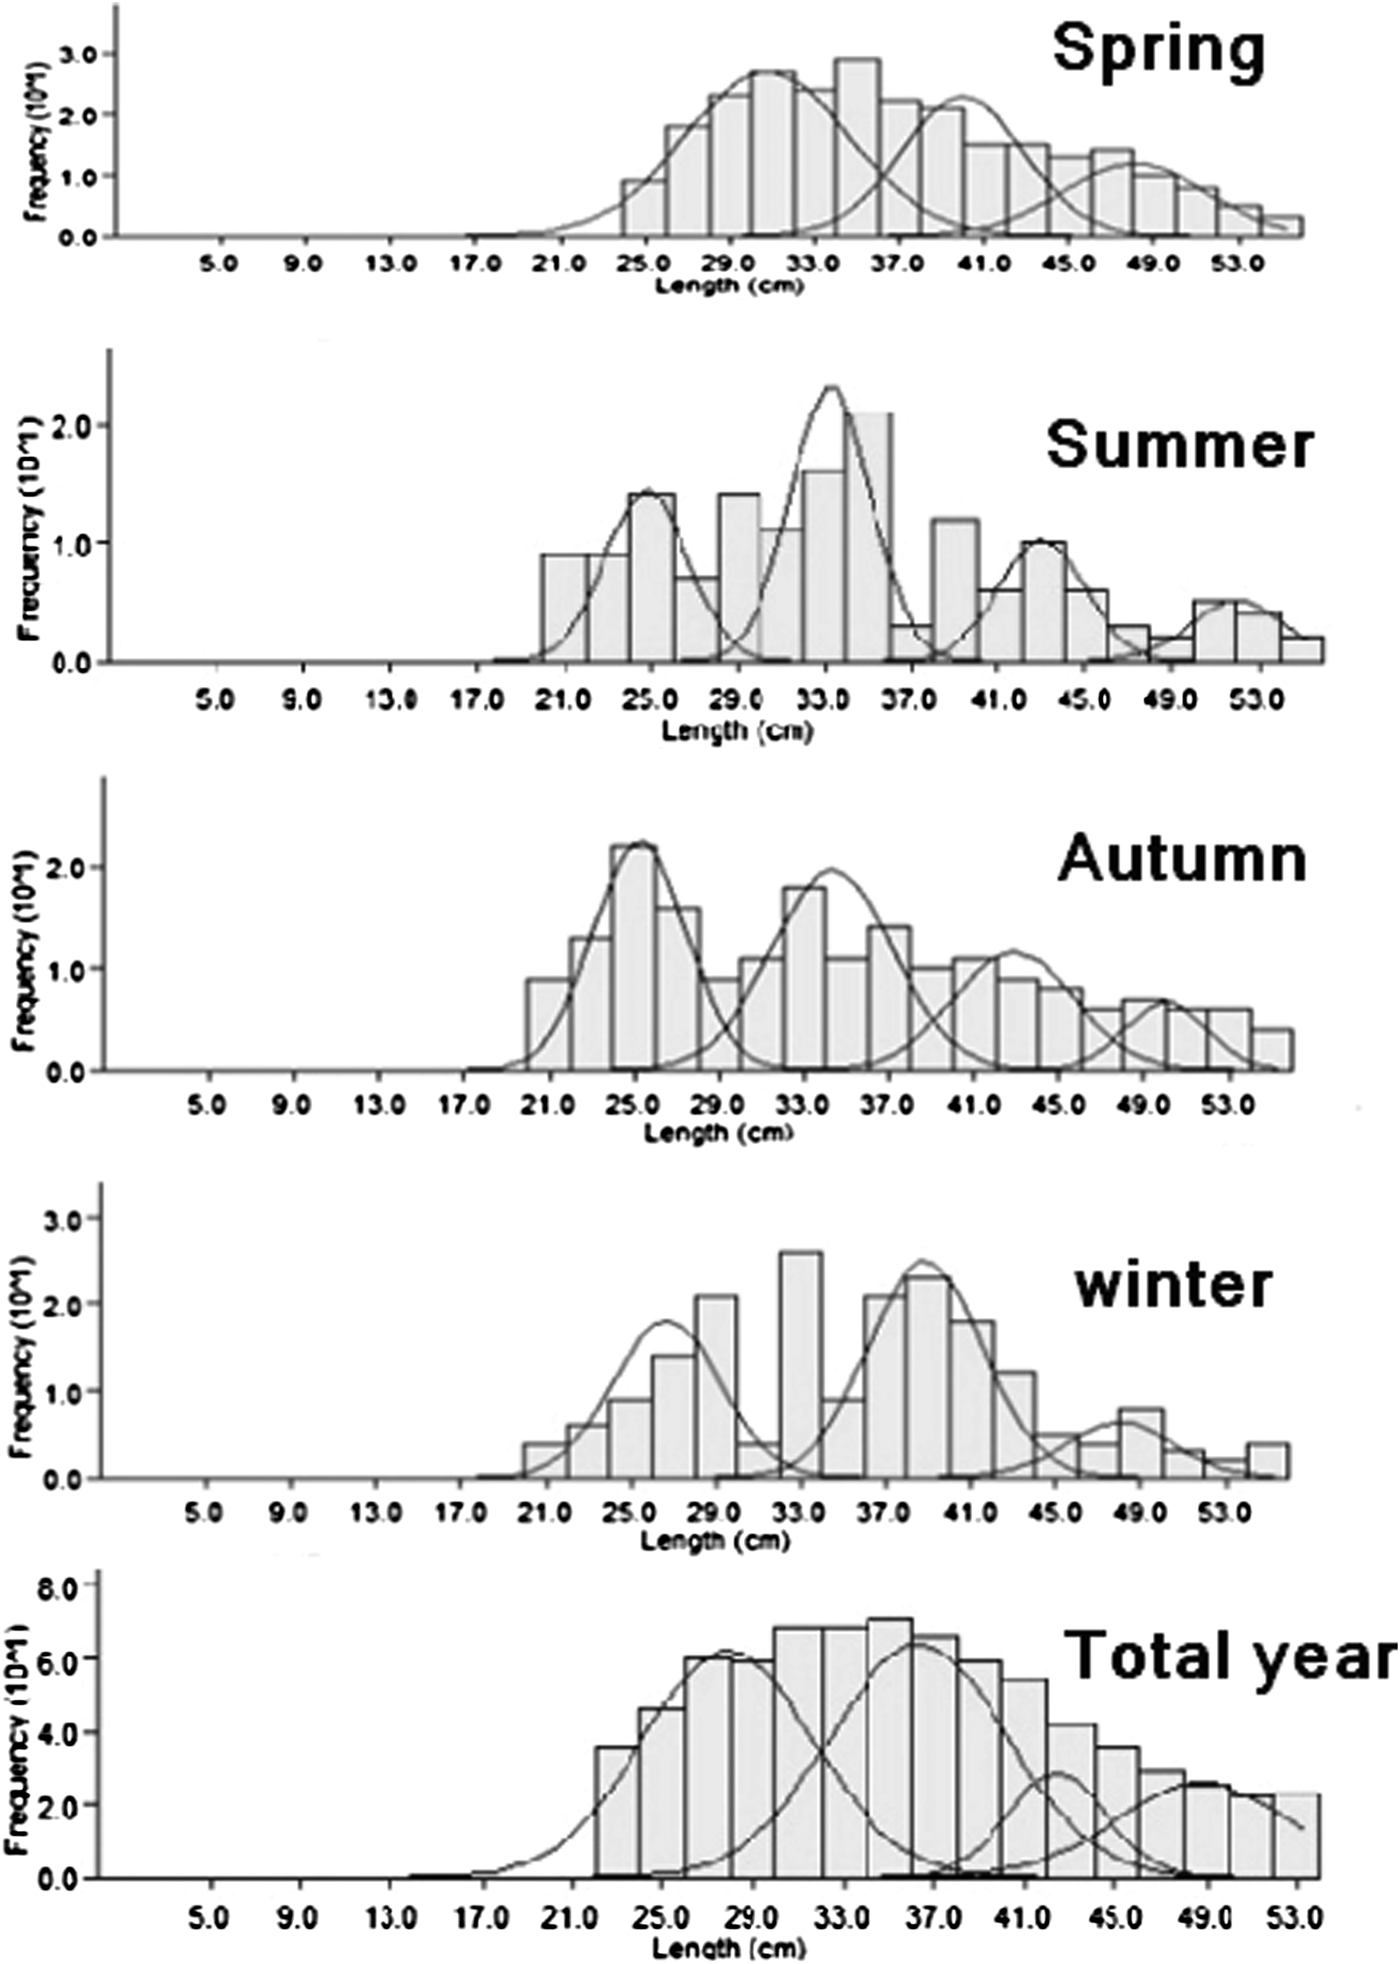
Composite distributions of the pooled length–frequency composition of Platycephalus indicus identified by the Bhattacharya (Reference Bhattacharya1967) method.
Length-converted catch curve shown in Figure 9; the method derived by Pauly (Reference Pauly1984) has been found to provide reasonable estimates of mean size at first capture (Lc = 26.62 cm). The probability of capture of P. indicus (2012 data) was estimated from the ascending arm of the catch curve. The length at first capture (L50 = 26.692 cm, L25 = 24.33 cm, L75 = 28.68 cm).
Probability of capture curves of Platycephalus indicus (for females) from the Persian Gulf.
Spawning season
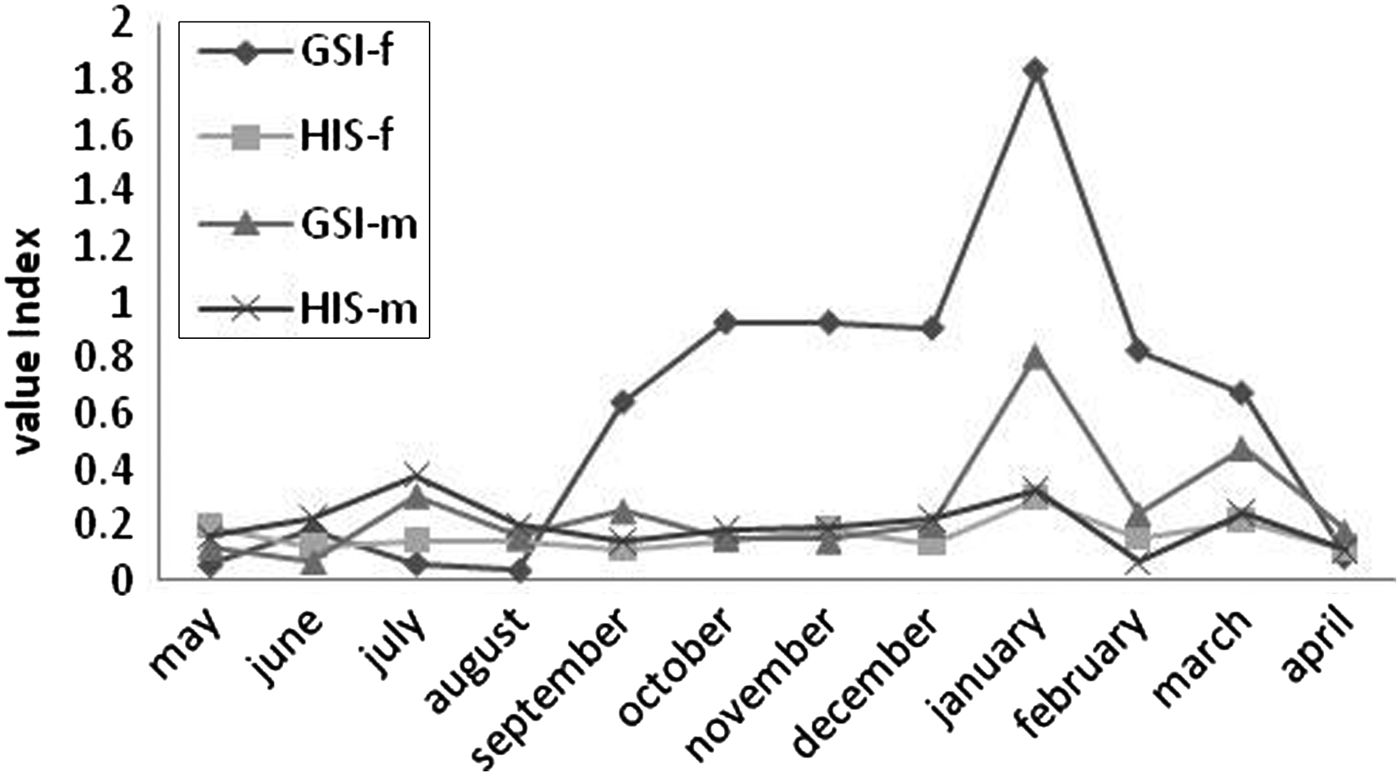
The highest values of the GSI for male and female P. indicus were 2.55 ± 0.80 and 6.28 ± 1.83, respectively. Observed in January, the lowest values for males and females were 0.12 ± 0.06 and 0.43 ± 0.05, respectively. Observed in May (Figure 10), the mean values in the GSI for males and females were 0.82 ± 0.25 and 2.48 ± 0.59, respectively, each year.
Monthly variations of mean gonadosomatic index (GSI) and mean hepatosomatic index (HSI) (male and female) of Platycephalus indicus.
Figure 10 shows the monthly changes in the mean GSI for males and females. High GSIs were observed from December to March for both males and females with peaks in January. Testis occupied about 5.41% of somatic weight on average during peak spawning, and ovaries approximately 8.67%.
DISCUSSION
This research is the first to study the demographic parameters of age, growth, mortality, gonadosomatic index (GSI) and hepatosomatic index (HSI) of the flathead, Platycephalus indicus, from the coastal waters of the Persian Gulf around Bandar Abbas, Iran. The findings in this study were similar to the studies of Roff (Reference Roff1983), Bawazeer (Reference Bawazeer1989) and Masuda et al. (Reference Masuda, Ozawa, Onoue and Hamada2000), which found that female P. indicus were larger than males at any age. In fish, fecundity generally increases with fish size, and so the larger size in females may be considered as a life history strategy for supporting increased egg production (Masuda et al., 2000).
Sectioned otoliths were used in the present study for age determination. The previous studies suggested that the first opaque zone on otoliths formed approximately one year after birth in P. indicus (Masuda et al., Reference Masuda, Ozawa, Onoue and Hamada2000).
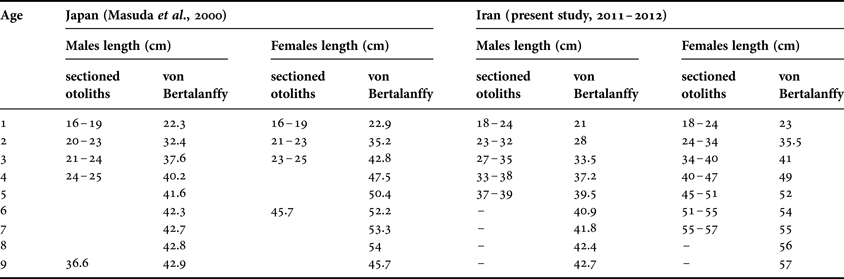
The eighth annuli could be distinguished in the sectioned otoliths representing age-classes from 0 to 7. Beckman & Wilson (Reference Beckman, Wilson, Secor, Dean and Campana1995) reported that the formation of opaque zones on otoliths can be attributed to various factors, such as seasonal temperature, wet and dry seasons, feeding and reproductive cycles. The ring formation of P. indicus was found during the spawning period between January and March. The growth parameters reported by Bawazeer (Reference Bawazeer1989) for P. indicus were often similar to what was found in this study, while growth parameters for P. indicus reported by Masuda et al. (Reference Masuda, Ozawa, Onoue and Hamada2000) were opposite to what was found in this study (Table 2).
Estimated age and total length (cm) of Platycephalus indicus by Masuda et al. (Reference Masuda, Ozawa, Onoue and Hamada2000) and the present study.
Bawazeer (Reference Bawazeer1989) used the sectioned otolith method and reported the maximum age observed in waters off Kuwait was 6 yr for males and 7 yr for females. Masuda et al. (Reference Masuda, Ozawa, Onoue and Hamada2000) used the sectioned otolith method and reported a maximum age of the P. indicus found in the coastal waters off west Kyushu, Japan as 16 yr for females and 11 yr for males. In the present study, we observed a maximum age of 7 yr for females and 4 yr males. The ‘b’ value in the weight–length model was 3.32 for total specimens of this species in Kuwaiti waters (Bawazeer, Reference Bawazeer1989). According to Martin (Reference Martine1949), the range of ‘b’ could be from 2.5 to 4, and Tesch (Reference Tesch and Ricker1968) believed ‘b’ = 3 in fish with isometric growth (Martine, Reference Martine1949; Tesch, Reference Tesch and Ricker1968). The ‘b’ values in the weight–length model were more than 3 for P. indicus fish, indicating that weight increased isometrically with length in this study.
The estimated growth parameter, K, obtained for males was K = 0.46 yr−1, and for females K = 0.50 yr−1. Masuda et al. (Reference Masuda, Ozawa, Onoue and Hamada2000) recorded K = 0.667 yr−1 for males and K = 0.478 yr−1 for females for P. indicus found off the coastal waters of west Kyushu, Japan. Thus, the parameter, K, for males in this study is lower than that reported by Masuda et al. (Reference Masuda, Ozawa, Onoue and Hamada2000). The K values in each of the two studies were similar for females.
The value of Ф' was estimated at 3.295 for females and 3.285 for males. A method of validating growth parameters involved the comparison of growth performance indices (Φ') in terms of growth in length with other estimates obtained for the same or similar species (Gayanilo & Pauly, Reference Gayanilo and Pauly1997).
Age at zero length (t0) was calculated at −0.30 for females and −0.328 for males. With negative t0 values, juveniles grew more quickly than the predicted growth curve for adults, and with positive t0 values, juveniles grew more slowly (Sparre & Venema, Reference Sparre and Venema1998).
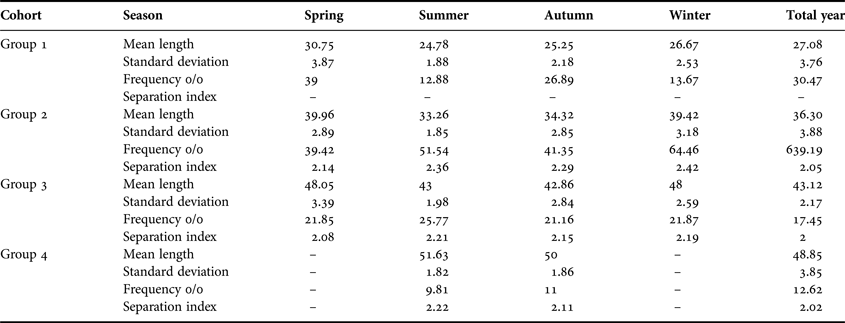
The pooled length–frequency distributions were analysed by the Bhattacharya (Reference Bhattacharya1967) method as incorporated in the FiSAT software (Figure 8; Table 3). Four components could be identified that were considered as distinct age groups with mean model lengths of 27.08, 36.3, 43.12 and 48.85 cm.
Data cohort of the Platycephalus indicus identified by the Bhattacharya (Reference Bhattacharya1967) method (2011–2012, Iran).
The mean values of the HSI were 0.89 ± 0.20 for males and 1.28 ± 0.16 for females. The highest HSI values were observed in January, and the lowest were in April. The GSI and HSI results of the present study showed that P. indicus needs protection during the spawning period from December to March, which could help in the management of its stocks. Therefore, the spawning time of P. indicus during December to March is supported by the data from the coastal waters of south Iran. Meanwhile, Vander Elst & Adkin (Reference Van Der Elst and Adkin1991) reported that the spawning time of bartail flathead occurred during July to November in southern African waters, and Masuda et al. (Reference Masuda, Ozawa, Onoue and Hamada2000) reported high GSI of P. indicus individuals in the coastal waters of Japan from April to August with peaks in June for both sexes.
ACKNOWLEDGEMENTS
We would like to thank Mr Dehghani and Mr Darvishi of the Persian Gulf and Oman Sea Ecological Research Institute for helping with the work of this project.