


“Peak associations frequently lack the unity needed to have any great influence on public policy, or even coherent and specific policies.”
—Olson (Reference Olson1982, 50)“The central social democratic policy. . .was the policy of wage compression attained through highly centralized wage-setting institutions.”
—Moene and Wallerstein (Reference Moene, Wallerstein, Gintis and Wallerstein2006, 148)Encompassing labor movements and coordinated wage setting are central to the social democratic economic model that has proven so successful among the nations of Western Europe. The coordination of wage bargaining across multiple unions and employers is the linchpin of theories purporting to explain everything from price levels to inequality to unemployment. It is at the core of current theories of political control of the economy and the New Keynesian macroeconomics (Iversen and Soskice Reference Iversen and Soskice2006). Furthermore, where labor unions represent a large portion of the workforce (and therefore the electorate), proportional electoral institutions are more common (Boix Reference Boix1999; Cusak, Iversen, and Soskice Reference Cusak, Iversen and Soskice2007), Left and Social Democratic parties more frequently in government (Stephens Reference Stephens1979; Korpi Reference Korpi1983; Western Reference Western1997), social spending greater, and redistribution more profound (Bradley et al. Reference Bradley, Huber, Moller, Nielsen and Stephens2003; Lee and Roemer Reference Lee and Roemer2005). The organization of labor interests—filtered through partisan politics and economic institutions such as the central bank—has an influence on economic outcomes from wage dispersion (Wallerstein Reference Wallerstein1990, Reference Wallerstein1999; Rueda Reference Rueda2008) to unemployment and inflation (Calmfors and Driffill Reference Calmfors and Driffill1988; Alvarez, Garrett, and Lange Reference Alvarez, Garrett and Lange1991; Garrett Reference Garrett1998; Iversen Reference Iversen1999; Nickell and Layard Reference Nickell, Layard, Ashenfelter and Card1999). Although the robustness and magnitude of these relationships as well as the directionality of causation are contested (Flanagan Reference Flanagan1999; Golden and Londregan Reference Golden and Londregan2006), there is broad consensus on the negative relationship between union centralization and wage dispersion. More coordinated bargaining is strongly associated with greater wage and disposable income equality.Footnote 1
Coordinated bargaining requires that there be peak associations of labor and capital capable of acting as strategic bargaining agents, i.e., possessing what Iversen (Reference Iversen1999) calls “strategic capacity.” Yet there has been limited theoretical work accounting for variation in labor movements' organizational centralization. None of the existing thinking on union coordination takes seriously the internal politics of union federations as they relate not just to coordinated bargaining but to large-scale cooperative union activities more generally. This lack of theoretical progress reflects the gap between our models of current institutional arrangements and historical studies of their social preconditions. It runs counter to the strong current of endogenous institutions that has been pushing theoretical innovation in political economy over the last decade and a half.
Quantitative empirical work examining the underpinnings of bargaining coordination and union organizational structure is surprisingly sparse, notwithstanding the release of several major datasets on the subject. Most of the empirical literature consists of case studies or work describing variation in newly gathered data.
This paper addresses both the theoretical and empirical shortcomings. But rather than modeling bargaining coordination directly, I consider how a federation of independent unions might develop strategic capacity. Taking a cue from the federalism literature, I provide a theoretical model of confederal organizations focusing on the conditions under which affiliates will cede resources and authority to the confederation. To summarize the results: given some set of unions and some activity over which they can combine resources for mutual gain, there generally exists some subset that will be willing to work together. The size of this subset and the amount affiliates contribute to the cooperative enterprise depends on the returns to cooperation, the heterogeneity of endowments, and the manner in which they take their decision, i.e., the identity of the pivotal voter. Unions better able to achieve their goals on their own are the most difficult to entice into the cooperative arrangement. To induce these more productive agents to contribute to the cooperative project, the group will need to allocate decision rights such that these more powerful agents have a disproportionate influence over group decision-making. The model predicts that where unions vary widely in their resources, confederations will be weaker and/or more unions will remain outside the confederal organization.
I use the model to explore the bargaining coordination problem. I assume that membership is a union's fundamental resource and calculate the inequality of membership across unions for a panel of 15 OECD countries, 1950–2000. I find that centralized control over strike funds is less likely where membership is more unequally distributed across affiliated unions once we account for other plausible relationships. I then consider to what extent centralized strike funds have any bearing on coordinated wage bargaining. I find that countries with more powerful union and employer federations are, in turn, more likely to have more highly coordinated wage bargaining. Furthermore, I show that variables others claim affect bargaining levels only influence coordinated wage bargaining via their relationships with union centralization. Once the degree of centralized union strike powers is accounted for, these other variables show little in the way of discernable direct relationships with bargaining coordination.
With union membership coming under pressure in a number of countries and employer coordination playing an increasingly important role in theories of economic management (Hall and Soskice Reference Hall and Soskice2001), scholarly attention has shifted away from labor to firms (Mares Reference Mares2003; Martin and Swank Reference Martin and Swank2004, Reference Martin and Swank2008). Although the findings here complement this line of inquiry, I seek to refocus attention on the political relations among workers' organizations. My findings imply that historical preconditions, industrial structure, and laws governing union recognition play a strong role in laying the foundation for more or less powerful union federations. They also provide a way to backward integrate our models of the macro political economy into recent work examining the historical social foundations for coordinated market governance (Thelen Reference Thelen2004; Iversen and Soskice Reference Iversen and Soskice2009).
The next section briefly reviews work on the origins of centralized wage bargaining. The next section presents the basic theoretical model. Readers preferring a nontechnical discussion of the model should skip directly to the end. The following section presents empirical findings and the final section summarizes and concludes with observations about future research directions. I collect proofs and details about the data in the appendices.
LABOR MOVEMENT CENTRALIZATION AND COORDINATED WAGE BARGAINING
Nowhere are federations of labor unions of more explicit importance than in models of wage/price bargaining and political control of the macroeconomy. Building on arguments about encompassing groups (Olson Reference Olson1971, Reference Olson1982), the well-developed literature on the consequences of bargaining centralization attempts to link the ability of unions and employers to coordinate wage bargaining at the national level with unemployment and inflation outcomes (Lehmbruch Reference Lehmbruch, Schmitter and Lehmbruch1979; Schmitter Reference Schmitter, Schmitter and Lehmbruch1979; Cameron Reference Cameron and Goldthorpe1984; Lange Reference Lange and Goldthorpe1984; Calmfors and Driffill Reference Calmfors and Driffill1988; Alvarez, Garrett, and Lange Reference Alvarez, Garrett and Lange1991; Iversen Reference Iversen1999; Franzese Reference Franzese, Hall and Soskice2001; Adolph Reference Adolph2006). The argument goes more or less as follows: In densely unionized economies, unions in aggregate can affect the evolution of nominal wages economywide. In making its wage settlements with employers, each union considers the unemployment costs of its wage demands on its members, disregarding the spillovers that its wage-employment settlement might have for other workers in other unions.Footnote 2 Furthermore, because each union's wage demands affect producer and, ultimately, consumer prices, nominal wage gains will be inflated away, yielding unchanged real wages but imposing higher inflation and unemployment. Coordinated bargaining involves aggregating workers across firms, industries, sectors, or even the entire economy into larger bargaining units. The bargains struck at the peak level set the parameters for any additional lower-level bargaining. Highly coordinated bargaining, it is argued, will generate the “public good” of wage restraint, with the attendant benefits of low unemployment and inflation with the same (average) real wages as under decentralized bargaining.Footnote 3.
Real wage restraint in centralized bargaining often focuses on the highest-wage unions through an explicit policy of “solidaristic bargaining.” Even in the absence of an official solidaristic bargaining stance, however, centralized bargaining generates a distributive tension. Centralized bargaining flattens the wage distribution, both by increasing wages for those at the bottom and by restraining wage growth for those at the top (Wallerstein Reference Wallerstein1990, Reference Wallerstein1999). This then poses a puzzle: what induces high-wage workers to go along with a centralized arrangement in the first place?
Early attempts to answer the question viewed centralized bargaining as a standard collective action problem (Olson Reference Olson1982; Cameron Reference Cameron and Goldthorpe1984; Lange Reference Lange and Goldthorpe1984). To overcome this problem, the neocorporatist literature of the 1970–1980s argued that centralized unions must be compulsory and union leaders must be “insulated” from rank-and-file wage demands. In this traditional view of the labor peak associations (at least in highly unionized economies), the role of the federation is explicitly antidemocratic in the sense that leaders are meant to be a conservatizing influence on the presumably more radical, strike-prone rank and file.Footnote 4
Nevertheless, few countries, even among the most centralized, have mandatory union membership; government-granted bargaining monopolies only exist in a handful of cases. Noting this, current theories of wage bargaining have looked away from the state-imposed arrangements explicitly or implicitly driving the earlier arguments. In a fascinating paper, Agell and Lommerud (Reference Agell and Lommerud1992) argue that wage compression might actually provide a justification for centralized bargaining. They provide a model in which centralized wage bargaining provides income insurance to workers who are ex ante uncertain as to whether they will be “skilled” or “unskilled” once the labor market opens under the (very plausible) assumption that insurance markets for human capital are missing. This model, however, fails to account for all but the most extreme levels of union coordination. Freeman and Gibbons (Reference Freeman, Gibbons, Freeman and Katz1995) provide a different model of centralized bargaining. They rely on informational asymmetries between local bargaining agents and the central confederations to highlight the reasons for wage drift and the restrictions on lower-level bargaining that may cause centralized bargaining to break down. When the bargaining groups become more heterogenous or the value of wage restraint declines, centralized bargaining becomes less likely. Separately, other theorists have relied on the active support—indeed, insistence via coordinated lockouts—of employers in the tradeables sector (Katzenstein Reference Katzenstein1985; Wallerstein Reference Wallerstein1985; Swenson Reference Swenson1989, Reference Swenson1991; Iversen Reference Iversen1999). These authors argue that export-oriented and import-competing employers cannot pass along increased wage costs to consumers; they support centralized bargaining to rein in the wage demands of workers in the nontradable sectors. But this just kicks the can a little further down the road; it begs the question of why employers were able to coordinate. What's more, the employers' lockout weapon was so potent in Sweden because the union federations had already acquired an obligation to support locked out affiliates by dipping into their central strike funds. The AFL-CIO, in contrast, has never been able to develop a strike fund, despite repeated attempts early on.
In general, then, there has been relatively little work attempting to explain how unions might (endogenously) develop the capacity to coordinate and make strategic group decisions. That said, there are several insights I take from prior work. First, even if there exists some mechanism to solve the free rider problem, the distributional conflict between unions can be even more serious. Second, information and uncertainty can provide a fundamental justification for the existence of a multitiered organization. Third, the role of external actors such as employers and governments can affect the willingness and/or ability of union federations to centralize decisions in certain policy domains.
The empirical literature to date has primarily relied on case studies of a handful of northern European nations, most commonly Denmark, Germany, and Sweden.Footnote 5 Rigorous historiography has generated important insights into the role of employers and the dynamics of institutional change (Swenson Reference Swenson1991; Thelen Reference Thelen1993, Reference Thelen2004; Iversen Reference Iversen1996), but these insights have not been examined in a broader spatial-temporal context. Ebbinghaus and Visser (Reference Ebbinghaus and Visser2000), Traxler, Kittel, and Blaschke (Reference Traxler, Kittel and Blaschke2001), Golden, Wallerstein, and Lange (Reference Golden, Wallerstein and Lange2009), and Visser (Reference Visser2009) have invested terrific effort in providing broadly comparable time series data on unions, employers, and government involvement in wage bargaining and economic management for the major OECD economies, leading to important work describing the variation in union centralization and bargaining coordination (Golden, Wallerstein, and Lange Reference Golden, Wallerstein, Lange, Kitschelt, Lange, Marks and Stephens1999; Ebbinghaus and Visser Reference Ebbinghaus and Visser2000; Traxler, Kittel, and Blaschke Reference Traxler, Kittel and Blaschke2001). Kenworthy (Reference Kenworthy2001, Reference Kenworthy2003) offers surveys of the many datasets floating around purporting to offer empirical measures “corporatism”, bargaining centralization, union structure, and associated concepts. Nevertheless, these measures of centralization and coordination almost always appear on the right-hand side of regression equations.Footnote 6 To my knowledge, the only places where something akin to union centralization or wage bargaining coordination has been analyzed in any depth are Marks (Reference Marks1986), Western (Reference Western1997), and Wallerstein and Western (Reference Agell2000). The first presents rank correlations, whereas the other two use union and employer centralization to explain the level of wage bargaining (firm-level, industry, or economywide). Wallerstein and Western (Reference Wallerstein and Western2000) find that more centralized employer peak associations are associated with centralized wage bargaining, whereas concentration of unionists in a relatively small number of unions negatively affects the level of wage bargaining. But these findings can be criticized on a number of grounds. First, bargaining coordination rather than level is generally held to be more important, as Wallerstein and Western recognize. Second, they do not account for the authority of union peak associations, a central concern of this paper. Third, their measure of concentration (a Herfindahl index, discussed below) is difficult to interpret when the number of affiliates varies over time and across countries.
THEORETICAL MODEL
I look to insights from the federalism literature to gain theoretical traction. Authors in this literature have developed several models attempting to explain the existence, allocations of authority, policy outcomes, and welfare implications of federally organized states. The model I propose here is similar to that analyzed by Alesina, Angeloni, and Etro (Reference Alesina, Angeloni and Etro2005) and Hafer and Landa (Reference Hafer and Landa2007).
There is a set of N agents—independent unions in this application. Each union i has a fixed endowment, r i ≥ 1, that it can allocate to two different tasks. The first generates purely local returns whereas the second has positive returns to scale; i.e., there are spillovers across unions and possible gains from cooperation.Footnote 7 I refer to the first activity as the local activity and the second as the confederal activity. Cooperative union activities can include protest marches, sympathy strikes, boycotts, political lobbying, organizing drives, get-out-the-vote campaigns, and coordinated wage bargaining.
Unions can join a confederation in which their contributions to the confederal activity are pooled; I refer to these unions as affiliates. Those remaining outside the confederation do not receive any of the benefits of group production.Footnote 8 Each union's utility is given byFootnote 9
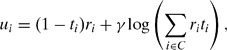
where t i ∈ [0, 1] is i's allocation to the confederal activity, γ is a known productivity factor, and C denotes the set of unions (along with i) in the confederation C. We can interpret γ as summarizing how valuable or productive confederal cooperation is.
The basic game is played as follows:
1. Each union decides if it wants to affiliate with a confederation.
2. Affiliated unions then decide on the common contribution level, i.e., t i = t ∀i ∈ C, according to some decision rule.Footnote 10 For the moment, the decision rule is taken to be exogenous.
3. Contributions are made and outcomes realized.
To focus on the distributive tension engendered by this setup, I assume that decisions on the common contribution level for affiliates are binding and enforceable; i.e., there is no collective action problem.
I begin by defining each union's outside option. On its own, i.e., when C = {i} ∀i, each union picks t i to maximize (1). The first-order condition necessary and sufficient for a maximum defines the union's optimal t i as
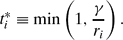
It is clear that t i* is (weakly) decreasing in r i, implying that, for fixed C, (1) unions' preferences are single-peaked around t i* and (2) unions can be ordered by r i. This, in turn, implies that the median voter theorem holds for voting games over common t. Substituting t*i, an agent's utility for remaining outside the federation is
![\[ u_i^{out} = u_i(t_i^* \mid i \notin C) =\left\{\begin{array}{@{}l@{\quad}l@{}} r_i + \gamma(-1 + \log\gamma) & \gamma < r_i \\[6pt] \gamma \log r_i & \gamma \geq r_i. \end{array} \right.](https://static.cambridge.org/binary/version/id/urn:cambridge.org:id:binary:20151024011347028-0479:S0003055409990384_eqnU1.gif?pub-status=live)
It will also be useful to define the total endowment of unions affiliated to a confederation with membership C as

The game will be solved by backward induction. Because unions can be ordered by r i, we can define the α-decision rule to be one in which the αth quantile of the affiliates is the pivotal voter; if α=0.5 then the median affiliate is decisive.Footnote 11 At the voting stage, affiliates vote for their most preferred t. Let t α denote the winning t under decision rule α and let C α be the confederation with decision rule α.
Define the utility of an affiliate to confederation C α as

Then an agent's net utility of joining a C α confederation is Δu i = u ini − u iout. More precisely, letting r α be the affiliate such that quantile (r i) = α,
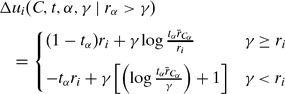
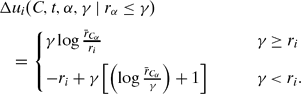
Lemmata 1 and 2 follow directly from the comparative statics of Δu i:
lemma 1. If r α, r i > γ and r i/r α > 1 + logr Cα − logr α then Δu iis decreasing in γ. Otherwise Δu iis weakly increasing in γ.
Proof. See Appendix A.
Intuition would suggest that as the returns to the confederal activity increase, cooperation would automatically be more likely. Lemma 1 shows that this is not necessarily the case. If the difference between an agent's endowment and that of the decisive affiliate is greater than the difference between the mean and the decisive member's endowment, the attractiveness of the confederation is actually declining in the productivity of the confederal activity. Put another way, if, for fixed α, an agent (potentially) looms large in confederal production, the likelihood that this richest union will cooperate with the poorest declines as the confederal activity becomes more productive. The intuition here is reminiscent of the logic behind the Meltzer and Richard (Reference Meltzer and Richard1981) inequality and redistribution result. If the median affiliate is pivotal, i.e., α = 0.5, then the RHS of the antecedent is the (log) difference between the mean and median endowments. As γ increases (up to the point where γ = r α), the relatively poor affiliates want to “tax” more heavily for confederal activity. But the rich union is so big relative to the poorer ones that their contributions matter little to it and the rich union is less inclined to find affiliation profitable.
lemma 2. For fixed γ and assuming that an instantaneous change in r idoes not change the identity of the decisive affiliate, if γ ≤ r Cαthen Δu iis weakly decreasing in r ifor all i.
Proof. See Appendix A.
In words, the profitability of being an affiliate of a fixed confederation decreases the bigger the endowment, holding all other endowments fixed. An increase in an agent's endowment has two effects. It increases the amount of overall resources devoted to the confederal activity, but it also increases that union's relative contribution. This lemma says that the latter effect outweighs the former. Only when the returns to confederal activity are very high does net utility increase in the endowment.
Unions will join C α iff Δu i ≥ 0. If γ < r α, then we can substitute γ/r α for t α, yielding the following condition:
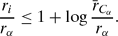
Whereas, if γ ≥ r α, then we substitute 1 for t α and get
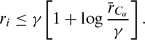
Note that both conditions always hold for all i such that r i ≤ r α. This follows directly from the insights of Lemma 2: all unions with endowments smaller than the decisive affiliate's endowment will find joining the confederation increasingly attractive, once again reinforcing the redistributive aspect of confederal organization.
Define an equilibrium confederation under decision rule α as one in which (1) Δu i ≥0 ∀i ∈ C α and (2) Δu i < 0 ∀i ∉ C α. We can also say that unions i and j have weakly contiguous endowments and hence weakly contiguous preferences if either (1) r i = r j or (2) r i ≶ r j and ∄ an agent k such that r i ≶ r k ≶ r j. I can now state the following proposition:
Proposition 1. For fixed α, γ there exists a unique equilibrium confederation composed of affiliates with contiguous preferences. The size of the confederation is weakly increasing in γ.
Proof. See Appendix A.
corollary 1. If γ > r maxthen all unions belong to the confederation and allocate all resources to the confederal activity.
There are two immediate implications. First, as the returns to the confederal activity increase (decrease), the size of the federation will increase (decrease). Combining Proposition 1 with Lemma 2, we have a second substantive claim: the more an agent's endowment exceeds that of the pivotal union, the less likely it is for that richer union to find it in its interest to join the confederation. Put differently, the more skewed the distribution of endowments, the less likely the best endowed or most productive unions will join a confederation. By submitting to the collective choice procedure inherent in a confederation, the weaker affiliates borrow strength from the stronger. If these differences in endowments are sufficiently large, the weaker unions will demand a contribution by the stronger beyond what the stronger finds profitable. The strongest unions foresee this and will refuse to join.
Whenever the equilibrium confederation falls short of full integration, there is a tension between the t α and the fact that the poorer affiliates would generally prefer that the better endowed unions outside the confederation join. Those remaining outside the federation see t α as too high a price to pay. Is there some lower contribution rate that would make confederal membership worthwhile for an agent outside the federation while not making any of the current members worse off? Formally, for some i ∈ N, Δu i(t α; C) < 0, but Δu i(t α′; C) ≥ 0 for some t α′ < t α, where C is the confederation including i. It must also be the case that for all j ∈ C −i, u j(t α′; C) ≥ u j(t α; C −i), where C −i is the confederation excluding i.
Proposition 2. Assuming γ < r max, given some i such that Δu i(t α; C) < 0, there exists some α′ > α such that Δu i(t α′; C) ≥ 0 and u j(t α′; C) ≥ u j(t α; C −i) ∀j ∈ C −iif and only if the following condition holds:

where t α′solves t α′r i = γ(1+ logt α′řC/γ).
Proof. See Appendix A.
Condition 7 describes the rationality constraint for those already in the confederation. If it were not met then j would be better off in the α-rule confederation without i even if i were made exactly indifferent toward affiliation (t α − t α′ is as small as possible). The size of the difference in endowments and γ govern the extent to which these conditions are met for different potential affiliates. Put another way, it is not clear that confederal rules will be changed to attract a bigger potential affiliate. If the concessions required to attract them are not outweighed by the net benefit to those already in the confederation, these larger unions end up outside the federation. If they are attracted into the federation, the proportion of resources ceded to the center must be lower than in the less encompassing federation.
In the model, unions are heterogeneous in the amount of resources they control. All, however, can benefit from cooperating with one another on some projects. Tension arises because the amount each union wants to contribute to the cooperative enterprise depends negatively on the union's resources; because of spillovers to some activities (such as organizing, political contributions, or wage bargaining), weaker unions prefer higher contribution levels and stronger unions prefer lower. The greater the difference between the preferred contribution of the pivotal affiliate and that of the strongest unions, the more this tension complicates interunion cooperation, and the less likely we are to observe confederations engaging in highly redistributive activities on a large scale. Proposition 1 shows that even in the absence of collective action problems, there is no guarantee that all unions will join together for cooperative activity. Distributional concerns can get in the way. Furthermore, when some unions do not affiliate with the confederation, it is the best endowed ones that remain alone. This has implications for the strategic capacity of “bottom up” federations. Where unions are unable to coalesce into one federation, it is likely that the most powerful will stand alone. Proposition 2 highlights the importance of the internal decision process in determining which unions will be part of the confederation and the extent of resource centralization. Whether a confederation can include all its potential members is driven by how internal organizational rules determine the pivotal affiliate. Where union resources are more unequally distributed, there is an increasingly stark trade-off between high contributions levels (centralization) and a governance structure that induces the best-endowed unions to affiliate.
When taking this theoretical proposition to the data, I have to make some assumptions. The first involves specifying the union's activities. Arguably the key function of a union is collective bargaining. A union's bargaining power is driven by its ability to effectively impose costs on employers, ultimately through strikes. Centralized control of strikes is possibly the most redistributive of confederal activities. Confederal-level strike powers can prevent unions capable of winning more immediate concessions on their own from doing so, usually in the name of price stability. Possessing centralized strike funds makes the confederation's strike veto power more meaningful, raises the costs of confederal secession for any one union, and gives the federal leadership leverage over affiliates that is most effective precisely when affiliates are most vulnerable. Yielding strike powers to a confederal organization is a key extension of the confederation's scope of activity. It tends to benefit weaker unions at the expense of the industrially strong.
The second assumption involves operationalizing union resources. I assume membership to be a union's fundamental resource;Footnote 12 i.e., r i represents i's membership. Thus where unionists are more unequally distributed across unions, it will be more difficult to entice the most powerful unions to join the confederation. If they do join, it is unlikely that highly redistributive powers will be ceded to the central organization. The empirical hypothesis I investigate is the more unequal the distribution of unionists across affiliated unions, the lower the likelihood that the union confederation controls strike funds.
EMPIRICAL ANALYSIS
The empirical analysis proceeds in two steps. First I focus on examining the hypothesis relating membership inequality to the likelihood that affiliates will cede major redistributive powers to the confederal organization. The dependent variable is the Golden–Wallerstein–Lange indicator of whether a country's largest union federation controls strike fund.Footnote 13 In the second step I see what leverage centralized strike powers give us in explaining coordinated wage bargaining. Whether unions (Windmuller Reference Windmuller and Lipsky1975; Schmitter Reference Schmitter, Schmitter and Lehmbruch1979; Olson Reference Olson1982; Lange Reference Lange and Goldthorpe1984) or employers (Swenson Reference Swenson1989, Reference Swenson1991; Wallerstein and Western Reference Wallerstein and Western2000), are emphasized, coordinated bargaining depends on the ability of peak associations to enforce discipline on their affiliates; i.e., there is a collective action problem. By assuming away collective action problems, the theoretical model demonstrates how distributional concerns affect the extent to which confederal organizations will be able to subsequently solve free rider problems. The centralization of union strike funds should, by all accounts, improve the prospects for coordinated wage bargaining. Until now this assertion has not been established empirically.
Data
I have pieced together an (unbalanced) panel time series of annual observations covering 1950–2000 for 15 OECD countries: Australia, Austria, Belgium, Canada, Denmark, Finland, Germany, Italy, Japan, the Netherlands, Norway, Sweden, Switzerland, the United Kingdom, and the United States. Data definitions and sources are collected in Appendix B. I draw heavily on the dataset constructed by Golden, Wallerstein, and Lange (Reference Golden, Wallerstein and Lange2009), henceforth GWL. Some of the variables used here are measured only intermittently, typically at five-year intervals. To maximize the number of country-years available, I linearly interpolate the intervening years but do not extrapolate past a country's last observed value or before its first.Footnote 14 Other instances of missing data are for variables pertaining to union federations and wage bargaining and are generally missing for entire countries.Footnote 15 Because cross-sectional variation dominates temporal, I do not impute missing values (either country means or multiple imputation).
These data present a substantial modeling challenge. We have data for a relatively small number of countries, some potentially endogenous and collinear variables, and relatively coarse categorical time series. Even more challenging is the fact that cross-sectional variation swamps within-country fluctuations over time, particularly for the dummy variables indicating whether unions and employer federations have centralized decision making over strikes and lockouts.Footnote 16 This stickiness in the data is not entirely surprising. The theoretical model takes the distribution of unionists and the set of unions as fixed and given, i.e., determined exogenously. I find this assumption relatively unproblematic; there is evidence that the craft vs. industry basis for unionism, union recognition laws, and federalism affect whether unionists are fragmented into numerous smaller unions or concentrated into larger ones. These factors are exogenous to the decisions of modern unions and rarely change. Thus we also expect the political organization of union federations to be relatively stable.
From a theoretical standpoint, the key covariate measures the degree of inequality of union membership across unions affiliated to the largest union confederation. Unfortunately, cross-nationally comparable union-level membership data do not currently exist, preventing recovery of the higher moments of the union membership distributions. Nevertheless, the GWL dataset reports the number of affiliated unions in the largest confederation and the Herfindahl index of member concentration in those confederations.Footnote 17 Neither of these measures alone captures inequality (Davies Reference Davies1979, Reference Davies1980). To see this, note that a Herfindahl index can be interpreted as the probability that any two randomly selected unionists will be members of the same union. This number will be high if there are a small number of unions or if there are many unions but membership is highly concentrated in a few. A completely equal distribution of membership would give a Herfindahl value of 1/a, where a was the number of affiliated unions, telling us nothing about inequality when the number of affiliates varies across countries and over time, as it does here. But if we are willing to assume that union members are distributed lognormally across unions, Hart (Reference Hart1975) shows that H = a −1 expη2, where H is the Herfindahl index of membership concentration and η2 is the variance in log membership. Thus, for each country i in year t, ηit2 = loga itH it. Given H and a from the GWL dataset, I calculate η2 to measure membership inequality.
η2 is certainly an imperfect proxy. The model— coupled with the assumptions described above— predicts that if union membership is sufficiently unequal and the union federation controls strike funds, then the biggest unions will not affiliate. Thus we might observe a confederation with a strike fund and relatively equal distribution of resources across affiliates because the overall distribution of unionists was highly unequal and the biggest unions remained outside the federation. Unfortunately, we do not have data on the number of unions in the whole country and the concentration of members across them. But this problem is not as bad as it seems. To the extent that this endogeneity problem exists, it biases findings against me; i.e., I am less likely to find η2 negatively related to confederal strike funds as the theory predicts. Furthermore, all countries in the dataset in which the biggest federation controls a centralized strike fund also have a very high proportion of unionists in confederally affiliated unions.Footnote 18 It does not appear that the biggest unions “exit” (or refrain from affiliating) in the cases where federations have strong strike powers. Nevertheless, I also include a control variable for the total number of union confederations in a country to account for the possibility that workers in stronger unions might still in fact secede to form a separate organization.
In analyzing the data, I also want to account for other plausible relationships discussed in the literatures on wage bargaining, working class formation, and interest groups. Although there is little in the way of theories of confederal strike powers, the literature does contain several assertions about coordinated wage bargaining. I will treat these arguments for the latter as relevant to the former.
Coordinated bargaining is often contrasted as one extreme on a continuum where the other pole is a totally nonunionized labor market (Olson Reference Olson1982; Calmfors and Driffill Reference Calmfors and Driffill1988; Iversen Reference Iversen1999). Coordinated bargaining is more important the more unionized the economy. I therefore include union density as a covariate.
Scholars focusing on employers (Swenson Reference Swenson1991, Thelen Reference Thelen2004) argue that more coordinated wage bargaining is a function of more coordinated employers. To measure employer coordination, I use a dummy variable indicating whether the employer federation has authority to veto its affiliates' wage agreements.
Existing theories of coordinated wage bargaining point to several important structural variables. A common claim is that coordinated bargaining is more valuable the more a country is open to international markets via trade; both employers and unions in the tradeable sector have strong incentives to contain wage costs across the economy (Wallerstein Reference Wallerstein1985; Swenson Reference Swenson1991; Iversen Reference Iversen1999). I include (imports + exports)/GDP in both sets of regressions.
Bigger countries are generally more complex, more economically diversified, and less reliant on trade. Several arguments have been proffered linking country size and the organization of labor unions. Wallerstein (Reference Wallerstein1989) argues theoretically and finds empirically that economies with bigger labor forces are less unionized. Martin and Swank (Reference Martin and Swank2008) find that geographically larger countries are less likely to have highly coordinated employers. Both these findings resonate with older claims that large, diversified work forces undermine working class formation (Stephens Reference Stephens1979; Korpi Reference Korpi1983). Similarly, several generations of labor scholars focusing on the United States have argued that the country's geographic size led to weak and decentralized unions (Commons Reference Commons1926a, Reference Commons1926b; Ulman Reference Ulman1955; Laslett and Lipset Reference Laslett and Lipset1974). I therefore include (log) population as a measure of size, with the expectation that it is associated with lower probability of central strike funds and less coordinated wage bargaining.Footnote 19
In the literature there are conflicting arguments linking union peak associations and political parties. Left parties have their electoral fortunes bound more tightly to the ability of the labor movement to coordinate in both their political and economic (i.e., wage bargaining) behavior than those of the Center or Right. Where unions can coordinate effectively, Left parties are more likely to hold office, and when the Left are more frequently in office, they have both the incentive and ability to use their position to further strengthen unions. Headey (Reference Headey1970) argues explicitly that frequent Socialist government is required to sustain the confederal authority of union organizations and concomitant incomes policies. Similarly, Hartmann and Lau (Reference Hartmann and Lau1980, 370) argue that “confederations seem to be ‘sponsored’ by their environment: employers, political parties, and the government lend their support to confederate status by treating confederations as quasi-autonomous and cooperating parties.” But Stephens (Reference Stephens1979), Korpi (Reference Korpi1983), and others following in the power resources tradition claim that causality works the other way around: strong, centralized union movements produce frequent Left governments. Empirically speaking, there is evidence of both occurring: unions founding political parties and parties founding affiliated union organizations (Ebbinghaus and Visser Reference Ebbinghaus and Visser2000). I include the proportion of government-controlled seats in the lower house held by Leftist parties to account for this relationship but am agnostic about its expected relationship with confederal strike funds and coordinated bargaining.
Scholars of labor market institutions have likewise studied the role of party systems and electoral rules without achieving consensus. On the one hand, more proportional electoral institutions are strongly associated with more frequent Left party governance (Sartori Reference Sartori1976; Cox Reference Cox1997; Cusak, Iversen, and Soskice Reference Cusak, Iversen and Soskice2007). Martin and Swank (Reference Martin and Swank2008) focus on the role of electoral institutions in engendering coordination among employers, finding coordination increasing in the proportionality of the electoral system. But a fragmented party system may also result in less union coordination, as the multiple party-aligned union confederations in Italy, Spain, and Portugal can attest (Headey Reference Headey1970; Marks Reference Marks1989). I account for either possibility by including the (log) effective number of political parties to measure partisan fragmentation. Making statements about the “effects” of partisanship and partisan fragmentation will be hampered by the known endogeneity between the two.Footnote 20
Separate from the wage bargaining literature, there is a venerable series of arguments from political science and sociology that explicitly link the organization of interest groups and other “voluntary associations” with political institutions, specifically the centralization or dispersion of political authority. The existence of multiple venues in which interest groups can make policy demands—state and national legislatures as well as courts and the administrative bureaucracy at both the national and state levels—impedes the development of centralized interest group organizations. With a decentralized political system, there are strong reasons to maintain a decentralized confederal structure for interest groups (Wilson Reference Wilson1973; Skocpol, Ganz, and Munson Reference Skocpol, Ganz and Munson2000). I therefore include an indicator for federalism in the expectation that it takes a negative regression coefficient.
Finally, the argument that linguistic, racial, and religious cleavages impede the organization of a unified working class is at least as old as Marx. There are those who trace union fragmentation back to primordial cleavages of religion and language or the historical development of social democratic parties (Ebbinghaus and Visser Reference Ebbinghaus and Visser2000; Agell Reference Agell2002). There is some direct evidence of this: in the Netherlands and Italy, union federations split along confessional lines. Scholars of the American labor movement have looked to racial divisions and immigration to explain its weakness and fragmentation (Commons Reference Commons1926a; Laslett and Lipset Reference Laslett and Lipset1974). I use Fearon's measure of cultural fractionalization (Fearon Reference Fearon2003) to account for this hypothesis, in the expectation that cultural fractionalization will impede both the centralization of confederal strike powers and coordinated bargaining.
Modeling Framework
In political science, the now-standard approach to modeling Time Series Cross Section (TSCS) data is OLS regression with either a lagged response variable or autoregressive error correction to account for temporal dependence along with some type of ex post sandwich estimator to address concerns about heteroscedasticity. This approach has not been extended to accommodate discrete response data. Additionally, although these data contain repeated measurements for each country along several dimensions, the within-country, over-time variation is negligible relative to the cross-country variation. What is more, for some covariates there is perfect separation. For example, there is no country-year in which the union federation controls a strike fund and bargaining is completely decentralized.
Clearly the lack of cross-sectional variance in the outcome is a challenge, but it does not imply we should fit simple cross-sectional models. There is still something to be learned from the stability of the repeated measurements along with the cross-sectional variation.Footnote 21 From a theoretical perspective, my interest is in accounting for cross-county diversity in centralization rather than explaining within-country variation over time. I therefore take a population-averaged (or marginal) rather than a country-specific (or conditional) approach (Zorn Reference Zorn2001; Diggle, Liang, and Zeger Reference Diggle, Liang and Zeger2002). I turn to generalized estimating equation (GEE) and nonparametric window subseries empirical variance (WSEV) estimators.
The GEE logit regression utilized throughout can be expressed as
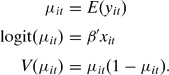
The GEE estimator for β solves the estimating equation  , where N is the number of subjects (countries) and V(α) is the working covariance matrix.
GEE models account for dependence in the data by iterating between estimating regression parameters β and then using the residual variance to estimate the correlation parameters of the covariance matrix (Liang and Zeger Reference Liang and Zeger1986). WSEV is a nonparametric extension of the GEE model.Footnote 22 Rather than using the empirical correction for the GEE standard errors, WSEV assumes that the dependence across observations decreases as the distance in time between them increases. Taking advantage of the (asymptotic) consistency and normality of the GEE estimates for β, the WSEV estimator accounts for temporal and spatial dependence in the error process by generating “subsamples that are nearly independent between clusters then averaging variances over clusters” (Heagerty, Ward, and Gleditsch Reference Heagerty, Ward and Gleditsch2002, 311). This is achieved by breaking the time series into (overlapping) blocks and assigning an observation y it to cluster k if t k ≤ t ≤ t k+1. Specifically, in the logit case
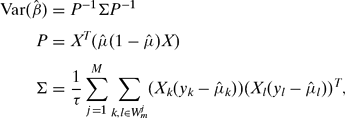
where  is μ evaluated at
 , τ is the number of time periods, m is the length of the time window, W mj is the jth window, and M is the number of windows. The trick is to choose a window length such that observations are nearly independent across clusters. Heagerty and Lumley (Reference Heagerty and Lumley2000) argue that windows should be set to length ≈4τ1/3. I use windows of length 10.
Confederal Strike Funds
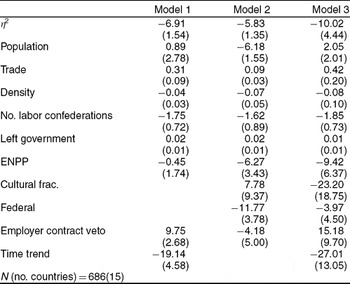
I model the probability that the largest union federation controls a central strike fund. Results are displayed in Table 1. Model 1 excludes the time-invariant covariates federalism and cultural fractionalization. Model 2 includes these two variables but removes the time trend. The last model include all the variables. In all specifications the coefficients on the theoretically relevant variables are negative, as expected, and distinguishable from 0 at standard significance levels.
GEE Logistic Regressions for the Probability that the Biggest Union Federation Possesses Strike Funds

Constant estimated but not reported. WSEV standard errors in parentheses. See Appendix B for details on the variables.
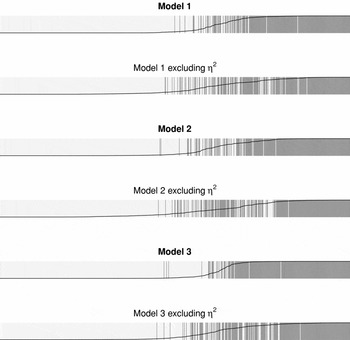
Before considering the magnitude of these relationships I examine model fit. Figure 1 displays “separation plots” (Greenhill, Ward, and Sacks Reference Greenhill, Ward and Sacks2009) for evaluating models' in-sample predictive power and visualizing the importance of including η2. In each plot, observations are sorted by the predicted probability of having a confederal strike fund. Dark vertical bars represent actual country-years with confederal strike funds. We can evaluate a model's predictive power by gauging the extent to which the actual instances are concentrated to the right of the plot whereas nonevents are to the left. A poorly performing model would generate an even distribution of vertical bars across the whole plot, whereas a perfect model would produce total separation, with all dark bars (1s) on the right and all nonevents (0s) on the left. For Models 1–3, I present a separation plot and then repeat the exercise using the same model but excluding η2. It is easy to see that Model 3 is the best-performing model, but omitting the theoretically important variable η2 significantly degrades performance across all specifications. Models including η2 are preferable to those without.
In-Sample Predictive Performance: Excluding η2 Significantly Impairs Model Performance across Specifications

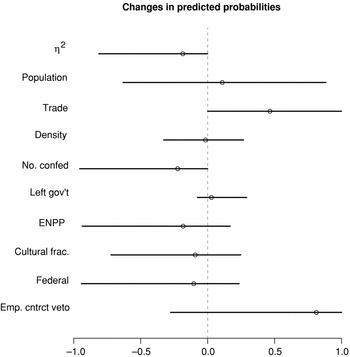
To get a better idea of the magnitude of the model's implied relationships, I present a graphical depiction of “first differences.” Figure 2 displays changes in the expected probability of a strike fund for changes in each of the covariates, holding all others at their mean levels (for interval-scaled covariates) or modal values (for categorical variables). Interval-scaled variables move across their interquartile ranges and indicators are toggled. All predictions use estimates from Model 3. Bars represent 95% confidence intervals. The directionality of findings is largely in line with expectations. More unequal distribution of membership resources across unions is clearly negatively associated with centralized strike powers; the probability of centralizing conflict funds is lower by 0.2, on average, for countries with third-quartile levels of membership variance compared to those in the first; Also, contrary to the Martin and Swank (Reference Martin and Swank2008) findings for employers, I find that more fragmented political party systems impede the development of centralized strike funds. Open economies are substantially more likely to have union federations with centralized strike powers. Other covariates show more uncertain relationships.
Predicted Change in the Probability of the Biggest Confederation Controlling a Strike Fund

Bargaining Coordination
Does the central control of strike funds matter for bargaining coordination? We examine that relationship here. The response variable for these models is Visser's (Visser Reference Visser2009) recent revision of Kenworthy's five-point scale of bargaining coordination (Kenworthy Reference Kenworthy2001).Footnote 23 I use this variable rather than any of the numerous measures of wage setting or coporatism for two reasons. First, as Soskice (Reference Soskice1990), Golden (Reference Golden1993), and Kenworthy (Reference Kenworthy2001) observe, bargaining coordination is a more meaningful concept than the actual level at which bargaining takes place. There are countries in which bargaining may officially take place at the industry or plant level but where pattern setting is quite strong and coordination in contract expirations, wage demands, and even strikes is quite high. Japan is one example. The centralized control of a strike fund need not imply centralized bargaining, but it certainly implies some degree of coordination and centralized control over strikes. Because coordination is the more analytically meaningful concept for researchers looking at the effects of bargaining structure, I examine coordination empirically. Second, there are some notable differences when the Visser/Kenworthy variable and GWL measures of bargaining centralization are compared. The Visser/Kenworthy data show substantially more variability than GWL in the Italian and Australian cases, comporting better with my understanding of events in both countries, particularly in the 1980s. Visser/Kenworthy also, and in my mind correctly, identifies Japan as having relatively coordinated wage bargaining for the period under study, even if bargaining takes place at a lower level. The same holds for Austria, where wages are set at the industry level, but in a rigidly organized and coordinated fashion.
As an ordered categorical variable, it is most common to model these data using ordered logit or probit regression. GEE models for ordered categorical responses do exist (Heagerty and Zeger Reference Heagerty and Zeger1996; Parsons, Edmondson, and Gilmour Reference Parsons, Edmondson and Gilmour2006). But even in the GEE world these models rely on the strong and frequently untested assumption of “proportional odds” or “parallel regressions,” i.e.,  , where the c j are the cutpoints between categories. Substantively, this amounts to assuming that the effects of covariates are the same across different levels of the response variable. For the data here, both the Brant (Reference Brant1990) test for conventional MLE ordered logit and the Wald test for GEE logit (Stiger, Barnhart, and Williamson Reference Stiger, Barnhart and Williamson1999) show this assumption to be unsustainable. Ignoring this and fitting an ordered model anyway can induce inconsistent estimates of the slope parameters across levels of the response. I therefore break the response variable into a sequence of binary variables,
 = 1, 2, 3, 4, which takes on a value of 1 if y it > j and 0 otherwise. Results for these models describe the (log odds) of exceeding a certain level of bargaining coordination. Breaking the variable apart in this way retains the ordering information and avoids imposing the strong interval assumptions of a Gaussian linear model while also enabling the use of the GEE/WSEV estimator.
In these models I include the predicted probability that the union federation controls a strike fund, taken from Model 2.Footnote 24 I also endeavor to include all the other covariates used above: (log) population, trade, (log) parliamentary parties, Left government, cultural fractionalization, federalism, and whether the employer federation can veto wage contracts. Following Wallerstein andWestern (Reference Wallerstein and Western2000), I include a linear time trend. For some models, it proved impossible to include certain covariates, due to perfect separationFootnote 25 or insufficient variance to calculate WSEV standard errors. I exclude these variables in the tables below in order to report consistent estimates and standard errors, but substantive findings for the theoretically key variables are not affected by this choice. Because I include the predicted probability of a strike fund and the variables used to generate that prediction in the same model, coefficient estimates for the other variables represent additional direct associations with bargaining coordination above and beyond their relationships through union organizational centralization.
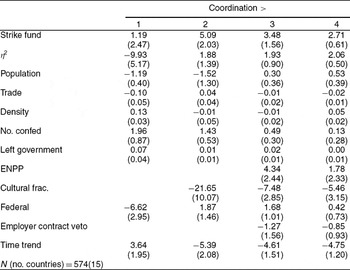
Table 2 reports findings. Coefficients on the strike fund variable are positive across all levels of the response and attains significance at all levels save the lowest. Also worth noting is that, although employer contract veto is not a useful predictor of coordination at the high end of the scale, it is a perfect predictor at the low end: we do not observe country-years with both uncoordinated bargaining and strong employer federations.
Sequentially Ordered Binary GEE Logit Results for Bargaining Coordination

Constant estimated but not reported. WSEV standard errors in parentheses. See Appendix B for details on the data.
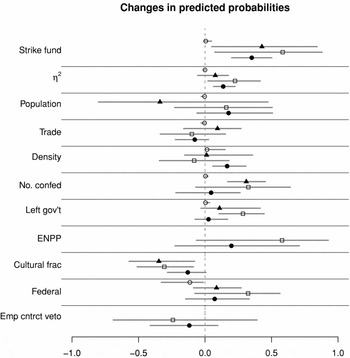
I interpret these findings using a plot of first differences in predicted probabilities, as displayed in Figure 3. For each variable, j increases from top to bottom. For j=1, we use open dots. Solid triangles represent j = 2. Open squares represent j = 3 and solid circles are for j = 4. As before, indicator variables are toggled and continuous variables move across their interquartile ranges. The centralization of union authority, as proxied by the predicted probability of centrally controlled strike funds, has a consistent positive association across levels of the response variable; indeed it is the only covariate that has any consistent effect in these models. Countries in the third quartile of predicted central strike funds are nearly 42% more likely to have bargaining coordinated at level 3 or higher, almost 60% more likely to have bargaining coordination at level four or five, and over 35% more likely to be in the highest category compared to those in the first quartile. This is not to say that other covariates are not meaningful—cultural fractionalization in the third quartile decreases the probability of being in the highest category by .13, of being in the top two categories by .3, and of being in the top three categories by .34, relative to the first quartile. Interestingly, η2 seems to have a slight positive relationship wtih bargaining coordination once its effects on confederal strike funds is taken into account.Footnote 26 The other variables do not show a consistent relationship with bargaining coordination independent of their influence on the centralization of union confederal authority. The findings provide evidence that organizational factors, especially pertaining to unions, are important for sustaining coordinated wage bargaining.
Predicted Change in the Probability That the Level of Bargaining Coordination Is > j, Where j = 1, 2, 3, 4, the Values of Visser's Coordination Scale

Taken together, the findings here are consistent with expectations generated from the model. I find that the likelihood of union confederations controlling the strike decisions of their affiliates is decreasing in the inequality of membership across affiliated unions. Trade exposure also shows a consistent influence on the structure of the union movement. When we turn to bargaining coordination, we find empirical corroboration for the assertion that coordinated bargaining depends on union peak associations able to influence the strike behavior of their affiliates. Interestingly, my findings show that most of the influence of other covariates on bargaining coordination flow through their effects on the organizational capacity of peak associations, particularly labor. Central control of strike funds appears as the most consistent predictor of bargaining coordination, though strong employer groups are also important.
CONCLUSION
Encompassing peak associations play a critical role in our understanding of economic policy and outcomes across rich democracies in the post-War era. How the internal politics of these organizations affect their “encompassingness” is less well theorized. In this paper I developed a model of the internal politics of confederal organizations and applied it to peak associations of labor. The model's chief prediction is that the more unequally distributed resources are across unions, the less we expect a confederation to encompass the most powerful unions and/or witness a confederation with central control over strongly redistributive activities. The anticipated distributional effects of cross-union cooperation can work to undermine union centralization; effective cooperation is enhanced by relatively egalitarian distribution of the key union resource—members. I argue that control over strikes is bound up in interunion distributive politics and expect strike powers to be centralized where union members are more equally distributed across affiliates to the confederation.
I examined this hypothesis empirically, finding that centralized union control of strikes is more likely where unionists are equally distributed across affiliates. I then examine the extent to which centralized strike powers affect bargaining coordination. I find that highly coordinated bargaining is associated with more centralized control of strikes. I also find evidence congruent with other assertions in the wage bargaining literature. Trade exposure tends to improve chances, whereas larger economies tend to be more decentralized. On the political side, partisanship, electoral institutions, and federalism all appear to affect union centralization, but precise inference of these parameters is hampered by the likely endogeneity of government partisanship to electoral institutions. Political structure and the actions of politicians “matter” for the organization of labor interests. But there is a noteworthy caveat: these variables' relationships to bargaining coordination appear to flow through their associations with the organizational capacity of peak associations, especially labor.
One implication of the findings is particularly striking: it may be that the standard argument that centralized bargaining induces a more egalitarian distribution of wages and income has the story backwards; where workers (and the organizations that represent them) are not too unequal in their resources and interests they are more likely to cooperate in a centralized fashion.Footnote 27 This comports with Scheve and Stasavage (Reference Scheve and Stasavage2009)'s finding that income and wage inequality in Sweden had already fallen substantially and was declining at the time centralized bargaining was instituted. Decisively addressing this issue will require us to continue the work of explaining the complexion of unionism—and other labor market institutions—across countries. Why did some countries develop more balkanized craft-based unions as opposed to industrial unions? How much influence must be attributable to deep historical forces such as the legacy of guilds, the timing of industrialization, and the extension of the franchise (Ingham Reference Ingham1974; Iversen and Soskice Reference Iversen and Soskice2009)? What is the role of changing job market risks (Beramendi Reference Beramendi2007)? Is there a pivotal role for ideologies or even particular individuals? Ultimately, whether social democracy is a feasible developmental strategy for countries beyond a 60-year window in northwest Europe remains an open question.
More settled is the notion that social democracy must evolve if it is going to continue to generate egalitarian economic growth. Unions themselves are no longer generating the political and economic pressure they did in the 1950s–1980s. Strikes in the OECD have become less common and less disruptive in the years since 1990; labor markets have a notable insider–outsider character; and union density is declining in many places. Where unions find themselves embedded in auspicious institutional settings that they initially helped create (strong, centralized federations, the Ghent system, etc.), they have been able to remain an important part of the economic and political landscape. Unions may substitute political activity for strikes as the latter have become a less potent and less frequently used weapon. The extent to which political coordination overlaps with cross-union coordination in bargaining and industrial disputes is a wide-open empirical question. But unions have fared poorly in recent years in places where they failed to effectively pool their strength early on. Federations are fragmenting, as in the United States, and many smaller unions are merging into larger unions or simply disappearing. Thus unions now seem bound together by their common weakness rather than divided by their strengths.
APPENDIX A: PROOFS
Proof of Lemma 1
The proof proceeds through each case of Δu i.
r α > γ ≥ r i: The derivative with respect to γ of the top half of equation (3) is
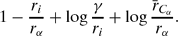
r α > γ ≥ r i ≥ 1 ⇒ the first two terms sum to a nonnegative number and the third term is nonnegative. Because r α ≤  , the last term is nonnegative.
r α > γ, r i > γ: The derivative with respect to γ of the bottom half of equation (3) is

which is nonnegative if and only if r i/r α ≤  ) + 1.
r α ≤ γ, r i ≤ γ: The derivative with respect to γ of the top half of equation (4) is  ≥ 0 ∀i, because
 ≥ r i by construction.
r α ≤ γ < r i: The derivative with respect to γ of the bottom half of equation (4) is  ≥ r i > γ ⇒ the derivative is positive.
Proof of Lemma 2
The proof proceeds through each case of Δu i.
r α > γ ≥ r i: The derivative with respect to r i of the top half of equation (3) is

r α > γ, r i > γ: The derivative with respect to r i of the bottom half of equation (3) is
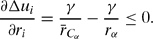
r α ≤ γ, r i ≤ γ: The derivative with respect to r i of the top half of equation (4) is
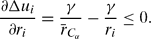
r α ≤ γ < r i: The derivative with respect to γ of the bottom half of equation (4) is

If i is decisive, i.e., r i = r α and a change in r i changes r α, then Δu i simplifies to γ  , the derivative of which is
 , which is nonpositive because r α ≤
 by construction. Note that all weak inequalities above become strict when |C| > 1.
Proof of Proposition 1
Fix some α and some membership C. If condition 5 or 6 holds for r α then, by Lemma 2, they hold ∀i such that r i ≤ r α. Each such i benefits by joining the confederation. Denote by  the value of r i for which either condition 5 or 6 holds with equality. Any union j outside the confederation for which r α < r j ≤ can do better by joining, because doing so moves the decisive member closer to j's preferred t j* and adds resources, thereby increasing the returns from the confederal activity. Thus, in equilibrium, there is a (compact) set of unions with contiguous preferences around the αth union satisfying either condition 5 or 6.
By Lemma 1, in all cases but one, Δu i is increasing in γ, implying more unions, not fewer. Thus it suffices to show that in the remaining case where this does not always hold those with net utility decreasing in γ would not join in the first place. I.e., it suffices to show that when γ < r α, r i members with r i > r α(1 +  ) will find it unprofitable to join. If
 then, substituting for r i and γ/r α for t α, Δu i =
 = 0. Thus any union with r i >
 will have Δu i < 0 and will therefore not be a member of C α. Thus the equilibrium confederation will not shrink and may increase in size for any increase in γ.
Proof of Proposition 2
For t α′ to exist, it must be the case that i would join the confederation at some value of t. Because t*i is i's most preferred contribution level and, by assumption, there is some i for which γ < r i, we can substitute γ/r i for t*i into Δu i, leading to the condition that γ  , which will always be true for nonnegative γ.
The value of t that makes i indifferent between joining and not solves Δu i = 0 ⇔ tr i =  . Denote this value of t as
 . It must also be the case that all j would prefer that i be in the confederation. For this to be the case, there must exist some value of t that satisfies i's participation constraint while making all j at least as well off as they were without i. This value exists if
 . Rearranging terms gives condition 7.
APPENDIX B: DATA
η2(interunion membership variance): The variance in log union membership across affiliates of the largest union confederation, derived by taking the log of the product of the Herfindahl index of membership concentration for the largest federation (APPHRF1, interpolated to the annual level) and its number of affiliates. The former is from Golden, Wallerstein, and Lange (Reference Golden, Wallerstein and Lange2009) whereas Miriam Golden provided the latter.
bargaining coordination: The Visser (Reference Visser2009) revision of Kenworthy's wage bargaining index, taking values in {1, 2, 3, 4, 5}, where “1 = fragmented wage bargaining, confined largely to individual firms or plants. . . 2 = mixed industry- and firm-level bargaining, with little or no pattern setting and relatively weak elements of government coordination such as setting of basic pay rate or wage indexation. . . 3 = industry-level bargaining with somewhat irregular and uncertain pattern setting and only moderate union concentration. . . government wage arbitration; 4 = centralized bargaining by peak confederation(s) or government imposition of a wage schedule/freeze, without a peace obligation. . . informal centralization of industry- and firm-level bargaining by peak associations. . . extensive, regularized pattern setting coupled with a high degree of union concentration; 5 = centralized bargaining by peak confederation(s) or government imposition of a wage schedule/freeze, with a peace obligation. . . informal centralization of industry-level bargaining by a powerful, monopolistic union confederation. . . extensive, regularized pattern setting and highly synchronized bargaining coupled with coordination of bargaining by influential large firms” (Kenworthy Reference Kenworthy2003, 41).
confederal strike fund: Indicator of whether the largest union confederation controls a central strike fund, CON14 (Golden, Wallerstein, and Lange Reference Golden, Wallerstein and Lange2009).
cultural fractionalization: Cultural-linguistic fractionalization taken from Fearon (Reference Fearon2003).
ENPP: Natural log of the effective number of parliamentary parties from Golder (Reference Golder2005).
employer contract veto: Dummy variable indicating whether the employer federation can veto affiliates' wage agreements. EMCONV2 from Golden, Wallerstein, and Lange (Reference Golden, Wallerstein and Lange2009).
federal: Indicator for federal governmental system taken from Beck et al. (Reference Beck, Clarke, Groff, Keefer and Walsh2001)
Left government: Proportion of the total number of legislative seats controlled by the government parties that are due to Left parties taken from Swank (Reference Swank2006).
number of confederations: The number of labor confederations, taken from Golden, Wallerstein, and Lange (Reference Golden, Wallerstein and Lange2009).
population: Log population in millions from taken from the Penn World Tables (Heston, Summers, and Aten Reference Heston, Summers and Aten2006); henceforth PWT.
trade: (Exports + imports)/GDP in current US$ from PWT.
union density: Net union density taken from Golden, Wallerstein, and Lange (Reference Golden, Wallerstein and Lange2009) and supplemented with values from Visser (Reference Visser2006).



Comments
No Comments have been published for this article.