


The first case of SARS in Beijing was reported on 5 March 2003, and via a series of imported index cases in the following weeks it became the largest outbreak of SARS in the world with a total of 2521 reported probable cases [Reference Pang1] of whom 193 (7·7%) died [Reference Chen2]. Here we assess the effectiveness of the various control measures that were implemented in Beijing by estimating the changes in the underlying degree of disease transmission during the epidemic.
The only published epidemic curve describing dates of symptom onset of probable SARS cases in Beijing, rather than dates of hospital admission, is presented by Liang et al. [Reference Liang3]. The epidemic curve of symptom onset dates of 1896 patients (75% of the probable SARS cases in Beijing) is presented in the Figure, where dates of important control measures [Reference Pang1, 4] are superimposed. The epidemic curve reveals an exponential increase in early April, then a steady increase to a peak in late April, followed by a steady decline throughout May with the final cases occurring before the end of that month.
(a) Number of cases of SARS by date of onset (n=1896) and dates of important control measures, Beijing, March–May 2003 [Reference Pang1, Reference Liang3, 4]. (b) Daily estimates of the effective reproductive number R t with 95% confidence intervals where the grey region indicates R t⩽1. HCW, Health-care worker; PPE, personal protective equipment; WHO, World Health Organisation; MOH, China Ministry of Health.

Contact tracing and quarantine of close contacts of probable cases began on 9 April. SARS was made a notifiable disease and 3500 public health workers were mobilized on 10 April, while the mayor of Beijing set up the joint SARS leading group on 17 April. On the same day, some 123 fever clinics were set up in hospitals across Beijing, while near the end of the epidemic on 6 May these were reduced to 66 clinics separated from other patient areas [Reference Pang1]. From 18 April, health-care workers were given special training in the management of patients with SARS, infection control, and the use of personal protective equipment (PPE) including masks, goggles and gowns; detailed infection control guidelines were issued by the China Ministry of Health on 4 May [Reference Pang1]. The executive vice-minister of health announced the scope of the Beijing outbreak in a press conference on 20 April [Reference Pang1], and this was followed 3 days later by the WHO travel advisory [4]. After 21 April, there was a rapid increase in the number of quarantined close contacts of infected cases; these contacts were primarily quarantined at home while some were quarantined in hotels and university residences, and by the end of the epidemic a total of 30 000 individuals had been quarantined [Reference Pang1]. On 22 April, fever checks were set up at the Beijing international airport; screening was also conducted at major train stations and main roads into Beijing [Reference Pang1]. On 24 April all public elementary, middle and high schools were closed, and on 26 April major sites of public entertainment including libraries, bars and theatres were closed [Reference Pang1]. On 27 April SARS patients in hospitals began to be grouped together on designated wards, and on 1 May the new 1000-bed Xiao Tang Shan Hospital opened and began to receive SARS patients from other hospitals in Beijing, having been constructed in just 7 days [Reference Pang1].
To investigate the effectiveness of control measures in reducing the person-to-person transmission of SARS, we used the method of Wallinga & Teunis [Reference Wallinga and Teunis5] to estimate R t, the effective reproduction number on day t which is defined as the average number of secondary cases generated by one primary case with symptom onset on day t, and is a useful measure of the transmission dynamics of a disease [Reference Anderson and May6]. If R t exceeds 1, the epidemic will continue to spread, whereas R t must be persistently reduced to below 1 to control an epidemic. Estimation of R t requires the daily number of patients with onset of symptoms, and an estimate of the serial interval between onset of symptoms in a primary case and a secondary case. No data were available on the serial interval in Beijing, thus we used data from Singapore [Reference Lipsitch7] to specify a Weibull distribution with mean 8·4 days, which was previously used to estimate R t during the SARS epidemics in Hong Kong, Singapore, Toronto and Vietnam [Reference Wallinga and Teunis5]. We estimated 95% confidence intervals for R t on each day (see Appendix).
The resulting daily estimates of R t are presented in the Figure. Prior to 23 March, the small number of cases resulted in unstable estimates of R t with wide confidence intervals, thus we only present the estimates of R t from 24 March onwards. The Figure shows that R t initially remained at a constant level of about 3, before steadily declining after 11 April, falling to a level below 1 on 23 April, and then declining more slowly towards 0 throughout May.
The initial estimate of R t≈3 early in the Beijing epidemic is very similar to estimates of the reproductive number early in the epidemics in Hong Kong, Vietnam, Singapore and Canada [Reference Wallinga and Teunis5]. Our finding that the reproductive number only began to decline in mid-April, going below the threshold of 1 on 23 April, suggests that control measures in Beijing were fairly ineffective for 5 weeks after the first cases. However, once political attention was given to the outbreak, evidenced by the initiation of contact tracing on 9 April, and the order for SARS to be notifiable on 10 April, transmission (indicated by R t) immediately began to decline. Shortly after the introduction of fever clinics, and training in use of PPE in hospitals in mid-April, R t fell below the critical threshold of 1 (i.e. under control). Therefore, our results suggest that the most important factor in the control of SARS in Beijing as elsewhere was strong political commitment and a coordinated response. When the government finally announced on 20 April the scope of the ongoing SARS epidemic, the disease was already almost under control (R t was just above 1).
Our estimates of R t call into question the necessity and utility of closing schools, universities and other public places, with its disruptive effects on society. Furthermore, R t had subsided to below 0·5 when the 1000-bed Xiao Tang Shan specialist SARS hospital was constructed, updated infection control guidelines were issued, and new fever clinics opened in early May. As our current analysis illustrates, the epidemic curve will typically continue to rise even after a disease has been controlled (with R t<1), with the delay depending on the incubation period of the disease. In the Figure, case numbers continue to rise for 4 days after R t falls below 1, whereas the mean incubation period of SARS was about 5 days [Reference Cowling8]. We further observe that while R t≈3 prior to 11 April, the epidemic curve continued to show exponential increase through March and early April until 16 April (i.e. a lag of 5 days).
This example, in addition to earlier examples from four other sites affected by SARS [Reference Wallinga and Teunis5], highlights the connection between a unimodal epidemic curve and the underlying R t; two properties are worth particular mention. First, while R t is constant the curve will show an exponential increase which will continue for some time after R t begins to fall. Second, the peak in the epidemic curve will occur some time after R t falls below 1. In both cases the lag will approximately equal the mean incubation period. For outbreaks of infectious diseases with even longer mean incubation periods than SARS it is clear that it may not be reliable to assess the effect of control measures simply based on patterns in the epidemic curve, without considering the underlying transmission dynamics. We note that methods are now available to estimate R t in real time [Reference Cauchemez9, Reference Cauchemez10] and these may allow rapid assessment of the impact of control measures in future emerging infectious disease epidemics.
Previous assessments of the impact of public health interventions in Beijing have focused on the epidemic curve [Reference Pang1, Reference Liang3], the number of individuals quarantined [Reference Pang1], attack rates [Reference Pang1], the onset to admission interval [Reference Pang1, Reference Liang3], and the admission to notification interval [Reference Liang3]. For example, the onset to admission intervals averaged around 6 days while the epidemic was growing in early April, but these were reduced to a median of just 2 days by the end of May [Reference Pang1], whereas the interval between admission to hospital and notification of probable SARS cases declined rapidly at the beginning of April, and was below 1 day after 13 April [Reference Liang3]. Our analysis adds to these previous findings by demonstrating the changes in the underlying disease transmission during the epidemic, and aligning these changes with the temporal course of the various control measures.
A caveat of these analyses is that the available data on symptom onset dates only describe the epidemic curve for 75% of the SARS patients in Beijing [Reference Liang3]. However, further analysis using data for 2430 (96%) of the patients in Beijing [Reference Pang1] and imputing missing data on symptom onset dates showed a very similar pattern from April onwards (see Appendix and Appendix Fig.).
ACKNOWLEDGEMENTS
The authors are grateful to two anonymous referees for their helpful comments and suggestions. This work was supported in part through a commissioned research grant from the Research Fund for the Control of Infectious Diseases of the Health, Welfare, and Food Bureau of the Hong Kong Special Administrative Region Government; by the University of Hong Kong SARS Research Fund; and by the EU Sixth Framework Programme for research for policy support (contract SP22-CT-2004-511066).
APPENDIX
Estimation of confidence intervals for R t
The methods used to estimate R t are described in detail elsewhere in the literature [Reference Wallinga and Teunis5]. Briefly, for an epidemic of n reported cases of which q contracted infection from outside the population, the relative likelihood that case k has been infected by case l is given by
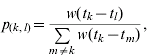
where w(·) is the generation interval (the average time between onset of symptoms in a primary case and onset of symptoms in a secondary case). The onset times of cases k and l are denoted t k and t l respectively. Note that p (k, l)=0 if t k⩽t l. Assuming that the probability of case l infecting case m is independent of the probability of case l infecting any other case, the distribution of the effective reproduction number for case l is denoted R l and is distributed as follows

The average daily reproductive number R t is calculated as the arithmetic mean over R l for all cases l with symptom onset on day t [Reference Wallinga and Teunis5].
When R t is estimated in this way, it is straightforward to calculate the mean and variance as follows:


Then an approximate 95% confidence interval for R t is given by  ±1·96s.
Supplementary analysis – estimation of R t by imputing missing data on onset dates
We conducted a simulation study to test the sensitivity of our results to missing data on the symptom onset dates of SARS patients in Beijing. Using data on admission dates [Reference Pang1] which were available for 2430 (96%) patients in Beijing, and data on the onset to admission intervals during various periods of the epidemic [Reference Liang3], we simulated the onset dates of those 2430 patients. We conducted 1000 simulations, each time drawing for each individual a random onset to admission time from a Poisson distribution with the mean between 1 and 7 days, depending on the period [Reference Liang3]. In particular, the mean onset to admission time was 3 days for patients admitted throughout March, 7 days from 1 to 15 April, 2 days from 15 April to 19 May, and 1 day from 20 May until the end of the epidemic [Reference Liang3]. The resulting 1000 epidemic curves are shown in the Appendix Figure [panel (a)], and show that the majority of missing data in the epidemic curve of Liang et al. [Reference Liang3] are most likely from the earlier stages of the epidemic. The Appendix Figure [panel (b)] also displays the available data on the epidemic curve by symptom onset dates [Reference Liang3] and by admission dates [Reference Pang1].
(a) Number of cases of SARS by date of onset (n=1896;  ) [Reference Liang3] and by date of admission to hospital (n=2430; - - -) [Reference Pang1], with 1000 simulated epidemic curves for symptom onset (grey lines) based on the data on admission dates, Beijing, March–May 2003. (b) Daily estimates of the effective reproductive number R t with 95% confidence intervals based on known symptom onset dates [Reference Liang3] as in the text Figure, and the daily estimates of the effective reproductive number R t in each of the 1000 simulated epidemic curves (grey lines).

Next, we estimated the effective reproductive number R t for each of the 1000 simulated datasets, and these estimates are presented in the Appendix Figure [panel (a)]. The estimates of R t from the primary analysis are also superimposed for reference. The simulated curves suggest that R t varied between 2 and 3 during the early stages of the epidemic, and as in the primary analysis R t began to decline in the second week of April, falling below the threshold of 1 around 21 April (2 days earlier than in the main analysis). The estimated values of R t in the simulated datasets are generally lower than in the main analysis, but the trends are very similar and therefore the conclusions of the primary analysis do not seem to be affected by the missing data on symptom onset dates.
DECLARATION OF INTEREST
None.



