I. INTRODUCTION
The nature of the glassy state continues to stimulate broad discussion throughout the physics and materials science communities. Reference Lubchenko and Wolynes1–Reference Zhao, Simon and McKenna3 Glasses are in an out-of-equilibrium state and their properties will evolve with time back toward the equilibrium liquid below the glass transition temperature T g. This is the phenomenon of physical aging, which is an important—and often altogether unavoidable—component of practical design and application of technologically relevant amorphous materials, Reference Mauro, Allan and Potuzak4 in particular bulk metallic glasses (BMGs). Reference Launey, Busch and Kruzic5–Reference Evenson, Naleway, Wei, Gross, Kruzic, Gallino, Possart, Stommel and Busch7
In recent years, X-ray photon correlation spectroscopy (XPCS) has provided an unprecedented look into the aging dynamics of metallic glasses directly on the atomic length scale. Reference Ruta, Chushkin, Monaco, Cipelletti, Pineda, Bruna, Giordano and Gonzalez-Silveira8–Reference Giordano and Ruta13 The existence of distinct structural rearrangements far below T g, Reference Ruta, Chushkin, Monaco, Cipelletti, Pineda, Bruna, Giordano and Gonzalez-Silveira8 compressed exponential relaxation functions, Reference Ruta, Baldi, Monaco and Chushkin10 and intermittent aging dynamics Reference Evenson, Ruta, Hechler, Stolpe, Pineda, Gallino and Busch11 all suggest a complex microscopic picture of metallic glass aging, not reflected in measurements of bulk macroscopic quantities. Reference Radelaar and van den Beukel14–Reference Evenson and Busch16 Here we investigate the microscopic dynamics in the Zr44Ti11Ni10Cu10Be25 (Vitreloy 1b) BMG. In particular, we present some intriguing features of the atomic-scale structural relaxation, as revealed by state-of-the art XPCS techniques, and compare and contrast them to previously investigated simple and glass-forming metallic systems. Additionally, we show that, in the present case, a small volume fraction of frozen nanocrystals does not seem to affect the overall microscopic dynamics, which is governed by a linear scaling law, in contrast to the fast exponential growth observed in hyperquenched ribbons. Reference Ruta, Chushkin, Monaco, Cipelletti, Pineda, Bruna, Giordano and Gonzalez-Silveira8,Reference Ruta, Baldi, Monaco and Chushkin10
II. EXPERIMENTAL
The Zr44Ti11Ni10Cu10Be25 alloy was chosen for these experiments, as it does not show phase separation in the vicinity of T g, which is known to significantly affect the observed aging behavior during long-time annealing. Reference Waniuk, Busch, Masuhr and Johnson17–Reference Evenson, Raedersdorf, Gallino and Busch19 Additionally, comprehensive measurements of enthalpy recovery, volume, and viscosity during aging of this composition have been carried out previously, Reference Evenson and Busch16 allowing for a detailed comparison of microscopic and bulk macroscopic properties. Amorphous rods of Zr44Ti11Ni10Cu10Be25 were supplied by Liquidmetal® Technologies (Rancho Santa Margarita, California). The cooling rate of the rod is estimated to be 10–50 K/s. Reference Waniuk, Busch, Masuhr and Johnson17,Reference Waniuk20 Differential scanning calorimetry experiments Reference Evenson and Busch16 have determined T g = 620 K at a heating rate of 25 K/min.
Dynamic mechanical analysis (DMA) of melt-spun ribbons was performed in tensile geometry in a TA Instruments Q800 DMA (New Castle, Delaware). Multifrequency tests (frequencies of 0.3, 1, 3, 10, and 30 Hz) were carried out at a constant heating rate of 1 K/min from ambient temperature up to 823 K. An oscillating strain of 0.5 µm amplitude was applied to samples with lengths of 15 mm under a static preload tension of 0.06 N. The dependence of the α-relaxation time τα on temperature was calculated from the position of the main relaxation peak at each frequency.
The XPCS measurements were performed at the beamline ID10 at ESRF (Grenoble, France). A partially coherent beam with an energy of 8.1 keV was selected by a Si(1,1,1) monochromator and focused onto the sample through beryllium compound refractive lenses. The coherent part of the beam was defined by rollerblade slits opened to 10 × 10 µm. Series of speckle patterns were collected in transmission geometry by a charge-coupled-device (CCD) from Andor technology (13 × 13 µm pixel size) placed ∼70 cm downstream of the sample at an angle 2θ ∼ 40°, corresponding to the maximum of the first sharp diffraction peak of the amorphous alloy. The raw data were treated as in Ref. Reference Chushkin, Caronna and Madsen21.
A resistively heated furnace with a temperature stability better than 0.1 K was used to heat and cool the sample under high vacuum conditions. For the XPCS measurements, samples of Zr44Ti11Ni10Cu10Be25 were obtained from a piece of a water-quenched bulk glassy rod of 10 mm in diameter via diamond saw cutting and then mechanically polished down to ∼60 µm. The structural analysis of the investigated samples was carried out at the beamline ID15 at ESRF, with an incident wavelength λ = 0.1425 Å. The data were collected with a 2D Pixium detector located far from the sample to highlight the low momentum transfer (q) range of interest in the XPCS measurements.
III. RESULTS AND DISCUSSION
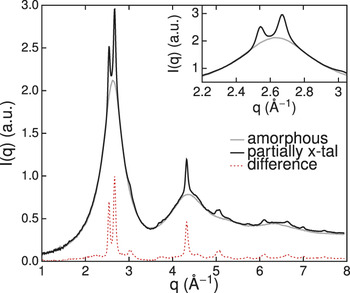
For the XPCS measurements, the initially glassy sample was annealed above T g at 633 K for ∼60 min, which induced the formation of nanocrystals. The diffracted intensities of both the completely amorphous and partially crystalline samples obtained in X-ray diffraction (XRD) measurements at ambient temperature are given in Fig. 1. As both samples were measured under the same experimental conditions, we can estimate the crystalline volume fraction by scaling the amorphous pattern onto the crystalline one in the q regions far from the Bragg peaks where the signal is thus dominated by the amorphous component. This procedure gives a crystalline volume fraction of 5%. This amount was found not to evolve additionally, once the system was cooled back below T g during the XPCS measurements. By slowly step-cooling back into the glass with a rate of 1 K/min, we thus investigate the effect of this small fraction of frozen nanocrystals on the atomic scale aging dynamics during each isothermal hold. These data have been compared with additional measurements taken in a fully amorphous sample, by step-heating the glass from room temperature. In both samples, the dynamics was measured in isothermal conditions for ∼5 h, thus allowing us to also follow the temporal evolution of the atomic motion.
Diffraction intensity I(q) measured on beam line ID15 at ESRF of the amorphous and partially crystalline (x-tal) samples of Zr44Ti11Ni10Cu10Be25. The dashed curve highlights the difference between the two diffraction patterns.

The microscopic dynamics is accessed in XPCS through an intensity auto-correlation function g 2(q,t), which is directly related to the decay of density fluctuations in the glass on a microscopic length scale given by the probed q-value via the Siegert relation
 $${g_2}\left( {q,t} \right) = 1 + \gamma {\left| {\Phi \left( {q,t} \right)} \right|^2}\quad ,$$
where γ is the experimental speckle contrast and Φ(q,t) = S(q,t)/S(q,0) is the normalized density correlation function. Reference Madsen, Fluerasu and Ruta22 By performing measurements at q = q 0, the first maximum in the static structure factor S(q), the microscopic dynamics is probed on a length scale of 2π/q 0 ∼ 2 Å, corresponding to the average atomic nearest-neighbor separation in the glass. Since q 0 = 2.6 Å−1 is situated between the two primary crystalline peaks indicated in Fig. 1, the scattered intensity is homogeneously distributed over the CCD detector. Hence, we were able to calculate the standard g 2(q 0,t) and indeed observe the effect of prior nanocrystallization on the atomic dynamics in the glass.
We model the decay of g 2(q 0,t) using a Kohlrausch–Williams–Watts (KWW) expression Reference Kohlrausch23,Reference Williams and Watts24
 $${g_2}\left( {{q_0},t} \right) = 1 + c\exp \left[ { - 2{{\left( {t/\tau } \right)}^\beta }} \right]\quad ,$$
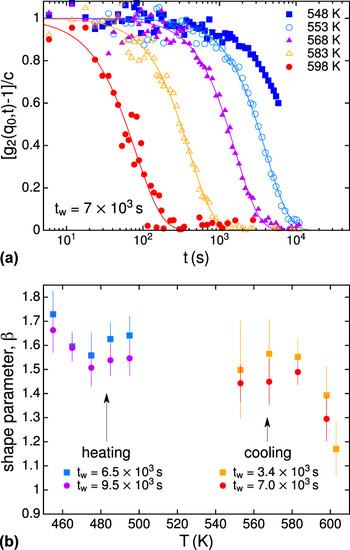
where τ is the relaxation time, β is the shape parameter, and c = γf q 2 is the product between the experimental contrast γ and the square of the Debye–Waller factor f q . For T ≤ 603 K, the atomic dynamics of the glass slows down enough to be explored by the time window accessible by the CCD, i.e., τ ≳ 100 s. In Fig. 2(a) we show the temperature dependence of g 2 (q 0,t) of the partially crystallized sample taken at a constant waiting time t w = 7 × 10³ s from temperature equilibration, along with best fits to Eq. (2).
(a) Temperature dependence of g 2(q 0,t) in partially crystallized Zr44Ti11Ni10Cu10Be25 measured during step-cooling at a fixed t w = 7 × 10³ s. Due to insufficient data at longer times, the data at 548 K are not fitted. (b) Evolution of the shape parameter β as a function of temperature and t w. The data taken during cooling correspond to the partially crystalline sample and those during heating correspond to the fully amorphous sample.

As is evident in Fig. 2(a), the decay of g 2(q 0,t) shifts to longer times upon lowering the temperature, a simple consequence of the decrease of thermal motion and increase in τ. The shape of g 2(q 0,t) in the glassy state is well described by a compressed exponential decay [Eq. (2)] with β > 1, which appears to systematically decrease with proximity to T g (∼620 K) [Fig. 2(b)]. While stretched exponential functions (β < 1) are commonly observed in a wide range of glassy relaxation phenomena and have been attributed to an underlying dynamical heterogeneity, Reference Ediger25 compressed exponentials, on the other hand, are indicative of a microscopic dynamics governed by the presence of internal stresses and cannot be rationalized within the heterogeneous dynamics scenario. Reference Bouchaud and Pitard26,Reference Cipelletti, Ramos, Manley, Pitard, Weitz, Pashkovski and Johansson27 In fact, theoretical and simulation studies suggest that long-range anisotropic stresses arising from dipole forces are integral to understanding aging in disordered matter. Reference Ferrero, Martens and Barrat28,Reference Chaudhuri and Berthier29 Even in the deeply supercooled liquid state, there are indications that the relaxation dynamics can be described through an accumulation of Eshelby transformations, i.e., local structural rearrangements resulting in long-range stress fluctuations and elastic strains. Reference Lemaître30,Reference Lemaître31 In this sense, the compressed form of the exponential relaxation function of metallic glasses probed in XPCS might also result from a series of such Eshelby transformations and the long range correlations between them. So far, we are unaware of any work that has provided a direct link between Eshelby events and aging in metallic glasses, although recent studies have highlighted the important role played by atomic-level stresses. Reference Evenson, Ruta, Hechler, Stolpe, Pineda, Gallino and Busch11,Reference Giordano and Ruta13,Reference Fan, Iwashita and Egami32 The decrease in β near T g reflects the system’s close proximity to its equilibrium state (supercooled liquid), where the microscopic dynamics is indeed characterized by stretched exponential correlation functions, in accord with a heterogeneous dynamics scenario. Reference Meyer, Wuttke, Petry, Peker, Bormann, Coddens, Kranich, Randl and Schober33–Reference Yang, Kordel, Holland-Moritz, Unruh and Meyer35 Upon cooling from the liquid, β increases smoothly and becomes constant, suggesting a continuous evolution from the supercooled liquid to the glassy state. Reference Ruta, Chushkin, Monaco, Cipelletti, Pineda, Bruna, Giordano and Gonzalez-Silveira8
In a different experimental protocol, a fully amorphous sample of Zr44Ti11Ni10Cu10Be25 was investigated by step-heating from the glassy state up to 495 K. Unfortunately, due to experimental constraints relating to available beam time, the temperature interval of ∼40 K between these two samples was not investigated. However, it would appear that, at least within the fitting uncertainty, the values of β obtained in both sets of measurements remain comparable and temperature independent in a certain temperature regime below T g, despite the different structural states of the sample and asymmetric thermal protocols used. At the lowest investigated temperature of 345 K (not shown), β has a value of 2.0 ± 0.1. A noticeable decrease to β = 1.5 ± 0.1 is observed during heating between 455 and 475 K [Fig. 2(b)], which is in line with previous experimental findings and has been related to the decrease in atomic-level stresses. Reference Ruta, Chushkin, Monaco, Cipelletti, Pineda, Bruna, Giordano and Gonzalez-Silveira8,Reference Ruta, Baldi, Monaco and Chushkin10 It should be noted that this temperature range also corresponds to that of the fast β-relaxation observed in DMA studies on a similar Zr46.25Ti8.25Cu7.5Ni10Be27.5 (Vitreloy 4) alloy. Reference Zhao, Wen, Shek and Wang36 Thus, the decrease in β observed in this temperature range might also be connected to the low-temperature onset of stress relaxation and excess free volume annihilation in the glassy state. Reference Wang, Ruta, Xiong, Zhang, Chushkin, Sheng, Lou, Cao and Jiang12
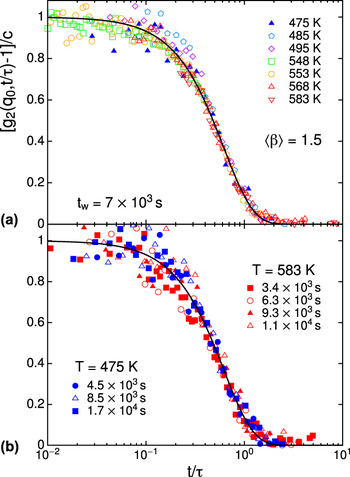
To investigate the changes to the atomic motion as a result of aging, we compare the waiting time-dependent dynamics in the partially crystallized sample close to T g with that in the fully amorphous sample measured during step-heating from ambient temperature. This will allow us to confirm whether the microscopic dynamics indeed behaves qualitatively similar, given the presence of a small percentage of nanocrystals. Between 475 and 583 K, all g 2(q 0,t) curves obey a common time-temperature-waiting time superposition—regardless of thermal history—with 〈β〉 = 1.5, shown as master curves in Fig. 3.
Rescaled values of g 2(q 0,t) show a clear (a) time–temperature superposition and (b) time-waiting time superposition, regardless of the thermal protocol and structural state of the sample. The solid curves are fits to Eq. (2) with 〈β〉 = 1.5.

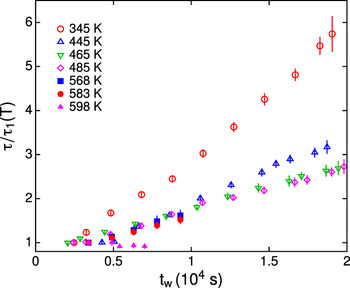
Figure 4 shows the evolution of τ as a function of t w. To compare the aging dynamics at different temperatures, we normalize the data by a common initial value τ1(T). Firstly, it is apparent that, at all temperatures below 598 K, τ follows a linear scaling such that τ(T,t w)/τ1(T) ∝ t w. In contrast to this, a fast exponential growth of τ has been observed in similar XPCS studies on hyperquenched metallic glass ribbons, Reference Ruta, Chushkin, Monaco, Cipelletti, Pineda, Bruna, Giordano and Gonzalez-Silveira8,Reference Ruta, Baldi, Monaco and Chushkin10 which has been related to the large amount of free volume and, hence, internal stresses Reference Giordano and Ruta13 produced by the extremely fast quenching rates of ∼106 K/s. This would thus suggest that the linear growth in τ observed here is simply a result of the much lower cooling rate used to produce these bulk samples. An alternative explanation could, however, reside in the different nature of the probed system. Short-time exponential aging has been reported for 2 and 3-component metallic glasses—systems with less dense atomic packing than the Zr44Ti11Ni10Cu10Be25 alloy measured in this work. Hence, the linear atomic aging reported here could be a consequence of this system’s better ability at avoiding thermally induced microscopic stresses while cooling from the high-temperature melt during the sample preparation. The fact that τ measured upon slow cooling from the supercooled liquid behaves in an identical fashion to those measured in the as-quenched BMG would seem to support this hypothesis. This is also consistent with the faster evolution of τ and larger value of β observed in the data taken at the lowest temperature (345 K), where the as-cast BMG sample has the largest amount of free volume and, accordingly, the greatest degree of internal stresses. Here, we recall that in situ aging is expected during the long isothermal steps of the XPCS measurements and, therefore, the glass measured at the higher temperature steps has already released part of the excess free-volume and internal stresses frozen in from its initial as-quenched state. The analysis in Fig. 4 thus shows that, even if the sample is partially crystalline, the microscopic aging of the system is obviously still governed by the amorphous matrix, and the presence of 5% of frozen nanocrystals has negligible impact on the atomic dynamics probed using XPCS.
XPCS structural relaxation times τ normalized to a temperature-dependent initial value of τ1(T) as a function of t w for all investigated temperatures. The waiting time dependence of τ/τ1(T) is well described by an empirical linear scaling law at all temperatures except 598 K. At this temperature, the microscopic dynamics of the glass do not evolve in time, similar to previous studies on a Pd43Cu27Ni10P20 BMG. Reference Evenson, Ruta, Hechler, Stolpe, Pineda, Gallino and Busch11

At the highest investigated temperature (598 K), τ apparently displays no dependence on t w within the experimental time scale, despite the sample still being in the glassy state, as evidenced by β > 1 [Fig. 2(b)]. A similar stationary dynamics close to T g was reported in recent XPCS studies on the Pd43Cu27Ni10P20 BMG Reference Evenson, Ruta, Hechler, Stolpe, Pineda, Gallino and Busch11 and also observed at low temperatures in hyperquenched metallic glass ribbons subjected to long annealing times. Reference Ruta, Chushkin, Monaco, Cipelletti, Pineda, Bruna, Giordano and Gonzalez-Silveira8,Reference Ruta, Baldi, Monaco and Chushkin10 This crossover into a stationary dynamics regime and subsequent lack of aging in metallic glasses on the atomic length scale is a result of configurational changes to the glassy structure, which run independently of macroscopic density changes. Reference Giordano and Ruta13 Within the energy landscape picture, Reference Debenedetti and Stillinger37,Reference Heuer38 this can be interpreted as the system being trapped in a local minimum of a potential energy basin, where it is nevertheless able to explore a local region of its configuration space, hence the full decay of g 2(q 0,t) within the experimental time window. This type of localized dynamics in metallic glasses has been explored in a recent simulation work. Reference Fan, Iwashita and Egami32
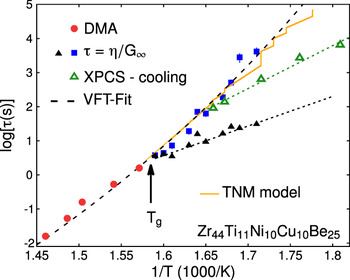
Lastly, to highlight the deviation of the microscopic dynamics from the expected evolution of the macroscopic τ, we apply a nonlinear relaxation model based on the Tool–Narayanaswamy–Moynihan (TNM) formalism Reference Tool39–Reference Moynihan, Macedo, Montrose, Gupta, DeBolt, Dill, Dom, Drake, Easteal, Elterman, Moeller, Sasabe and Wilder41 and compare sets of data taken using a range of macroscopic relaxation techniques with those obtained here using XPCS.
The values of τ for Zr44Ti11Ni10Cu10Be25 determined in the vicinity of T g are plotted in Fig. 5 as a function of inverse temperature. The filled circles are the results of DMA measurements and correspond to the temperature at which τ α is equal to the inverse of the applied test frequency, namely, τα = 1/ω. The filled square and filled triangle symbols were taken from equilibrium and nonequilibrium viscosities, respectively, determined in isothermal annealing experiments below T g using a three-point bending-method. Reference Evenson and Busch16
Structural relaxation times τ of Zr44Ti11Ni10Cu10Be25 as a function of inverse temperature. Equilibrium values in the supercooled liquid state were determined using DMA (filled circles). Equilibrium viscosities determined in beam-bending studies Reference Evenson and Busch16 were re-scaled using Eq. (3) to obtain τ (filled squares). The dashed line is a fit of the equilibrium data to Eq. (4). Values in the glassy state are measured directly using XPCS (open triangles) and re-scaled from nonequilibrium viscosity values (filled triangles). The short-dashed lines are guides for the eye only. The solid line is the expected course of τ according to the Tool–Narayanaswamy–Moynihan model [Eqs. (5) and (6)].

To calculate τ from the reported viscosity values, we use the Maxwell relation Reference Maxwell42
 $$\eta = \tau {G_\infty }\quad ,$$
where G ∞ is the high-frequency shear modulus. The value of G ∞ = 34.52 GPa was determined for the similar Vitreloy 4 alloy near its calorimetric T g. Reference Lind, Duan and Johnson43,Reference Johnson, Demetriou, Harmon, Lind and Samwer44 The measured value of G ∞ for metallic glasses not only depends on the temperature but also on t w and thermal history of the sample. Reference Lind, Duan and Johnson43–Reference Khonik, Mitrofanov, Khonik and Saltykov45 In general, we estimate that these effects would increase G ∞ by a maximum of around 10% at the lowest investigated temperatures. This uncertainty has been incorporated into our analysis; however, it is well within the error bars of the viscosity values reported in Ref. Reference Evenson and Busch16.
The values of τ measured at t w = 7 × 10³ s using XPCS (open triangles) are given alongside those calculated from glassy state viscosities using beam-bending (filled triangles) in Fig. 5. The departure from equilibrium occurs at a lower temperature in the XPCS experiments due to the quasi-static cooling rate of 1 K/min, in contrast to the heating rate of 25 K/min used in the beam-bending experiments. Reference Evenson and Busch16 Notwithstanding, the values of τ obtained in XPCS clearly display a similar temperature dependence as the macroscopic data, despite the presence of a small nanocrystalline volume fraction.
The temperature dependence of all equilibrium τ is very well described over the data range of some 6 orders of magnitude with the empirical Vogel–Fulcher–Tammann (VFT) equation Reference Vogel46–Reference Tammann and Hesse48
 $$\tau \left( T \right) = {\tau _0}\exp \left( {{{{D^*}{T_0}} \over {T - {T_0}}}} \right)\quad .$$
Keeping the value of τ0 fixed at 1 × 10⁻¹⁴ s, we obtain the fitting parameters D* = 25.4 ± 1.4 and T 0 = 358.2 ± 8.2 K. The fitted curve is given by the dashed line in Fig. 5.
Using the TNM model, the evolution of the fictive temperature Reference Tool39 T f is calculated as
 $${T_{\rm{f}}}\left( {T,t} \right) = T - \int_{{T_{eq}}}^T {dT'\exp \left[ { - {{\left( {\int_{T'}^T {{{dT''} \over {\dot T\tau (T,{T_{\rm{f}}})}}} } \right)}^\beta }} \right]} \quad ,$$
where T
eq is the starting T in equilibrium and
 $\dot T = {\rm{d}}T{\rm{/d}}t$
is the heating/cooling rate. In this model, the structural relaxation kinetics are assumed to follow a KWW form
 $\sim \exp \left[ { - {{\left( {t{\rm{/}}\tau } \right)}^{{\beta _{{\rm{TNM}}}}}}} \right]$
. The shape parameter βTNM in this case characterizes the width of the distribution of τ and, as such, 0 < βTNM ≤ 1. The above model assumes the validity of the time–temperature–superposition principle, requiring βTNM to be a constant in the temperature range of interest. Using the empirical relations established by Vilgis
Reference Vilgis49
and Böhmer et al.,
Reference Böhmer, Ngai, Angell and Plazek50
the KWW shape parameter is related to the VFT parameters via
 $\beta = 1 - \sqrt {{{\left( {{T_0}/{T_{\rm{g}}}} \right)}^2}{\rm{/}}{D^*}}$
. For Zr44Ti11Ni10Cu10Be25 this results in βTNM = 0.88, in good agreement with what is found in the equilibrium melt of similar compositions using quasi-elastic neutron scattering.
Reference Meyer, Wuttke, Petry, Peker, Bormann, Coddens, Kranich, Randl and Schober33–Reference Yang, Kordel, Holland-Moritz, Unruh and Meyer35
Various phenomenological equations have been used to describe the dependence of τ on both T and T f. Reference Hodge51 Here we employ a form of the equation derived by Scherer Reference Scherer52 and Hodge, Reference Hodge53
 $$\tau \left( {T,{T_{\rm{f}}}} \right) = {\tau _0}\exp \left[ {{{{D^*}{T_0}} \over {T\left( {1 - {{{T_0}} \mathord{\left/ {\vphantom {{{T_0}} {{T_{\rm{f}}}}}} \right. \kern-\nulldelimiterspace} {{T_{\rm{f}}}}}} \right)}}} \right]\quad ,$$
where the parameters τ0, D*, and T 0 are the same as in Eq. (4). It can be easily verified that the above expression reduces to Eq. (4) in the equilibrium case where T f = T.
The solid curve in Fig. 5 shows the expected evolution of τ calculated from Eqs. (5) and (6) according to the isothermal holding times and temperatures of our XPCS experiments. It is evident that, after departure from the equilibrium state, the TNM model predicts values of τ up to at least an order of magnitude larger than what is experimentally observed in XPCS. Moreover, the model clearly shows a return to equilibrium within the time scale of each isothermal hold, while the experimental XPCS data follow a temperature dependence indicative of the glassy state, as if little or no aging had taken place. This shows that, at least with our chosen set of input parameters, the TNM model fails to reproduce the evolution of the microscopic τ measured using XPCS and suggests the existence of a completely different mechanism of relaxation occurring at the atomic level. Similar results were also recently obtained during XPCS studies on a network-forming sodium silicate glass. Reference Ruta, Baldi, Chushkin, Rufflé, Cristofolini, Fontana, Zanatta and Nazzani54
The TNM and similar phenomenological models have had broad success in describing many aspects of structural relaxation in amorphous materials, although their inadequacies have also been well documented. Reference Narayanaswamy40,Reference Moynihan, Macedo, Montrose, Gupta, DeBolt, Dill, Dom, Drake, Easteal, Elterman, Moeller, Sasabe and Wilder41,Reference Hodge51,Reference O’Reilly55–Reference Simon and Bernazzani58 In the case of the XPCS experiments performed here, the failure of the TNM model is essentially due to the basic assumption that τ depends on the instantaneous state of the material via T f. This is an oversimplification as it considers that a given glassy configuration can be defined by a single parameter like T f or some macroscopic variable like specific volume or enthalpy and does not explicitly incorporate any microscopic details of the system under investigation. Thus, the unique out-of-equilibrium phenomena revealed by XPCS, such as an absence of atomic-level aging, compressed correlation functions, and stress-dominated dynamics, are not captured in these numerical models or in any current theory of the glassy state for that matter.
IV. CONCLUSION
We have investigated the atomic aging dynamics in partially crystallized and fully amorphous specimens of the Zr44Ti11Ni10Cu10Be25 BMG using XPCS. The microscopic dynamics in the two samples is characterized by a compressed decay of the intensity auto-correlation function and dominated by atomic-level stresses introduced during the formation of the glass. The structural relaxation in both samples exhibits a roughly constant shape factor 〈β〉 ∼ 1.5 and a time-temperature-waiting time superposition was found to hold, despite the asymmetry in thermal protocols. We have furthermore shown that the presence of approximately 5% frozen nanocrystals has no discernible effect on the microscopic dynamics and that the temperature dependence of τ measured in XPCS is in agreement with macroscopic viscosity data of the glass.
For almost all temperatures, τ was found to increase linearly with t w, in contrast to the fast exponential growth observed in hyperquenched metallic glass ribbons. This is likely an effect of the lower degree of atomic-level stresses, due to the orders of magnitude lower cooling rate used to produce the BMG specimen and to the multicomponent nature of the system. A regime of stationary dynamics was discovered in the vicinity of T g, where no apparent dependence of τ on t w was observed, reminiscent of the equilibrium state of the supercooled liquid, also marked by the lower value of the shape exponent β ≈ 1. Finally, we have shown that the microscopic τ evolves in the glassy state completely differently than what is expected from the TNM model. This result confirms that the microscopic aging and macroscopic aging apparently obey different mechanisms and a more detailed investigation of this discrepancy is currently underway.
ACKNOWLEDGMENTS
The authors would like to thank Ralf Busch for the use of the laboratory facilities to prepare the XPCS samples and Andy Waniuk for providing the sample material. ESRF is gratefully thanked for the financial support of the stay of A. Payes-Playa at beamline ID10. We would also like to thank Referee #1 for their insightful comments on the compressed exponential during the review stage of this manuscript.