I. INTRODUCTION
High-strength and high-conductivity (HSHC) copper alloys, which present not only high mechanical properties (tensile strength, elongation) and improved high-temperature behaviors but also excellent electrical conductivity, are widely applied as important structural and functional materials in many hi-tech fields, such as microelectronics, communications, transportation, and aerospace.Reference Li, Heuer, Stubbins and Edwards1–Reference Zhang and Song4Since mechanical property and electrical conductivity are a couple of contradicting factors, the central task of developing HSHC copper alloy is to solve the problem that how to improve the strength by a large margin with as little drop of electrical conductivity as possible. Therefore, element designing and preparation processes according to the actual demands gradually become the hot topics.Reference Zhao, Liu, Liu, Chen, Ma, Li and He5
Among several main series of copper alloys with HSHC, such as Cu–Ag,Reference Shen, Fu, Zhang, Kong, Zhang, Liu, Hu, Wang and Xie6 Cu–Mg,Reference Zilly, Christian, Kött, Nobiling and Jost7,Reference Wu8 Cu–Cr–Zr,Reference Sağlam, Özyürek and Çetinkaya9 Cu–Fe–P,Reference Lu, Wang, Zeng, Liu, Lu and Sun10 Cu–Ni–Si,Reference Monzen and Watanabe11 etc., Cu–Mg alloys are most used in contact wire materials in over 300 km/h high speed railway system in China, the properties of which are much better than that used in Germany or France.Reference Ruan and Xie12 Taking as an example, 120 mm2 Cu–Mg alloy contact wire presents a high strength over 500 MPa and a high electrical conductivity of 65%IACS. Discovering a small increase in resistivity and elongation yet a large increase in tensile strength of the copper alloy with trace Mg addition,Reference Maki, Ito, Matsumaga and Mori13 we use Te as the second main alloying element with emphasis on the Cu2Te precipitation strengtheningReference Louadi, Yassin, Bros and Castanet14 and the arc suppressing.
Although the property improvement methods have been widely proposed, systematic studies of some original impurity elements from the raw materials or involved during the melting process that would strongly affect the properties are quite few. Purification with the purpose of removing the low melt-point elements by rare earth elements will effectively improve the strength and conductivity for their active chemical characteristics.Reference Li, Xie, Zhu, Liu, Wu and Cheng15 Depending on the compound effects of rare earth and boron in the copper alloy, crystal grains are refined,Reference Lu, Wang, Lu, Liu, Xie and Sun16,Reference Zhuo, Ni and Sun17 and at the same time, properties are improved due to the elimination of impurity elements such as S, Pb, and Bi.Reference Zhou, Zhao, Zhao and Jin18
This paper is mainly concerned with the effects of trace rare earth yttrium and boron addition on element distributions, mechanical properties, electrical conductivity, and fracture morphologies of the present as-cast copper alloy. The aim of this work is to investigate the purification and precipitation effects of B and Y to optimize the properties of the present HSHC Cu–Mg–Te alloy.
II. EXPERIMENTS
Cu–Mg–Te alloys were melt in an SPZ-15 medium-frequency induction furnace with starting raw materials of small pieces of oxygen-free electronic copper (99.99 wt%), Cu–20 wt% Mg master alloy, Cu–66.7 wt% Te master alloy, Y (99.9 wt%), and CaB6 powders. The starting raw materials were melted sequentially in a graphite crucible. High purity argon was blown into the crucible to purify the liquid alloy before pouring. Using H13 hot work die steel as casting mold, Cu–Mg–Te alloys with different amounts of addition of B and Y were acquired, separately. The as-cast ingots were solution treated at 1123 K for 2 h in an electric resistance furnace and then hot rolled with a deformation rate of 70% at 1123 K and further 80% cold-rolled was processed at 298 K. Finally, the cold-rolled sheets were annealed at 623 K for 1 h.
The chemical composition of the alloys was analyzed using an XRF-1800 type of x-ray fluorescence spectrum analyzer, which is listed in Table II. Especially, the boron content was measured using a PE5300 type of inductively coupled plasma emission spectrometer. The element distribution was analyzed using an EPMA-1600 type of electro-probe microanalyzer (EPMA). Samples with a length of 70 mm were used for tensile strength testing at a strain rate of 2 mm/min using a CSS-2205 tensile machine at 298 K. The electrical conductivity of the samples was measured using a D60K digital electrical instrument, the gauge size of which is 20 × 20 × 10 mm. Three samples of the same number were tested, and the standard errors of the measured results were calculated. The fracture behaviors were observed using a JSM-5600LV type of scanning electron microscope (SEM).
III. RESULTS
A. Element distributions
Figures 1(a) and 1(b) show the comparison of distribution of element O between nonaddition and with B and Y addition as-cast Cu–Mg–Te alloy. It is obvious to see that under the field of view of the same magnification, the content of O is reduced with the compound effects of B and Y. As shown in Figs. 1(c) and 1(d), the sizes of crystal grains decreased with the addition of B and Y. The oxygen preferentially react with B or Y in the copper alloy. The results are in line with the theoretical calculation of the nominal oxide decomposition pressures as shown in Fig. 1(e), which will be analyzed in detail in Sec. IV later.
Deoxygenization function of B and Y in the Cu–Mg–Te alloy. (a) The oxygen distribution of Cu–0.6Mg–0.1Te; (b) the oxygen distribution of Cu–0.6Mg–0.1Te–0.1Y–0.03B; (c) the microstructure of Cu–0.6Mg–0.1Te; (d) the microstructure of Cu–0.6Mg–0.1Te–0.1Y–0.03B; and (e) the calculated nominal decomposition pressure of oxides in the copper liquid.

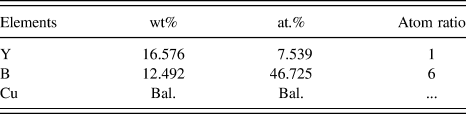
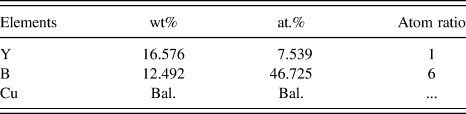
The EPMA images of distribution of major elements in the as-cast Cu–0.6Mg–0.1Te alloy are shown in Fig. 2. It can be seen that there are some Mg segregations inside the large crystal grain. But for the whole sample, we can infer a homogeneous distribution of Mg. Precipitations observed in the copper matrix can be classified into two groups, namely Cu–Te and Y–B compounds. Cu–Te intermetallic compounds (IMCs) are the main precipitated phases, but the low hardness of this phase limits the effects of precipitation strengthening because they cannot effectively block the motion of dislocations during deforming. The element distributions of both B and Y have no relationship with either Mg or Te. The element B shows an approximately aggregated tendency near the element Y. The content of B and Y listed in Table I is 6:1 in atom ratio.
Element distributions of as-cast Cu–0.6Mg–0.1Te–0.1Y–0.03B by EPMA.
The content ratio of Y–B compounds shown in Fig. 2.
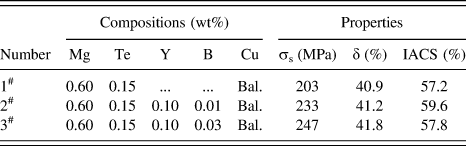
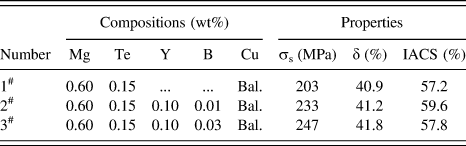
The compositions and the properties of Cu–Mg–Te alloys.
B. Mechanical and electrical properties
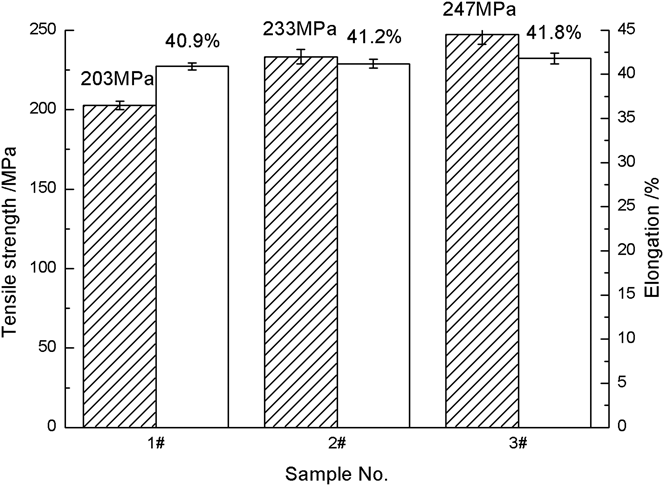
The mechanical properties of the as-cast Cu–Mg–Te alloys are shown in Fig. 3. It can be concluded that the tensile strength and elongation to fracture of the as-cast alloys are elevated significantly after adding B and Y. When the alloy contains 0.01 wt% B and 0.10 wt% Y, the tensile strength and elongation values are 233 MPa and 41.2%. The improving amplitudes reach 14.8% and 0.7%, respectively. When adding 0.03 wt% B and 0.10 wt% Y, the properties are optimal: tensile strength is up to 247 MPa, elongation is 41.8%, and the improving amplitudes reach 21.7% and 2.2%, respectively. The electrical conductivity of the copper alloy also increases from 57.2%IACS without addition to 59.6%IACS with 0.01 wt% B and 0.10 wt% Y. When the amount of B added is increased to 0.03 wt%, the increase in electrical conductivity is smaller than that with only 0.01 wt% B. Hence, the electrical conductivity can be improved superlatively by the amplitude of 4.2%.
Tensile strength and elongation to fracture of Cu–Mg–Te alloys depending on B and Y amounts.
The as-cast ingots were solution treated at 1123 K for 2 h and then hot rolled with a deformation rate of 70% at 1123 K and further 80% cold-rolled was processed at 298 K. Finally, the cold-rolled sheets were annealed at 623 K for 1 h.
After hot rolling, cold rolling, and annealing processes, the tensile strength of the copper alloy is increased up to 610.7 MPa with a sharp decrease of elongation. The electrical conductivity is accordingly reduced to 53.1%IACS.
C. Fracture morphology
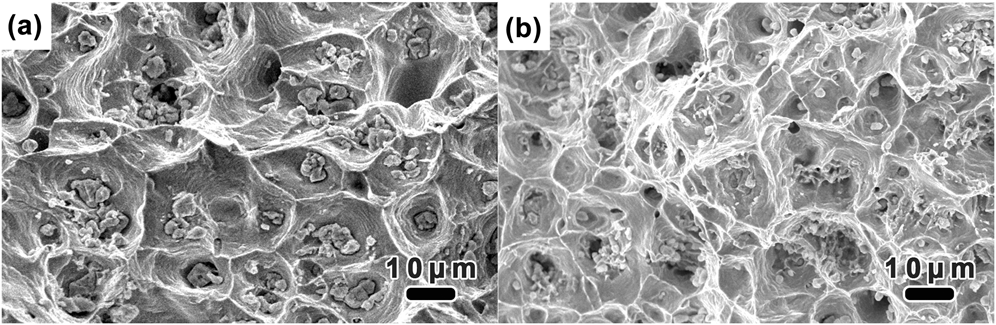
Figure 4 shows the SEM fracture morphologies of the tensile test specimen of as-cast Cu–Mg–Te alloys. The main fracture behavior is a typical ductile fracture. And the second phase particles were clearly observed inside the dimples. The average size of dimples of nonaddition copper alloy is about 20 μm, whereas the size is reduced to 12 μm after adding B and Y. Besides, precipitated particles in the dimples are also refined to some degree along with the increase of the degraded dimples.
Fracture morphologies of the Cu–Mg–Te alloy by SEM (a) Cu–0.6Mg–0.1Te and (b) Cu–0.6Mg–0.1Te–0.1Y–0.01B.
IV. DISCUSSION
A. Purification
As can be seen above, properties including tensile strength, elongation, and electrical conductivity are all improved to different degrees in the presence of B and Y.
Under atmospheric conditions, the casting process of copper alloys is oxygen sensitive, and Cu2O compounds are easily formed in the copper liquid, which will increase the resistivity of the alloy.Reference Ellis, Anderson, Downing and Verhoeven19 The reduction of oxygen content (shown in Fig. 3) is ascribed to the deoxygenization function of B and Y. To analyze the deoxygenization function, the decomposition pressures of the oxides correlating with chemical equilibrium constant would be addressed at the temperature region of melting.
At around 1373–1573 K of the present copper alloy liquid with the addition of B and Y, the following chemical equilibrium existed:
 $${\rm{2Y(s)}} + {3 \over 2}{{\rm{O}}_{\rm{2}}}{\rm{(g)}} = {{\rm{Y}}_{\rm{2}}}{{\rm{O}}_{\rm{3}}}{\rm{(}}{{\rm{s}}_{\rm{\alpha }}}{\rm{)}}\quad {\rm{,}}$$
 $${{\rm{Y}}_{\rm{2}}}{{\rm{O}}_{\rm{3}}}{\rm{(}}{{\rm{s}}_{\rm{\alpha }}}{\rm{)}} = {{\rm{Y}}_{\rm{2}}}{{\rm{O}}_{\rm{3}}}{\rm{(}}{{\rm{s}}_{\rm{\beta }}}{\rm{)}}\quad {\rm{,}}$$
 $${\rm{2B(s)}} + {3 \over 2}{{\rm{O}}_{\rm{2}}}{\rm{(g)}} = {{\rm{B}}_{\rm{2}}}{{\rm{O}}_{\rm{3}}}{\rm{(s)}}\quad {\rm{,}}$$
 $${{\rm{B}}_{\rm{2}}}{{\rm{O}}_{\rm{3}}}{\rm{(s)}} = {{\rm{B}}_{\rm{2}}}{{\rm{O}}_{\rm{3}}}{\rm{(l)}}\quad {\rm{.}}$$
At standard state, supposing  ${a_{\rm{D}}} = {a_{{{\rm{D}}_{\rm{2}}}{{\rm{O}}_{\rm{3}}}}} = 1$, where D stands for B and Y, the chemical equilibrium constant can be described as
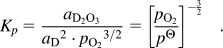 $${K_p} = {{{a_{{{\rm{D}}_{\rm{2}}}{{\rm{O}}_{\rm{3}}}}}} \over {{a_{\rm{D}}}^2 \cdot {p_{{{\rm{O}}_{\rm{2}}}}}^{{3 \mathord{\left/ {\vphantom {3 2}} \right. \kern-\nulldelimiterspace} 2}}}} = {\left[ {{{{p_{{{\rm{O}}_{\rm{2}}}}}} \over {{p^\Theta }}}} \right]^{ - {3 \over 2}}}\quad .$$
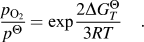
According to the standard state van't Hoff isothermal equation, the relationship of the standard Gibbs free energy change and the oxygen partial pressure, which is equivalent to the oxide decomposition pressure is
 $$\Delta G_T^\Theta = - RT\,\ln \,{K_p} = {3 \over 2}RT\ln \left[ {{{{p_{{{\rm{O}}_{\rm{2}}}}}} \over {{p^\Theta }}}} \right]\quad .$$
By referring to the Thermodynamic Data Handbook,Reference Ye and Hu20 we have separately calculated the standard Gibbs free energy change of the equilibria in the copper liquid by
 $$\Delta G_T^\Theta = \Delta H_T^\Theta - T\Delta S_T^\Theta \quad ,$$
 $${{{p_{{{\rm{O}}_{\rm{2}}}}}} \over {{p^\Theta }}} = \exp {{2\Delta G_T^\Theta } \over {3RT}}\quad .$$
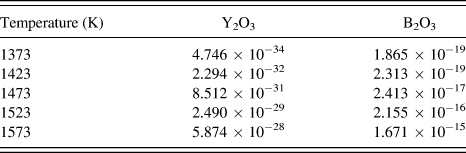
With the method above, taking the phase transformation into consideration, we have calculated the oxide decomposition pressures of B2O3 andY2O3, respectively, which are listed in Table III. In the same way, we present the relationships correlating the oxide decomposition pressure with temperatures of Cu2O, B2O3, andY2O3 altogether as shown in Fig. 1(e). It should be emphasized that the absolute values of the oxide decomposition pressure are of no significance of the definition, and we are only concerned with the relative position of the three oxides. It is precisely the relatively low oxide decomposition pressures of B and Y that protect the copper liquid from undue oxidation.
The calculated oxide decomposition pressures of Y2O3 and B2O3 (Pa).
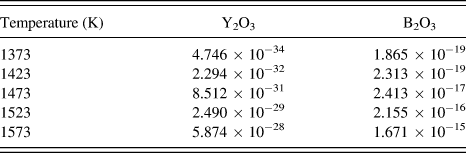
As is seen from Table III that at around the melting temperature of the present copper alloy with addition of B and Y, the oxide decomposition pressure of Y2O3 is far less than that of B2O3, indicating that element Y has merits over B for deoxygenation. Besides, Y is more sensitive than B, so the content of B in the copper liquid can be stabilized by adding Y. During the melting process, with the addition of B and Y, the deoxidant would preferentially react with oxygen, generating oxides floating up. In this way, the copper liquid was purified and the electrical conductivity of the copper alloy was improved.
In addition, Y would also react with some other low melting-point impurities and generate stable compounds tending to float up from the liquid. The rest compounds would also distribute in the matrix as the heterogeneous nucleation sites, which can improve the mechanical properties of the copper alloys.
Its worth noting that superfluous addition of B and Y will decrease the flowability of the copper alloy liquid going against for casting and mold filling. The segregation of excessive boride will do a lot harm to the electrical conductivity of the copper alloy.Reference Wang, Jiang and Li21
B. Properties improving mechanism
The comparison of enthalpy of mixing is shown in Fig. 5. Of all the elements added to the copper alloy, elements B and Y have the largest enthalpy of mixing, the value of which is −35 kJ/mol, indicating that the attracting trend between those two element atoms is the strongest and hence the aggregation of B and Y shown in Fig. 2 is explained. Combined with Y–B binary phase diagram, the YB6 compounds, which have a higher melting point (2873–3073 K) than the copper alloy, must have formed and uniformly distributed in the copper matrix during solidification. When the copper liquid freezes, YB6 compound finer particles in the melt serve as heterogeneous nucleation sites as observed at the bottom of the fracture dimples (shown in Fig. 4). Microvoids form when a high stress causes the separation of the copper matrix at the interfaces between the matrix and small particle phases. As the local stress increases, the microvoids grow and coalesce into larger cavities. Eventually, the contact area is too small to support the load, and fracture occurs. The dimples finally form leaving the particles at the central bottom. Plenty of particles promote the nucleation of dimples. Unlike the coarse and soft Cu–Te particles, Y–B tiny particles is stronger enough to offer effective obstacles to dislocation movement, thus providing the dispersion strengthening mechanism. Last but not least, purification effects of B and Y are also beneficial to the strengthening of the copper alloy.
The comparison of enthalpy of mixing of additive elements in the Cu–Mg–Te alloy (kJ/mol).
The electrical conductivity is affected by B and Y addition because of the predominant purification function. As we have calculated the decomposition pressure of the different oxides in the copper melt, we find that the copper is more difficult to oxidize after adding B and Y. The added B or Y that are more active than copper will preferentially react with oxygen protecting the copper from being oxidized. Impurities such as copper oxides are reduced. Since the electrical conductivity is purity sensitive, it is increased after the melt is purified.
V. CONCLUSIONS
(1) In the copper liquid, the additive elements B and Y are very active to react with impurities such as oxygen for improving the purity of the copper liquid. The boron oxide is more stable than the yttrium oxide in the copper liquid since the oxide decomposition pressure of B2O3 is far larger than that of Y2O3, indicating the superior deoxygenization purification of the rare earth yttrium.
(2) When the copper liquid freezes, YB6 compound finer particles in the melt serve as heterogeneous nucleation sites, which were observed at the bottom of the dimples. This produces a large number of grains and provides grain size strengthening.
(3) The mechanical properties are improved because of the addition of yttrium and boron: tensile strength is up to 247 MPa, elongation is 41.8%, and the improving amplitudes reach to 21.7% and 2.2%, respectively. The electrical conductivity can be improved superlatively by the amplitude of 4.2%. After hot rolling, cold rolling, and annealing processes, the final properties of the copper alloy meet the target of HSHC with the tensile strength of 610.7 MPa and the electrical conductivity of 53.1%IACS.
ACKNOWLEDGMENTS
This research is financially supported by the National Natural Science Foundation of China (Grant No. 50875031) and the Aviation Science Foundation of China (Grant No. 20095263005).