1. Introduction
The so-called jetting or fingering instabilities of dense granular media arise from the destabilized granular surfaces impinged by shock/blast waves (Milne, Parrish & Worland Reference Milne, Parrish and Worland2010; David et al. Reference David, Yann, Oren, Samuel and Fan2012; Rodriguez et al. Reference Rodriguez, Saurel, Jourdan and Houas2013; Xue, Li & Bai Reference Xue, Li and Bai2013; Milne et al. Reference Milne, Floyd, Longbottom and Taylor2014; Kandan et al. Reference Kandan, Khaderi, Wadley and Deshpande2017; Frost Reference Frost2018; Xue et al. Reference Xue, Du, Shi, Gan and Bai2018). These instabilities have a fundamental bearing on a range of natural phenomena and engineering processes, particularly supernova explosions (Inoue, Yamazaki & Inutsuka Reference Inoue, Yamazaki and Inutsuka2009), volcanic eruptions (Formenti, Druitt & Kelfoun Reference Formenti, Druitt and Kelfoun2003) and laser-driven inertial confinement fusion experiments (Aglitskiy et al. Reference Aglitskiy2010). The resulting particle fingers protruding into gases, reminiscent of the heavy-fluid ‘spikes’ thrusting into a light fluid generated by the conventional Richtmyer–Meshkov instability (RMI) (Luo et al. Reference Luo, Li, Ding, Zhai and Si2019; Li et al. Reference Li, Ding, Si and Luo2020; Zhang et al. Reference Zhang, He, Xie, Xiao and Tian2020; Zhou et al. Reference Zhou2021), inspire investigators to draw a parallel between the shock-driven particle jetting behaviour and the RMI (Vorobieff et al. Reference Vorobieff, Anderson, Conroy, White, Truman and Kumar2011; McFarland et al. Reference McFarland, Black, Dahal and Morgan2016; Osnes, Vartdal & Pettersson Reif Reference Osnes, Vartdal and Pettersson Reif2017; Fernández-Godino et al. Reference Fernández-Godino, Ouellet, Haftka and Balachandar2019; Koneru et al. Reference Koneru, Rollin, Durant, Ouellet and Balachandar2020; Duke-Walker et al. Reference Duke-Walker, Maxon, Almuhna and McFarland2021). Indeed, the shock-driven multiphase instability (SDMI), a variant of the RMI arising from the shock-accelerated perturbed interface between multiphase fluid mixtures of different effective densities, is responsible for the jetting instability of particles that have been explosively dispersed and mixed with gases (Osnes et al. Reference Osnes, Vartdal and Pettersson Reif2017; Fernández-Godino et al. Reference Fernández-Godino, Ouellet, Haftka and Balachandar2019; Koneru et al. Reference Koneru, Rollin, Durant, Ouellet and Balachandar2020).
During SDMI evolution, the equilibration time between particles and gases is shorter than the characteristic hydrodynamic time scale; therefore, a quite low particle volume fraction, normally ϕp < 1 %, is required (McFarland et al. Reference McFarland, Black, Dahal and Morgan2016; Duke-Walker et al. Reference Duke-Walker, Maxon, Almuhna and McFarland2021). Evidently, this is not the case for the interfacial instabilities of dense granular media observed in experiments where the shock-loaded particles remain closely packed (Rodriguez et al. Reference Rodriguez, Saurel, Jourdan and Houas2013; Kandan et al. Reference Kandan, Khaderi, Wadley and Deshpande2017; Xue et al. Reference Xue, Du, Shi, Gan and Bai2018, Reference Xue, Shi, Zeng, Tian, Han, Li, Liu, Meng, Guo and Bai2020). Interfacial granular flows rather than gaseous flows laden with particles result in interfacial instabilities. We hence refer to this interfacial instability as shock-driven granular instability (SDGI) to distinguish it from the RMI and SDMI.
In contrast with the RMI and SDMI, the initiation of the SDGI needs to satisfy a certain instability criterion (Kandan et al. Reference Kandan, Khaderi, Wadley and Deshpande2017). Modelling granular materials as an isotropic elastic non-hardening Drucker–Prager solid, Kandan et al. (Reference Kandan, Khaderi, Wadley and Deshpande2017) recognized that the instability criterion of the SDGI is equivalent to the Drucker–Prager yield criterion. However, the continuum approximation of granular materials is called into question due to the transient and non-equilibrium coupling between the interstitial gas phase and the particle skeleton in this scenario (Ben-Dor et al. Reference Ben-Dor, Britan, Elperin, Igra and Jiang1997; Britan, Shapiro & Ben-Dor Reference Britan, Shapiro and Ben-Dor2007; DeMauro et al. Reference DeMauro, Wagner, DeChant, Beresh and Turpin2019). Previous studies revealed a complex wave spectrum inside a granular medium impinged head-on by an incident shock wave (Ben-Dor et al. Reference Ben-Dor, Britan, Elperin, Igra and Jiang1997; Britan et al. Reference Britan, Shapiro and Ben-Dor2007; Mo et al. Reference Mo, Lien, Zhang and Cronin2018, Reference Mo, Lien, Zhang and Cronin2019; Koneru et al. Reference Koneru, Rollin, Durant, Ouellet and Balachandar2020). Specifically, a much weakened transmitted wave is trailed by a compaction wave propagating through contact points between particles. In addition, the shock-induced gas flows through pores and interacts with the compaction wave, contributing to the evolution of the granular dynamics and a pressure field inside particles (Mo et al. Reference Mo, Lien, Zhang and Cronin2018, Reference Mo, Lien, Zhang and Cronin2019). Han, Xue & Bai (Reference Han, Xue and Bai2021) found that a consistent rheology model that can adequately account for the dense granular flows underpinned by transient interphase coupling does not exist. Thus, to gain an in-depth understanding of the SDGI, it is necessary to properly consider the interactions between the shock and particles, between particles and interstitial flows and between the particles themselves.
Our previous study investigated the SDGI of a thin particle ring driven by a central explosion, revealing a marked correlation between the perturbation growth regimes and the compaction/decompaction of the granular bulk, which is absent in the SDMI (Xue et al. Reference Xue, Shi, Zeng, Tian, Han, Li, Liu, Meng, Guo and Bai2020). However, the coupling between the shock-induced flows and particles only exists during the very early instants since the fast-expanding particle ring soon leaves the central high-pressure gases behind. This case only involves the minimum effects of shock-induced interstitial gas flows during most of the time of perturbation growth.
The present work aims to gain insights into both the perturbation growth law and the underlying physics of SDGIs in a more general scenario, wherein the coupling between shock-induced flows and particles is persistent throughout. A series of numerical shock tube experiments involving a range of structural parameters are carried out via the coarse-grained compressible computational fluid dynamics–discrete parcel method (CCFD-DPM), which incorporates four-way interphase coupling and can resolve particle-scale flow details (Sundaresan, Ozel & Kolehmainen Reference Sundaresan, Ozel and Kolehmainen2018; Tian et al. Reference Tian, Zeng, Meng, Chen, Guo and Xue2020). The results reveal a three-stage growth law of the SDGI for granular media with finite length. We proceed to identify the corresponding mechanisms responsible for driving the respective growth stage and put forward theoretical models accounting for the growth characteristics of the first and third growth phases. An instability criterion that relates two competing processes controlling growth initiation is proposed, shedding particle-scale light on the macroscale instability criterion established by Kandan et al. (Reference Kandan, Khaderi, Wadley and Deshpande2017). More importantly, after a proper scaling time with a characteristic time scale of the SDGI, the perturbation growth data derived from different numerical experiments collapse into a single curve, whereby a scaling law is derived.
The paper is organized as follows. The numerical method and set-up are introduced in §§ 2 and 3, respectively. The perturbation growth laws of the SDGI and the corresponding evolution of shock-loaded granular media are elaborated in § 4. Then, § 5 reveals the primary driving mechanisms and their respective contributions to the distinct growth phases of the SDGI. Theoretical models are introduced to account for instability initiation and perturbation growth characteristics. Section 6 presents the scaling law of the SDGI using a proper non-dimensionalization method. Finally, the results are summarized in § 7.
2. Numerical method
Numerical simulations were conducted based on CCFD-DPM, a coarse-grained Euler–Lagrange numerical approach suitable for gas– particle flows in laboratory-scale systems (Sundaresan et al. Reference Sundaresan, Ozel and Kolehmainen2018; Koneru et al. Reference Koneru, Rollin, Durant, Ouellet and Balachandar2020). The CCFD-DPM approach tracks and accounts for parcel–parcel contact interactions. Each parcel consists of multiple physical particles with the same physical and kinetic properties. The number of real particles that represents a computational parcel is quantified using a scaling factor called the superparticle loading, χ, whose value is set based on the volume/mass fraction of the particles and computational memory available. For particle–gas systems, χ reported in previous literature ranges from O(101) to O(103) (Osnes et al. Reference Osnes, Vartdal and Pettersson Reif2017; Koneru et al. Reference Koneru, Rollin, Durant, Ouellet and Balachandar2020; Xue et al. Reference Xue, Shi, Zeng, Tian, Han, Li, Liu, Meng, Guo and Bai2020). In the present work, χ is of O(101).
For the gas phase, the volume-averaged governing equations, (2.1)–(2.3), constructed in the Eulerian frame are based on a five-equation transport model, i.e. a simplified form of the Baer–Nunziato model (Baer & Nunziato Reference Baer and Nunziato1986), which has been modified to account for compressible multiphase flows ranging from dilute to dense gas– particle flows (Carmouze et al. Reference Carmouze, Saurel, Chiapolino and Lapebie2020; Chiapolino & Saurel Reference Chiapolino and Saurel2020):
 \begin{gather}\frac{{\partial ({\phi _f}\langle {\rho _f}\rangle )}}{{\partial t}} + \boldsymbol{\nabla }\boldsymbol{\cdot }({\phi _f}\langle {\rho _f}\rangle {\boldsymbol{\tilde{u}}_f}) = 0,\end{gather}
 \begin{gather}\dfrac{{\partial ({\phi _f}{{\boldsymbol{\tilde{u}}}_f}\langle {\rho_f}\rangle )}}{{\partial t}} + \boldsymbol{\nabla }\boldsymbol{\cdot }({\phi _f}\langle {\rho_f}\rangle {{\boldsymbol{\tilde{u}}}_f}{{\boldsymbol{\tilde{u}}}_f} + {\phi _f}\langle {P_f}\rangle )\nonumber\\
\qquad\qquad = \langle {P_f}\rangle \nabla {\phi _f} + \sum\limits_i {\{ {\phi _{p,i}}{\rho _{p,i}}{D_{p,i}}({{\boldsymbol{\tilde{u}}}_{p,i}} - {{({{\boldsymbol{\tilde{u}}}_f})}_i})\} } , \end{gather}
 \begin{gather}\dfrac{{\partial ({\phi _f}\langle {\rho_f}\rangle {{\tilde{E}}_f})}}{{\partial t}} + \boldsymbol{\nabla }\boldsymbol{\cdot }({\phi _f}\langle {\rho_f}\rangle {{\tilde{E}}_f}{{\boldsymbol{\tilde{u}}}_f} + {\phi _f}\langle {P_f}\rangle {{\boldsymbol{\tilde{u}}}_f})\nonumber\\
\quad\qquad\qquad = \langle {P_f}\rangle \boldsymbol{\nabla }{\phi _f}\boldsymbol{\cdot }{{\boldsymbol{\tilde{u}}}_p} + \sum\limits_i {\{ {\phi _{p,i}}{\rho _{p,i}}{D_{p,i}}({\boldsymbol{u}_{p,i}} - {{({{\boldsymbol{\tilde{u}}}_f})}_i})\boldsymbol{\cdot }{{\boldsymbol{\tilde{u}}}_{p,i}}\} }. \end{gather}
The gas volume fraction, density, velocity and pressure and the total energy of the gas are represented by ϕf, uf, ρf, Pf and Ef (Ef = ρf ef + 0.5ρf uf uf), respectively. In (2.1)–(2.3)  $\langle \square \rangle $ and
 $\tilde{\square }$ denote phase-averaged and mass-averaged variables, respectively; ρp.i and up ,i are the density and velocity of parcel i, Dp ,i is the drag force coefficient of parcel i and ϕp.i = wi ,f Vp ,i/Vf is the contribution of parcel i to the weighted particle volume fraction (wi ,f is the distributed weight that parcel i contributes to the particle volume fraction in fluid cell f, and Vp ,i and Vf are the volumes of parcel i and the fluid cell).
We employ the Di Felice model combined with Ergun's equation to calculate Dp, which is essentially a nonlinear drag force model (Di Felice Reference Di Felice1994). The Di Felice model combined with Ergun's equation, which considers the effects of both the particle Reynolds number, Rep, and the particle phase volume fraction, ϕp, has been widely used in particle-laden multiphase flows. Drag force coefficient Dp is a function of Rep and ϕp:
 \begin{gather}{D_{p,i}} = \frac{3}{{8sg}}{C_d}\frac{{|{{\boldsymbol{u}_f} - {\boldsymbol{u}_{p,i}}} |}}{{{r_p}}},\end{gather}
 \begin{gather}{C_{d}} =\frac{24}{{\rm Re}_{p}}= \left\{ {\begin{array}{@{}ll} 8.33 \frac{\phi_{p}}{\phi_{f}}+0.0972 {\rm Re}_{p}&\quad {\rm if}\;\phi_{f}<0.8\\ f_{base} \cdot \phi_{f}^{\zeta} &\quad {\textrm{if}\;\phi_{f} \geq 0.8}, \end{array}} \right.\end{gather}
 \begin{gather}{f_{base}} = \left\{ {\begin{array}{@{}ll} {1 + 0.167Re_p^{0.687}}&{\textrm{if}\;R{e_p} < 1000}\\ {0.0183R{e_p}}&{\textrm{if}\;R{e_p} \ge 1000,} \end{array}} \right.\end{gather}
 \begin{gather}\zeta = 3.7 - 0.65\,\textrm{exp}[ - {\textstyle{1 \over 2}}{(1.5 - {\log _{10}}R{e_p})^2}],\end{gather}
where Cd is the dimensionless coefficient of the drag force, sg is the specific weight of individual particles and rp is the particle radius. For dense particle flows (ϕf < 0.8), (2.4) reduces to the original Ergun equation. Otherwise, Cd takes the form of the Stokes law multiplied by a factor of fbase, which varies with Rep, as indicated by (2.6) and (2.7).
The particle phase is represented by discrete parcels whose motion is governed by Newton's second law (equations (2.8) and (2.9)):
 \begin{gather}\frac{{\textrm{d}{\boldsymbol{u}_{p,i}}}}{{\textrm{d}t}} = {D_{p,i}}({\boldsymbol{u}_f} - {\boldsymbol{u}_{p,i}}) - \frac{1}{{{\rho _p}}}\boldsymbol{\nabla }\langle {P_f}\rangle + \frac{1}{{{m_p}}}\sum\limits_j {{\boldsymbol{F}_{C,ij}}} ,\end{gather}
 \begin{gather}\frac{{\textrm{d}\kern0.06em {\boldsymbol{x}_{p,i}}}}{{\textrm{d}t}} = {\boldsymbol{u}_{p,i}},\end{gather}
where up ,i and xp ,i denote the velocity and displacement of parcel i, respectively, and FC ,ij represents the collision force between parcels i and j.
A four-way coupling strategy (Ukai, Balakrishnan & Menon Reference Ukai, Balakrishnan and Menon2010) was adopted to account for the momentum and energy transfer between gases and particles. Specifically, the particle drag force and the associated work were incorporated into the momentum equation (2.2) and energy equation (2.3) of the gas phase as the source terms. The particle parcels are driven by the pressure gradient force, drag force and collision force between parcels (equation (2.8)). A soft sphere model, represented by a coupling spring and dashpot, was employed to model the collision force between parcels (Apte, Mahesh & Lundgren Reference Apte, Mahesh and Lundgren2003). The term FC ,ij hence consists of a repulsive force and a damping force:
 \begin{equation}{\boldsymbol{F}_{C,ij}} = {k_{n,p}}{\boldsymbol{\delta}_n} - {\gamma _{n,p}}{\boldsymbol{u}_{n,ij}},\end{equation}
where kn ,p and γn ,p are the stiffness and damping coefficients of parcels and δn and un ,ij are the overlap and normal velocity difference between parcels in contact. Here γn ,p is a function of the parcel restitution coefficient  $\varepsilon_p$ (Crowe et al. Reference Crowe, Schwarzkopf, Sommerfeld and Tsuji2012):
 \begin{equation}{\gamma _{n,p}} ={-} \frac{{2\,\textrm{ln}\,{\varepsilon_p}}}{{\sqrt {{{\rm \pi} ^2} + \ln \,{\varepsilon _p}} }}\sqrt {{m_p}{k_{n,p}}} .\end{equation}
To solve the equations governing the gases, the weighted essentially non-oscillatory (Liu, Osher, & Chan, Reference Liu, Osher and Chan1994) scheme was used to reconstruct the primary flow variables. A Riemann solver proposed by Harten, Lax & van Leer (Toro, Reference Toro2009) was used to obtain the intercell fluxes. The third-order Runge–Kutta method was applied for the time integration. The equations describing the parcel velocity and position were discretized by the velocity-Verlet algorithm (Kruggel-Emden et al. Reference Kruggel-Emden, Sturm, Wirtz and Scherer2008). Bilinear/trilinear interpolation functions were adopted to calculate the particle volume fraction and source terms on the Eulerian grids, as well as the fluid variables on Lagrangian parcels. Numerical details with regard to CCFD-DPM can be found in our previous works (Meng et al. Reference Meng, Zeng, Tian, Li, He and Guo2019; Tian et al. Reference Tian, Zeng, Meng, Chen, Guo and Xue2020; Xue et al. Reference Xue, Shi, Zeng, Tian, Han, Li, Liu, Meng, Guo and Bai2020). The present CCFD-DPM framework has been validated against Rogue's experiments involving shock waves propagating through particle curtains (Tian et al. Reference Tian, Zeng, Meng, Chen, Guo and Xue2020), shock tube experiments wherein particle columns are impinged head-on by incident shocks (Tian et al. Reference Tian, Zeng, Meng, Chen, Guo and Xue2020) and shock dispersion of particle rings (Xue et al. Reference Xue, Shi, Zeng, Tian, Han, Li, Liu, Meng, Guo and Bai2020).
3. Simulation set-up
3.1. Problem set-up
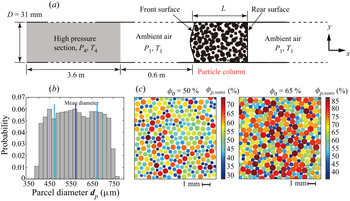
The shock-tube-based set-up, which has been widely used to investigate the RMI and the SDMI (McFarland et al. Reference McFarland, Black, Dahal and Morgan2016; Kandan et al. Reference Kandan, Khaderi, Wadley and Deshpande2017; Luo et al. Reference Luo, Li, Ding, Zhai and Si2019; Li et al. Reference Li, Ding, Si and Luo2020), serves as an archetypical system to investigate the initiation and growth of the SDGI for granular columns impinged head-on by incident shocks. As presented in figure 1(a), a stationary granular column with a length of L is placed at the driven section of the shock tube at atmospheric pressure, P 1, and ambient temperature. High-pressure gases with pressure P 4 and temperature T 4 fill the driver section of length L 4 = 3.6 m at the left-hand end of the tube. The front surface of the granular column is 0.6 m away from the interface between the driver and driven sections. By varying the values of P 4 and T 4, we generate incident shocks with different Mach numbers.
(a) Schematic diagram of the shock tube set-up in the numerical experiments. (b) Histogram of the parcel diameter distribution. (c) Close-up images of initial particle packing coloured by the local particle volume fraction calculated using Voronoi tessellation. Left: ϕ 0 = 50 %; right: ϕ 0 = 65 %.

In addition to the two baseline cases wherein the surfaces of granular columns remain planar and smooth, we introduce a single-mode sinusoidal perturbation into the front surface to examine the effect of the initial perturbation amplitude. The disturbed surface can be parameterized as x = x 0 + a 0 cos(πy/λ), where x 0 refers to the mean x coordinate of the front interface, a 0 to the initial amplitude and λ to the wavelength and λ = D (the tube width) in the present work.
The granular column domain is filled by computational parcels generated by the radius expansion algorithm. This method is applied to generate a cloud of parcels within a given region. A population of parcels with artificially small radii that ensures no particle or wall overlap is randomly created within the specified volume. Then, all parcels are expanded until the specified particle size distribution and desired porosity are satisfied (Yan, Yu & Mcdowell Reference Yan, Yu and Mcdowell2009). The real particle has a diameter of 100 μm, while the diameter of the parcel uniformly ranges from 400 to 750 μm (see the histogram of the parcel diameter distribution in figure 1b) to avoid potential crystallization during shock compaction. Figure 1(c) shows close-up images of particle columns with ϕ 0 = 0.5 and 0.65 wherein the particles are coloured by the parcel-scale particle volume fraction, ϕp ,voro, calculated using Voronoi tessellation. A random but homogeneous arrangement of parcels is achieved regardless of the overall volume fraction. The parcel has a density of 2500 kg m−3 as do the real particles. The restitution coefficient, εp, is set to be 0.6, which considers the energy dissipation inside the parcel; the normal stiffness of contacts between parcels is set to be 2.25 × 10⁷ N m−1.
3.2. Initial conditions
Previous experimental and numerical studies found that the momentum imparted to shock-loaded granular columns plays a predominant role in the subsequent jetting structures (Kandan et al. Reference Kandan, Khaderi, Wadley and Deshpande2017; Koneru et al. Reference Koneru, Rollin, Durant, Ouellet and Balachandar2020; Xue et al. Reference Xue, Shi, Zeng, Tian, Han, Li, Liu, Meng, Guo and Bai2020). The imparted momentum strongly depends on the shock strength and the length (mass) of granular columns. As the primary reflected shock acts stably and continuously on the front surface of the granular column, its pressure (Pr), which represents the shock strength more directly, is chosen to be one of the primary parameters to investigate together with the length of the granular columns, L. Since the pressure gradient field governing the particle dynamics after the shock interaction is a function of the porosity, or equivalently the particle volume fraction (Britan et al. Reference Britan, Shapiro and Ben-Dor2007), the initial particle volume fraction, ϕ 0, is also among the investigated parameters. Finally, we examine the influence of the amplitude of the initial interfacial perturbation, a 0.
Two baseline cases involve particle columns (ϕ 0 = 50 % and 65 %) with planar front surfaces. They serve to demonstrate the evolution of after-shock flows and shock-loaded particle columns with the minimum interference of the interfacial perturbation. The numerical cases, except the baseline cases, are grouped into four categories (see table 1), which are intended to investigate the effects of the shock strength (Group $\_$P), the length of the granular column (Group
 $\_$L), the initial particle volume fraction (Group
 $\_$ϕ 0) and the amplitude of the initial perturbation (Group
 $\_$a 0/D).
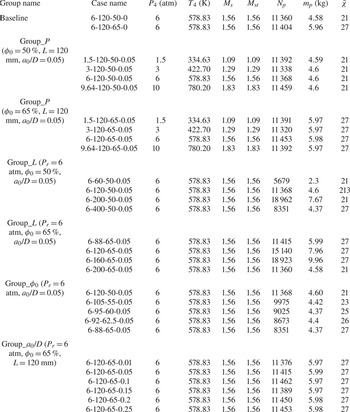
Parameters in each numerical case. The case name consists of the values of the four variables in the sequence of the reflected pressure upon the granular interface, Pr (in units of atm), the length of granular column, L (in units of mm), the initial particle volume fraction, ϕ 0 (in units of %), and the ratio between the amplitude of initial perturbation and the wavelength (diameter of tube), a 0/D. Parameters P 4 and T 4 denote the pressure and temperature of the high-pressure driver section, respectively; Ms and Mst are obtained from the simulations and normal shock relations, respectively; Np, mp and  $\bar{\chi }$ denote the total number of parcels, the mass per unit length along the z coordinate and the averaged superparticle loading, respectively.

Table 1 summarizes the initial conditions of all cases, in which the cases are labelled by four symbols, Pr (in units of atm), L (in units of mm), ϕ 0 (in units of %) and a 0/D. In table 1, Mst represents the incident shock Mach number calculated by the normal shock relationships for an ideal gas using the imposed P 4 and T 4, while Ms is derived from the simulations. The good agreement between Mst and Ms validates the CCFD solver of our CCFD-DPM framework. Parameter mp denotes the mass per unit length (in units of m) along the z coordinate since the systems are two-dimensional. For each case, the average superparticle loading,  $\bar{\chi }$, is calculated by averaging over all parcels with varied diameters.
In this study, the time step for the CCFD module was determined by the Courant–Friedrichs–Lewy number, which was set to 0.25 to ensure numerical stability. In high-Mach-number flows, the characteristic time is several microseconds, which is of the same order of magnitude as that of the particle–particle collisions. Thus, the time step for the DPM module was set to be the same as that for the CCFD module.
4. Results
4.1. Wave diagrams for shock interaction with granular columns in shock tubes
Figure 2 shows a typical space–time (x–t) diagram depicting the trajectories of various waves outside and inside the granular columns for the baseline case 6-120-65-0 as a reference for other cases. At t = 0, an incident shock (IS) of Ms = 1.56 originating from the interface between the driver and driven sections (x = 0) propagates rightward towards the granular column. For convenience, we hence define the positive direction of the x axis as ‘upstream’ and the negative direction as ‘downstream’. Meanwhile, a contact surface trails behind the IS, and a rarefaction fan propagates downstream. When the IS impinges head-on upon the front surface of the granular column, a primary reflected shock travels downstream as a transmitted wave (TW) propagates into the column, which is a compression wave rather than a shock wave. This compression wave goes through the whole column, passes across the rear surface (RS) and keeps propagating upstream. The TW is followed by induced gas flows and a compaction wave (CW), both contributing to the shock compaction of particles. The CW, rising from continuous compaction of the granular column, aiming at the solid phase, makes the local particle volume fraction increase where its front passes and propagates only inside the granular column. As it is not able to go through the RS, it proceeds to reflect off the RS and travels downstream as a rarefaction wave, accelerating and dilating the compacted particles in its wake. It is worth noting that multiple compaction waves (CW2 in figure 2) and rarefaction waves (RW2 in figure 2) alternately reverberate through the particle column with decreasing intensities whose origin is discussed below.
The space–time (x–t) diagram of the complex wave spectrum outside and inside granular columns impinged head-on by a planar incident shock for baseline case 6-120-65-0. IS, incident shock; RF, rarefaction fan; CS, contact surface; TW, transmitted wave; PRS, primary reflected shock; CW1, first compact wave; RW1, first rarefaction wave; CW2, second compact wave; RW2, second rarefaction wave; FS, front surface; RS, rear surface.

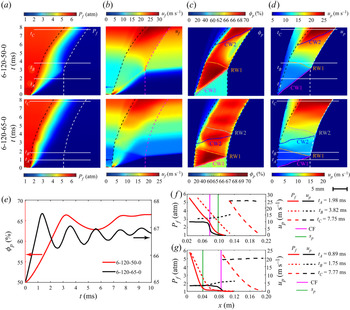
The evolutions of the resulting pressure field, flow field and the dynamics of the shock-loaded granular columns for the two baseline cases are embodied by space–time (x–t) diagrams of the gaseous pressure, Pf, absolute gaseous velocity, uf, particle volume fraction, ϕp, and absolute particle velocity, up, as shown in figure 3(a–d). These variables are all coarse-grained by binning the individual parcel measurements at a given t along x (bin size 2dp) and calculating the bin averages. The trajectories of the front and rear surfaces of the particle columns are also superimposed in figure 3(a–d). Consistent with other studies (Eriksen et al. Reference Eriksen, Toussaint, Turquet, Måløy and Flekkøy2018), the pressure field inside the particles converges into a steady diffusive pressure field during several microseconds after the shock interaction (figure 3a), as does the gaseous flow field (figure 3b). The spatiotemporal variations in ϕp (figure 3c) and up (figure 3d) manifest the propagations of the first and follow-up compaction and rarefaction waves, denoted by CW1/CW2 and RW1/RW2 in figures 3(c) and 3(d). Consequently, the bulk averaged particle volume fraction  ${\bar{\phi }_p}$ fluctuates semiperiodically with quickly declining amplitudes, as shown in figure 3(e). The reverberation of the compaction and rarefaction waves arises from the persistent pressure gradients across the front surface, which constantly accelerate particles therein, whereby compaction waves are formed, travel upstream, then reflect off the rear surface and become downstream-moving rarefaction waves.
Space-time (x–t) diagrams of Pf (a), uf (b), ϕp (c) and up (d) for the two baseline cases 6-120-50-0 (top row) and 6-120-65-0 (bottom row). (e) Temporal variations in the bulk averaged particle volume fraction,  ${\bar{\phi}_p}$, for the two baseline cases. The profiles of Pf(x) and up(x) inside the particle columns at three typical times for the baseline case 6-120-50-0 (f) and 6-120-65-0 (g).

Figures 3(f) and 3(g) plot the profiles of Pf and up along the x axis in the two baseline cases at three typical times, namely midway through the first shock compaction (tA), the first rarefaction (tB) and a very late time (tC), which are indicated in figures 3(a) and 3(d). The profile of Pf at tA results from an advancing diffusive pressure field characterized by a skin depth, sp (Eriksen et al. Reference Eriksen, Toussaint, Turquet, Måløy and Flekkøy2018). The profile of up at tA features a plateau around the velocity of compacted particles, up ,comp, trailing a compaction front (CF) with a narrow width. It is worth noting that the propagation of the CF is not exactly in concert with the progress of the diffusive pressure field. For case 6-120-50-0, the CF travels well inside the skin depth, sp. In contrast, the CF outreaches sp for case 6-120-65-0. This is due to the opposite effects of the particle volume fraction, ϕp, on the propagation speed of the CF, ucomp, and the pressure diffusion velocity, upress. Beyond a critical ϕp value, ucomp exceeds upress, leading to the CF surpassing the envelope of the diffusive pressure field, sp. In the latter case (6-120-65-0), the pressure diffusive field is related to the particle volume fraction of the compacted particles, ϕcomp, rather than the initial one, ϕ 0. Therefore, the diffusive pressure field is more localized near the front surface, yielding steeper pressure gradients therein. Accordingly, the ensuing compaction waves become stronger and last longer. The upstream travelling rarefaction wave leaves behind accelerating and dilating particle packs characterized by a sloping upward profile of up(x) at tB. The slope of the up(x) profile at tB is reduced in case 6-120-50-0 since the rarefaction effect is partially offset by the more diffusive pressure field, which imposes countering pressure gradient forces throughout the column. At late time tC, the up(x) profiles for both cases display a plateau, indicating a collective mobilization of particles (DeMauro et al. Reference DeMauro, Wagner, DeChant, Beresh and Turpin2019). The pressure profiles P(x) at tC vary little from those at tB.
4.2. Unscaled perturbation growth law of the SDGI
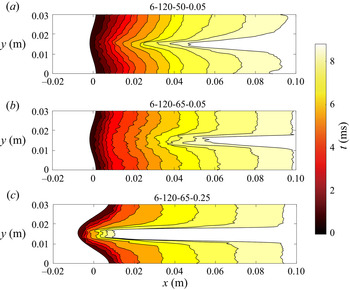
Figure 4 displays the morphological evolutions of the single-mode perturbed granular surfaces in cases 6-120-50-0.05 (figure 4a), 6-120-65-0.05 (figure 4b) and 6-120-65-0.25 (figure 4c). The delineation of the destabilized surface is elaborated in Appendix A. During the early times, the perturbations in cases 6-120-50-0.05 and 6-120-65-0.25 grow slowly. At the end of the early time stage (for cases 6-120-50-0.05 and 6-120-65-0.25, t = 3.71 and 1.58 ms), the perturbation amplitudes increase by 14.46 % and 6.87 %, respectively. Meanwhile, no discernible perturbation growth occurs in case 6-120-65-0.05, and the perturbation amplitudes increase 1.05 % at t = 1.58 ms. An expedited growth phase, which is elaborated later, soon takes over in all three cases, leading to the formation of finger-like particle protrusions. These particle fingers become progressively longer and thinner, and their elongation rates seemingly become steady at later times. Eventually, an initially sinusoidal interface configuration evolves into a profile consisting of a singular protrusion flanked by two flat shoulders. In the following, the finger-like protrusion is referred to as a ‘spike’, while the flattened shoulders are referred to as ‘bubbles’, as conventionally termed in the RMI and SDMI.
Morphological evolutions of the single-mode perturbed granular surfaces in three cases, where (a) and (b) have differing volume fractions while (b) and (c) have differing perturbation amplitudes. The colour code represents the time of the snapshot.

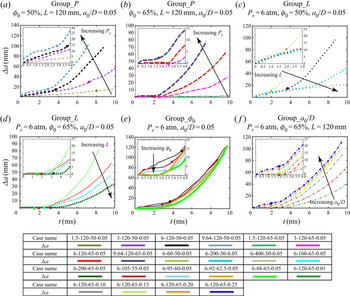
Temporal variations in the perturbation amplitude, Δa(t) = a(t) − a 0, for different groups are plotted in Figure 5. In line with the shape evolution of the destabilized interface shown in figure 4, Δa(t) undergoes three sequential phases with distinct characteristics, namely a slow or minimum growth stage (see the close-up insets in figure 5a–f), an expedited growth stage and an asymptotic growth stage. These three regimes are well fitted by linear, exponential and quadratic polynomial functions, respectively, as demonstrated in figure 5. The specific forms of the fitting functions chosen here are justified in § 5. As shown in figure 5, the two kinks in the Δa(t) curves indicating the transitions of the fitting curves define the two critical times delimiting the three growth stages, which are denoted as tLE and tEQ, respectively (Figure 6).
Temporal variations in the perturbation amplitude of the single-mode front surface, Δa(t), for various studies: pressure study, ϕ 0 = 50 % (a), pressure study, ϕ 0 = 65 % (b), column length study, ϕ 0 = 50 % (c), column length study, ϕ 0 = 65 % (d), column length and volume fraction study (e), perturbation amplitude study, ϕ 0 = 50 % (f). Insets in (a–f): close-up plots of Δa(t) during the early times. The filled circular symbols in (a–f) indicate the transition times between the first and second growth stages, tLE.

The three sequential growth stages of the perturbation amplitude for three typical cases are fitted by linear, exponential and quadratic polynomial functions, respectively.

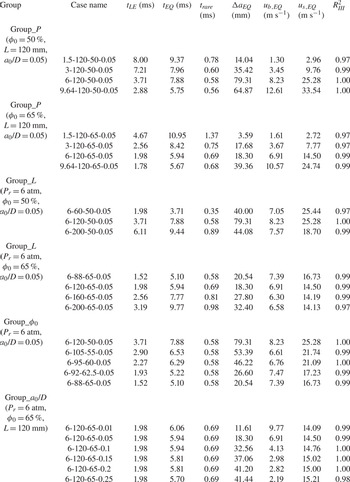
Upon further inspection of the dynamics of shock-loaded particle columns (figure 3c,d) and the perturbation growth laws (figure 5a–f), we discern a strong correlation between them. Specifically, the first growth stage lasts through the first shock compaction and the ensuing rarefaction. Time tLE corresponds to the time at which the reflected rarefaction wave arrives at the front surface. An expedited growth stage commences thereafter and persists through the following multiple reverberations of the compaction and rarefaction waves. Alongside the rapid decay of the secondary compaction and rarefaction waves, the velocity differences among particles inside the columns are significantly reduced. As shown in figure 7, the particle temperature,  ${T_p}(t) = \langle \Delta {u_p}\rangle /{\bar{u}_p}$, substantially decreases after a first handful of reverberations of the compaction and rarefaction waves, albeit periodic fluctuations persist throughout. The minimum values of Tp(t), namely Tp(t) < 0.01, signify that the particle column is travelling collectively like a jammed plug. Correspondingly, the perturbation growth is ushered into a third growth regime. The time at which Tp(t) becomes less than 0.01 is designated as the transition time between the second and third growth regimes, tEQ. Exact values of tLE and tEQ for all cases are presented in table 2 in § 5.6.
Temporal variations in the granular temperature, Tp, for three typical cases. Time tEQ corresponds to the time at which Tp becomes minimum, Tp < 0.01.

Variables regarding the perturbation growth laws in all cases. Times tLE and tEQ represent the transition times between the three sequential growth stages; trare refers to the time it takes for the rarefaction wave to encompass the whole column; ΔaEQ, ub ,EQ and us ,EQ denote the perturbation amplitude increment and the bubble and spike velocities at tEQ, respectively;  $R_{III}^2$ is the coefficient of determination of the fitting function (5.15) to the third growth stage.

5. Physics underlying SDGI
5.1. Driving forces in SDGI
As alluded to in § 1, the SDGI is prescribed by interfacial granular flows rather than the gaseous vortices that are found to be irrelevant in the SDGI, as detailed in Appendix B. In this section, we reveal the mechanisms driving the interfacial granular flows responsible for the SDGI. In addition, the transitions of the distinct growth stages entail the corresponding crossovers of the driving mechanisms, which are also a focus of this section.
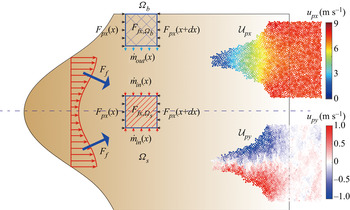
The perturbation growth is the result of the persistent velocity differential between particles enclosed by the spike tip and the bubble edge, Δub -s = ub − us. Hence, understanding the causes of this velocity differential is of significance to shed light on the initiation and growth of perturbations. Figure 8 presents the dynamics of the two volume elements,  $\varOmega_s$ and
 $\varOmega_b$, which are aligned with the symmetric axes of the spike and the bubbles, respectively. Applying Newton's second law to the particle phase in a specific volume element along the x direction, the change in momentum in
 $\varOmega$ during a very short time (Δt) should equal the total force and can be expressed as follows:
 \begin{equation}\frac{{[{m_\varOmega }(x) + 2{{\dot{m}}_{in}}(x)\varDelta t]({u_{px,s}}(x) + {{\dot{u}}_{px,s}}(x)\varDelta t) - {m_\varOmega }(x) \cdot {u_{px,s}}(x)}}{{\varDelta t}} ={-} {F_{px,\varOmega}} (x) \!+\! {F_{fx,\varOmega}} (x).\end{equation}
Then, we obtain
 \begin{equation}[{m_\varOmega }(x) + 2{\dot{m}_{in}}(x)\mathrm{\Delta }t]{\dot{u}_{px,s}}(x) ={-} 2{\dot{m}_{in}}(x){u_{px,s}}(x) - {F_{px,\varOmega}} (x) + {F_{fx,\varOmega}} (x).\end{equation}
Ignoring the second, higher-order term on the left, the final force balance equations in  $\varOmega_{s}$ and
 $\varOmega_{b}$ are
 \begin{gather}{m_{{\varOmega _s}}}(x){\dot{u}_{px,s}}(x) ={-} 2{\dot{m}_{in}}(x){u_{px,s}}(x) - {F_{px,{\varOmega _s}}}(x) + {F_{fx,{\varOmega _s}}}(x),\end{gather}
 \begin{gather}{m_{{\varOmega _b}}}(x){\dot{u}_{px,b}}(x) ={-} 2{\dot{m}_{out}}(x){u_{px,b}}(x) - {F_{px,{\varOmega _b}}}(x) + {F_{fx,{\varOmega _b}}}(x),\end{gather}
where  ${m_{{\varOmega _s}}}\;({m_{{\varOmega _b}}})$ and upx ,s (upx ,b) are the mass and the x component of particle velocity of
 $\varOmega_{s}$ (
 $\varOmega_{b}$);
 ${F_{px,{\varOmega _s}}}\;({F_{px,{\varOmega _b}}})$ and
 ${F_{fx,{\varOmega _s}}}\;({F_{fx,{\varOmega _b}}})$ are the x components of the interparticle and gas– particle forces exerted on
 $\varOmega_{s}$ (
 $\varOmega_{b}$); and
 ${\dot{m}_{in}}$ (
 ${\dot{m}_{out}}$) are the mass flow-in (flow-out) rates across the boundaries of
 $\varOmega_{s}$ (
 $\varOmega_{b}$). Since two derivative terms about time exist in (5.3) and (5.4), the accuracy depends on whether the time step is small enough. In our simulation, several microsecond time steps ensure that the errors of derivative terms are less than 5.1 %.
Schematic diagram of force balances for two representative volume elements,  $\varOmega_{b}$ and
 $\varOmega_{s}$, located along the symmetric lines of the spike and the bubbles, respectively. Insets: typical axial (x direction, top) and transverse (y direction, bottom) particle velocity fields.

Conspicuous transverse mass flows (along the y axis) from the bubble to the spike, albeit one order of magnitude smaller than their counterparts in the shock-loaded direction (along the x axis), are observed throughout the perturbation growth, as demonstrated in the bottom inset of figure 8. Therefore, the net mass flux,  ${\dot{m}_{in}}$, flows into
 $\varOmega_{s}$, while
 $\varOmega_{b}$ suffers a net mass flux flowing out,
 ${\dot{m}_{out}}$. Force Ff consists of the pressure gradient force and the drag force,
 ${\boldsymbol{F}_{\boldsymbol{\nabla }P}}$ and Fdrag, respectively, both arising from the interaction between the interstitial gas flows and particle skeletons. Since the diffusive pressure fields and the resulting gas flows inside the granular columns are governed by the consistent models, Fdrag is proportionate to
 ${\boldsymbol{F}_{\boldsymbol{\nabla }P}}$, as deduced in Appendix C. The interparticle forces, Fpx, exerted on the downstream and upstream boundaries of
 $\varOmega_{b}$ (
 $\varOmega_{s}$) cancel each other out as long as ϕp is inside
 $\varOmega_{b}$ (
 $\varOmega_{s}$) and does not drastically change across boundaries. Therefore, ub, and us, and the resulting Δub -s primarily depend on the first and third terms on the right-hand side of (5.3) and (5.4), namely the mass flow-in/flow-out effect and the gas– particle forces. The relative importance of
 ${\dot{m}_{in}}$ (
 ${\dot{m}_{out}}$) and Ff ,x varies markedly across different growth regimes, as will be seen below. The flow-in/flow-out mass effect is particularly relative when the shock loading is so transient that the interphase coupling quickly diminishes.
5.2. Driving mechanism in the first growth stage
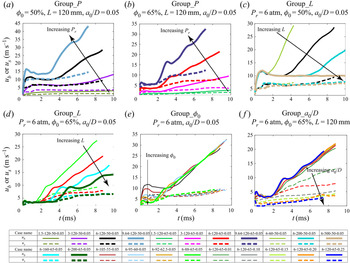
Figure 9(a–f) shows the temporal variations in the absolute velocities of the spike tips and the bubble cusps, us and ub, respectively, for the different groups. For the cases with the successful initiation of the SDGI during the first growth stage, both us and ub jump at the very early instants and then level off. The corresponding Δub -s spikes simultaneously and plateaus thereafter, resulting in a linear growth of Δa during most of the first growth stage (see insets in figure 5a–f). Examining the concurrent evolution of the pressure fields (see figure 10), we find that the reflection of the incident shock off the front surface corresponds to the jump of us and (ub), while as the reflected shock travels away, us and (ub) converge to steady values.
Temporal variations in the particle velocities at the spike tip, us, and the bubble cusp, ub, for various studies: pressure study, ϕ 0 = 50 % (a), pressure study, ϕ 0 = 65 % (b), column length study, ϕ 0 = 50 % (c), column length study, ϕ 0 = 65 % (d), column length and volume fraction study (e), perturbation amplitude study, ϕ 0 = 50 % (f).

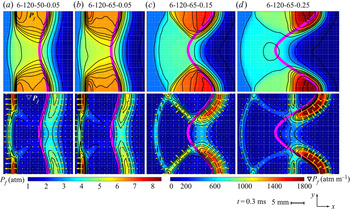
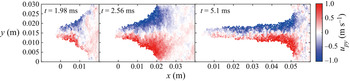
Pressure (top row) and pressure gradient (bottom row) fields upon the incident shocks reflect off the front surfaces (thick pink lines) for four typical cases. Cases 6-120-50-0.05 (a) and 6-120-65-0.05 (b) have the same a 0 and display similar pressure and pressure gradient fields. The pressure and pressure gradient fields change markedly from (b) to (d) with increasing a 0.

Figure 10(a–d) displays highly localized pressure fields and the corresponding pressure gradient fields across the front surface upon reflection of the incident shocks. In contrast with the shock crossing the interface between pure gases and gases laden with a minute fraction of particles without much hindrance, an incident shock reflects off the dense granular medium surface as if it impinges on a solid surface. Shock focusing occurs on the concave segments (bubble edges) of the single-mode perturbed interface, and the pressures therein are elevated. In contrast, particles enclosed by the convex segment (spike edge) of the interface endure a lower and more uniform pressure field, as indicated by sparsely spaced pressure contour lines. Consequently, the pressure gradient contours form two ridges just beyond the upper and lower concave edges of the interface and a trough spanning the area protruding into the gases. As the amplitude of the initial perturbation, a 0, increases, the shock focusing is increasingly enhanced, whereby the pressure gradient field becomes more localized with increased magnitude (figure 10b–d). In the meantime, the pressure gradient forces  ${\boldsymbol{F}_{\boldsymbol{\nabla }P}}$, whose directions are opposite to local pressure gradients, are further directed towards the central symmetric axis (figure 10b–d).
The drag force fields, Fdrag, share characteristics similar to those of the pressure gradient fields (see figure 11a–d) since Fdrag is proportional to  ${\boldsymbol{F}_{\boldsymbol{\nabla }P}}$. Similar to
 ${\boldsymbol{F}_{\boldsymbol{\nabla }P}}$, Fdrag also has the non-trivial y component pointing towards the central symmetric axis, which increases with a 0. The y components of
 ${\boldsymbol{F}_{\boldsymbol{\nabla }P}}$ and Fdrag bring about transverse granular flows from the bubble to the spike, which become stronger with increasing a 0 (figure 11b–d) and decreasing ϕ 0 (figure 11a,b).
Drag force (top row) and transverse granular flow (bottom row) fields for four typical cases. Cases 6-120-50-0.05 (a) and 6-120-65-0.05 (b) have the same a 0 but different displays resembling the drag force field but with different transverse granular flows. The drag force fields become more localized as a 0 increases (b–d), invoking more intense transverse granular flows.

Stronger pressure gradients and drag forces pushing the concave segments of the front surface (bubble cusps) contribute to faster particle velocities therein, ub, causing the velocity differential between the spike and bubbles, Δub -s. However, the flow-in/flow-out mass effect invoked by transverse granular flows plays an equally crucial role in Δub -s. We quantify the flow-in/flow-out mass effect by defining a transverse mass flux in the interfacial region,  ${\dot{m}_y}$, which manifests the transverse particle velocity and the mass involved. The definition and calculation of
 ${\dot{m}_y}$ are given in Appendix D. Figure 12 shows the explicit correlations between
 ${\dot{m}_y}(t)$ and Δub -s(t) during the first and second growth regimes for three typical cases 6-120-50-0.05 (figure 12a), 6-120-65-0.05 (figure 12b) and 6-120-65-0.25 (figure 12c). During the first growth stage, the jumps of Δub -s in cases 6-120-50-0.05 (figure 12a) and 6-120-65-0.25 (figure 12c) correspond to the peak values of
 ${\dot{m}_y}$, which plunge during the following plateau of Δub -s. In contrast, Δub -s in case 6-120-65-0.05 remains nearly zero during the first growth stage, coinciding with the suppression of
 ${\dot{m}_y}$ (figure 12b).
Temporal variations in the velocity differential between the bubbles and the spike, Δub -s, and the transverse granular flux,  ${\dot{m}_y}$, for three typical cases 6-120-50-0.05 (a), 6-120-65-0.05 (b) and 6-120-65-0.25 (c).

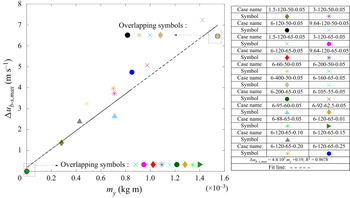
Figure 13 plots the maximum values of Δub -s during the first stage, Δub -s,max, versus the corresponding cumulative transverse mass flux  ${m_y} = \int_0^{{t_{jump}}} {{{\dot{m}}_y}} \,\textrm{d}t$ for all cases, revealing a semilinear dependence of Δub -s,max on my. The cases in which the SDGI is not initiated yet during the first stage (Δub -s,max ~ 0) have negligible my, suggesting a pivotal role played by the transverse granular flow in the instability criterion. Note that the symbols representing cases wherein the SDGI fails to be initiated during the first growth stage are overlaid in figure 13 (see the bottom left inset in figure 13). The overlapping results of Group
 $\_$L (Pr = 6 atm, ϕ 0 = 50 %, a 0/D = 0.05; see the top right inset of figure 13) indicate that the length of the granular column has no appreciable effect on the perturbation growth of the SDGI during the first growth regime. Indeed, the Δa(t < tLE) curves for the cases in Group
 $\_$L (Pr = 6 atm, ϕ 0 = 50 %, a 0/D = 0.05) coincide with each other despite tLE varying with the column length (figure 5c).
Correlation between the maximum values of Δub -s,max during the first growth stage and the corresponding cumulative transverse granular flux, my, for all cases. Insets: the overlapping symbols representing cases wherein the SDGI fails to be initiated (bottom left) and the overlapping symbols representing Group III wherein the column length is kept constant (top right).

5.3. Upper limit of the perturbation growth rate during the first stage
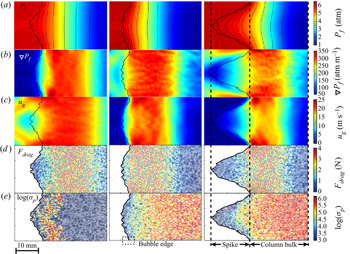
After the reflected shock travels away from the interface, the spatial distributions of pressure, Pf, pressure gradient,  $\boldsymbol{\nabla }{P_f}$, gaseous flows, ug, drag forces, Fdrag, and solid stresses, σp, evolve into steady states as shown in figure 14(a–e). A typical diffusive pressure field dominates the bulk of the granular column except for the spike-like protrusion, which is encompassed by a much more uniform pressure field (figure 14a). Lacking sufficient pressure gradients (figure 14b), gas flows become stagnant throughout the spike regions (figure 14c). Therefore, particles constituting the spike are driven by much lower
 ${\boldsymbol{F}_{\boldsymbol{\nabla }P}}$ and Fdrag values than those in the column bulk (see figure 14d). In addition, dense force chain networks percolate through the compacted column bulk, while the solid stresses are barely discernible inside the spikes (figure 14e). As a result, the whole particle column behaves like two separate parts. The compacted column bulk materials are driven by the diffusive pressure field and the compaction wave, while the protruding spikes are left behind, and they become increasingly loosely packed and shed particles along the way. Since the concave segments of the front surface (bubble cusps) are part of the compacted column bulk, the bubble velocity, ub, is identical to the particle velocity of the compacted bulk, up ,comp.
Spatial distributions of the pressure, Pf (a), pressure gradient,  $\boldsymbol{\nabla }{P_f}$ (b), gaseous flows, ug (c), drag forces, Fdrag (d), and solid stresses, σp (e), for three typical cases when the reflected shock travels far away from the front surface (t = 0.43 ms).

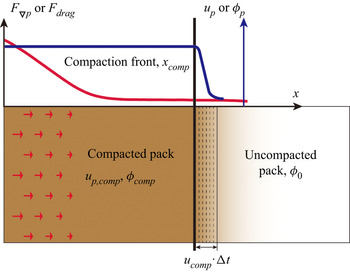
The growth rate of the first semilinear growth regime is dictated by the velocity differential between the bubbles and the spike, Δub -s = ub − us. Thus, ub, or equivalently up ,comp, provides an upper limit for the perturbation growth rate. The dynamics of the column bulk undergoing shock compaction is presented in figure 15, wherein the compaction wave travels at a velocity of ucomp. Particles compacted by the compaction wave gain the velocity of up ,comp. The momentum equation of the compacted part of the column is given by
 \begin{align}& \int_0^{{x_{comp}}} {({\rho _p}{\phi _{comp}}){{\dot{u}}_{p,comp}}(x)\,\textrm{d}\kern0.06em x} ={-} ({\rho _p}{\phi _0}){u_{comp}}{u_{p,comp}}\nonumber\\
& \qquad + \int_0^{{x_{comp}}} {{F_{\boldsymbol{\nabla }P}}(x)\boldsymbol{\cdot }{\bf (}{\rho _p}{\phi _{comp}})\,\textrm{d}\kern0.06em x} + \int_0^{{x_{comp}}} {{F_{drag}}(x)\boldsymbol{\cdot }{\bf (}{\rho _p}{\phi _{comp}})\,\textrm{d}\kern0.06em x} , \end{align}
where ρp is the particle density. The first term on the right-hand side of (5.5) comes from the growing mass of the compacted pack. The second and third terms on the right-hand side of (5.5) represent the x components of the pressure gradient force and the drag force exerted on the compacted pack with a cross-section of unit area. Forces  ${\boldsymbol{F}_{\boldsymbol{\nabla }P}}$ and Fdrag are the pressure gradient force and the drag force exerted on granular media with units of mass, respectively, which are related by (see Appendix D)
 \begin{equation}{F_{drag}} = \frac{{1 - {\phi _{comp}}}}{{{\phi _{comp}}}}\boldsymbol{\cdot }{F_{\boldsymbol{\nabla }P}}, \end{equation}
where  ${\boldsymbol{F}_{\boldsymbol{\nabla }P}} = {\nabla _x}P/{\rho _p}$. For steady-state compaction, ucomp and up ,comp are unvaried so that the term on the left-hand side of (5.5) diminishes. Additionally, ucomp and up ,comp satisfy the Rankine–Hugoniot relationship:
 \begin{equation}{u_{comp}} = {u_{p,comp}}\left( {1 + \frac{{{\phi_0}}}{{{\phi_{comp}} - {\phi_0}}}} \right).\end{equation}
Substituting (5.6) and (5.7) into (5.5), we obtain up ,comp and ucomp:
 \begin{gather}{u_{p,comp}} = \sqrt {\frac{{({P_r} - {P_1})}}{{{\rho _p}}}\frac{{{\phi _{comp}} - {\phi _0}}}{{{\phi _0}{\phi _{comp}}}}} ,\end{gather}
 \begin{gather}{u_{comp}} = \sqrt {\frac{{({P_r} - {P_1})}}{{{\rho _p}}}\frac{{{\phi _{comp}}}}{{({\phi _{comp}} - {\phi _0}){\phi _0}}}} .\end{gather}
Equations (5.8) and (5.9) formulate the dependence of up ,comp and ucomp on the strength of the incident shock, Pr − P 1, the particle density, ρp, the initial particle volume fraction, ϕ 0, and the compacted particle volume fraction, ϕcomp. Figure 16 plots the scaled up ,comp for all cases derived from simulations which agree well with the theoretical predictions (equation (5.8)).
Schematic diagram of the shock compaction of the uncompacted particle column.

Particle velocities during the shock compaction scaled by  $\sqrt {({P_r} - {P_1})/{\rho _p}} $ for all numerical cases,
 ${u_{p,comp}}/\sqrt {({P_r} - {P_1})/{\rho _p}} $. The dashed line denotes the theoretically predicted dependence of scaled up ,comp on
 $\sqrt {({\phi _{comp}} - {\phi _0})/{\phi _0}{\phi _{comp}}} $.

5.4. Instability criterion for a granular column with infinite length
The initiation of the perturbation growth during the first growth stage is particularly relevant to a granular column with infinite length wherein the SDGI only has the first growth stage. As suggested in figure 13 the occurrence of sustained transverse granular flows is a prerequisite for perturbation growth initiation. The effect of ϕ 0 on the transverse granular flows is well explored by examining the cases in Group $\_$ϕ 0 wherein ϕ 0 increases from 0.5 to 0.65 (close to ϕcomp). As ϕ 0 approaches ϕcomp, the transverse granular flows become progressively suppressed and eventually cease (see figure 13). In addition to ϕ 0, the initial perturbation amplitude, a 0, also plays a critical role in initiating transverse granular flows, as discussed in § 6.
For densely packed particle columns (ϕ 0 ~ ϕcomp), the transverse granular flows are sustained only when the associated time scale, ttr, is smaller than the compaction time scale, tcomp. Otherwise, the interfacial particles are compacted to the jammed pack state so fast that no discernible transverse granular flows can survive. The transverse granular flow time scale, ttr, given by (5.10) represents the time it takes for a particle to fall into a hole of size dp under the pressure gradient force  ${\nabla _y}P \cdot {d_p}$, where
 ${\nabla _y}P$ is the y component of the pressure gradient:
 \begin{equation}{t_{tr}} = \frac{{{d_p}}}{{\sqrt {{\nabla _y}P \cdot {d_p}/{\rho _p}} }}.\end{equation}
Note that  ${\nabla _y}P$ is a function of the shock strength, Pr, and the perturbation amplitude, a 0:
 ${\nabla _y}P = {\nabla _y}P({P_r},{a_0}/D)$. The compaction time scale tcomp is described by
 \begin{equation}{t_{comp}} = {a_0}/{u_{comp}},\end{equation}
where ucomp can be predicted by (5.9). The ratio between the two time scales yields a dimensionless parameter, τ:
 \begin{equation}\tau = \frac{{{t_{tr}}}}{{{t_{comp}}}} = \frac{{{d_p} \cdot {u_{comp}}}}{{{a_0}\sqrt {{\nabla _y}P \cdot {d_p}/{\rho _p}} }}.\end{equation}
Substituting (5.9) into (5.12), we obtain the dependence of τ on a range of structural parameters:
 \begin{equation}\tau = \frac{1}{{{a_0}}}\sqrt {\frac{{{\phi _{comp}}}}{{({\phi _{comp}} - {\phi _0}){\phi _0}}}} \sqrt {\frac{{{d_p}({P_r} - {P_1})}}{{{\nabla _y}P}}} .\end{equation}
A τ smaller than unity means that the axial compaction is slow compared to the microscopic transverse granular flows, enabling sustained transverse granular flows and the ensuing growth initiation. Accordingly, τ = 1 leads to an instability criterion whereby a critical pressure gradient normal to the compaction direction,  ${\nabla _y}{P_{cr}}$, is derived:
 \begin{equation}{\nabla _y}{P_{_{cr}}} = {\left( {\frac{1}{{{a_0}}}} \right)^2}\frac{{{\phi _{comp}}({P_r} - {P_1}){d_p}}}{{({\phi _{comp}} - {\phi _0}){\phi _0}}}.\end{equation}
A  ${\nabla _y}P$ smaller than
 ${\nabla _y}{P_{cr}}$ is insufficient to initiate the SDGI during the first growth regime. The dependences of
 ${\nabla _y}{P_{cr}}$ on a 0 with different ϕ 0 values are plotted in figure 17(a) wherein Pr = 6 bar. Here
 ${\nabla _y}{P_{cr}}$ drastically decreases with increasing a 0. On the other hand, the perturbed interfaces with increased a 0 values spontaneously invoke higher pressure gradients normal to the compaction direction (see figure 10). Therefore, the perturbed interfaces with increased a 0 values are much more prone to become destabilized. Figure 17(b) shows the dependence of
 ${\nabla _y}{P_{cr}}$ on ϕ 0 with Pr = 6 bar and a 0 = 0.05D. Clearly, the initiation of the SDGI in loosely packed particles with smaller ϕ 0 demands weaker incident shock since it takes a longer time for the loosely packed particles to be fully shock compacted.
Dependences of the critical pressure gradient normal to the shock compaction direction,  ${\nabla _y}{P_{cr}}$, on the scaled initial perturbation amplitude, a 0/D (a) and the initial particle volume fraction, ϕ 0 (b). In (a), Pr = 6 atm, ϕ 0 = 0.625 and 0.65; in (b), Pr = 6 atm, a 0 = 0.05D. Filled and open symbols represent
 ${\nabla _y}{P_{sim}}$ of cases with and without the initiation of the SDGI during the first growth regime, respectively.

Figures 17(a) and 17(b) are complemented by the simulated values of  ${\nabla _y}P$ averaged over the ridge areas in the pressure gradient fields delineated by the pressure gradient contour
 $|\boldsymbol{\nabla }P|= 500\;\textrm{atm}\;{\textrm{m}^{ - 1}}$,
 ${\nabla _y}{P_{sim}}$. Indeed, values of
 ${\nabla _y}{P_{sim}}$ of cases wherein perturbation growth is not initiated are below the
 ${\nabla _y}{P_{cr}}$ curves, suggesting that axial compaction overwhelms the potential transverse granular flows to suppress the initiation of the SDGI. Note that the instability criterion given in (5.14) holds only if the particle packs are dense enough so that the incident shock reflects off the front surface as if it reflects off a solid surface. Hence, there exists a minimum ϕ 0, ϕ 0,min, for the validity of the proposed instability criterion (equation (5.14)). For particle packs with a ϕ 0 smaller than ϕ 0,min, the coupling between particles and interstitial gas flows deviates from being governed by the infiltration process. The transmitted wave effect should be considered. Particle packs with ϕ 0 smaller than ϕ 0,min can hardly be mechanically stable and are regarded as dense granular media.
5.5. Driving mechanism during the second and third growth stages
The first growth regime comes to its end at tLE, the time that the rarefaction wave arrives at the front surface of the particle column. The ensuing decompaction of the interfacial particles immediately activates the transverse granular flows, as indicated by the significant ramp-up of the transverse mass flux  ${\dot{m}_y}$ after tLE (figure 12). The mass flow-in/flow-out effect is substantially amplified. Therefore, we observe an increase of the bubble velocity ub after tLE, while the spike velocity us barely changes (figure 9). The velocity differential Δub -s = ub − us grows at an expected rate, terminating the semilinear perturbation growth mode during the first growth stage. Instead, an exponential growth mode takes hold (see the exponential fitting during tLE < t < tEQ in figure 5g), signifying the commencement of the second growth stage. Notably, the second compaction in the cases of Group IV temporarily suppresses the transverse granular flows (see figure 12), giving rise to minor kinks in the ub(t) (figure 9) and Δub -s(t) (figure 12) curves. However, the perturbation growth during the second growth stage is largely unaffected by the alternating compaction and rarefaction waves reverberating through the particle columns.
Alongside the elongation of the spike, intense transverse granular flows move from the root of the spike to its stem, as shown in figure 18. The mass flow-in/flow-out effect hence is decoupled from the dynamics of the column bulk. Similar to the first growth stage after the shock interaction, the spike and the column bulk behave like separate entities. The column bulk is accelerated by the diffusive pressure field as a whole, while the spike is left behind without adequate driving forces. From then on, the perturbation growth crosses over to a third asymptotic growth stage, solely controlled by the distinct pressure and gas flow fields governing the column bulk and the spike.
Transverse granular flows in terms of upy for case 6-120-65-0.25 at different times.

As mentioned in § 4.2, the onset of the third growth stage, tEQ, coincides with the time that the granular temperature inside the column bulk diminishes. Afterwards, the work done by the pressure gradient and drag forces is predominately converted to the kinetic energy of the compacted column bulk. Driven by the steady diffusive pressure and gas flow fields throughout the column bulk, as shown in figures 3(a) and 3(b), the bubble edge alongside the column bulk accelerates with a constant value,  ${\dot{u}_{b,III}}$. Therefore, the perturbation growth law during the third stage ought to follow a quadratic function:
 \begin{equation}\Delta a = a - {a_0} = \Delta {a_{EQ}} + ({u_{b,EQ}} - {u_{s,EQ}})(t - {t_{EQ}}) + {\dot{u}_{b,III}}{(t - {t_{EQ}})^2}\quad t > {t_{EQ}},\end{equation}
where ΔaEQ is the amplitude increment of perturbation at tEQ and ub ,EQ and us ,EQ are the instantaneous velocities of the bubble edges and the spike tip at tEQ.
5.6. Growth rate during the third asymptotic growth stage
In this section, we attempt to deduce  ${\dot{u}_{b,III}}$, which characterizes the third quadratic growth stage from a simplified force balance equation of the column bulk:
 \begin{equation}{\phi _{comp}}{L_{comp}}{\dot{u}_{b,III}} = \int_0^{{L_{comp}}} {{F_{\boldsymbol{\nabla }P}}(l) \cdot {\phi _{comp}}\,\textrm{d}l} + \int_0^{{L_{comp}}} {{F_{drag}}(l) \cdot {\phi _{comp}}\,\textrm{d}l} ,\end{equation}
where Lcomp is the length of the compacted column bulk. Substituting (5.6) into (5.16) and integrating the terms on the right-hand side of (5.16) yield a simple analytical solution:
 \begin{equation}{\dot{u}_{b,III}} = \frac{{{P_r} - {P_1}}}{{{\rho _p}{\phi _{comp}}{L_{comp}}}} = \frac{{{P_r} - {P_1}}}{{{m_{col}}}},\end{equation}
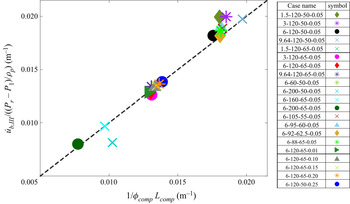
where  ${\dot{u}_{b,III}}$ is a function of the shock strength, Pr − P 1, and the column mass, mcol. Equation (5.17), albeit having a quite simple form, provides a fairly good approximation of the acceleration of the column bulk during the third stage, as suggested in figure 19.
Dependence of  ${\dot{u}_{b,III}}/[({P_r} - {P_1})/{\rho _p}]$ on
 $1/{\phi _{comp}}{L_{comp}}$ predicted by (5.17) (dashed line) in comparison with the simulated results for all cases.

We proceed to fit the growth curves of Δa(t) after tEQ using (5.15) wherein tEQ, ΔaEQ, ub ,EQ and us ,EQ are attained from simulations while  ${\dot{u}_{b,III}}$ is calculated by (5.17). Table 2 in Appendix F tabulates the values of tEQ, ΔaEQ, ub ,EQ and us ,EQ for all cases. The fitting curves of the third growth regime for three typical cases are demonstrated in figure 5(g). A fairly high fitting accuracy is achieved for all cases since the coefficient of determination values,
 $R_{III}^2$, presented in table 2 in Appendix F are all near unity.
6. Discussion
The three-stage growth law of the SDGI distinctly differs from that of the RMI and SDMI characterized by the linear regime and the following nonlinear regime (Luo et al. Reference Luo, Li, Ding, Zhai and Si2019; Li et al. Reference Li, Ding, Si and Luo2020; Zhou et al. Reference Zhou2021). More importantly, the SDGI is dictated by granular dynamics rather than vortices deposited along the interface. The granular dynamics vary dramatically across the different growth stages and they are coupled with the shock-induced flows. The early instants of the first growth stage, namely the shock interaction phase, and the whole second growth stage are most affected by intense interfacial transverse granular flows. In contrast, most of the first semilinear growth stage is underpinned by the steady compaction process. The third asymptotic growth stage is dictated by the acceleration of the column bulk in the steady diffusive pressure field.
For granular media of finite length, the propagation of the rarefaction wave ensuing from the reflection of the compaction wave sets off the expedited growth stage, which serves as a transitional phase between the first and third growth stages. The rarefaction propagation time, trare, the time it takes for the rarefaction wave to traverse the whole particle column, is comparable to the duration of the second expedited growth regime, which is the linchpin to the overall perturbation growth. Thus, trare provides a time scale pivotal to the SDGI. The calculation of trare from the axial particle velocity profiles is given in Appendix E. Values of trare for all cases are presented in table 2 in Appendix F. It is worth noting that trare varies markedly from one combination of the incident shock and granular medium to another. Basically, trare depends on the particle column length and the propagation speed of the rarefaction front, which manifests the release rate of the elastic energies stored inside the compacted particles. The elastic energy, or configuration energy, as referred to in other literature (Baer & Nunziato Reference Baer and Nunziato1986), is a function of the particle packing fraction. Denser packs of the shock-loaded particles are compacted, and larger elastic energy is conserved inside, leading to a stronger and faster rarefaction wave. Presumably, the shock strength and initial packing fraction both contribute to the compacted packing fraction, ϕcomp, and eventually in trare, as suggested in table 2 in Appendix F. Among other factors, particle morphology, especially particle shape and roughness, plays a non-trivial role in ϕcomp and eventually trare, which hence guarantees more attention in follow-up studies (Cho, Dodds & Santamarina Reference Cho, Dodds and Santamarina2006). On the other hand, rarefaction waves have more difficulties accelerating heavier particles and thereby become increasingly weaker. Therefore, the particle density, ρp, should be accounted for as a determining factor of trare.
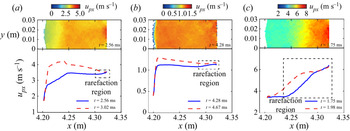
Subjected to the persistent diffusive pressure field, the upstream propagation of the rarefaction wave in particle columns may well be countered, even arrested by the downstream travelling secondary compaction wave emanating from the front surface, resulting in a prolonged or even infinite trare. This counteracting effect is more significant for cases involving weaker rarefaction waves and/or longer columns. Figure 20 compares the rarefaction propagation in cases 6-120-65-0.05, 1.5-120-65-0.05 and 6-120-65-0.05-H, wherein ρp is doubled compared to other cases while other parameters remain identical to those of case 6-120-65-0.05. The particles in the wake of rarefaction waves in cases 6-120-65-0.05-H (figure 20a) and 1.5-120-65-0.05 (figure 20b) gain substantially smaller acceleration and display flattened velocity profiles compared with their counterparts in case 6-120-65-0.05 (figure 20c). In both cases, the rarefaction waves are halted midway by the countering compaction waves, leading to the absence of the expedited growth regime and infinite trare. Therefore, the SDGI in cases 6-120-65-0.05-H and 1.5-120-65-0.05 cannot be initiated altogether.
Velocity fields (top row) and axial velocity profiles (bottom row) of cases 6-120-65-0.05-H (a), 1.5-120-65-0.05 (b) and 6-120-65-0.05 (c) during the rarefaction process. The rarefaction waves are halted midway by the countering compaction wave in (a) and (b).

The aforementioned analysis may justify the experimental observations reported by Kandan et al. (Reference Kandan, Khaderi, Wadley and Deshpande2017). Specifically, SDGI occurs in a shock-loaded dry polytetrafluoroethylene (PTFE) column (ρp,PTFE = 1460 kg m−3) when the incident shock is strong enough, while a dry sand column (ρp ,sand = 2750 kg m−3) of the same length impinged by an equally strong shock retains an intact surface. Since weaker incident shocks and heavier particles both contribute to incomplete rarefaction propagation, there must exist a shock strength threshold for the occurrence of the SDGI in a specific granular column. An incident shock that initiates the SDGI in a light granular column (PTFE column) may fail to give rise to the SDGI in a heavy granular column (dry sand column).
The discussion above highlights the significance of trare as the characteristic time to the SDGI in terms of the initiation and the overall perturbation growth rate. The scaled time is hence obtained by normalizing the time by trare, t* = t/trare. Since trare is a function of an exhaustingly large parameter space and often interferes with the secondary compaction wave, it is almost impossible to derive an analytical expression of trare. We thus refrain from attempting to formulate trare, which would be the subject of further investigations.
The perturbation amplitude increment is scaled by the perturbation wavelength, λ, while taking into account the effects associated with the shock strength and initial perturbation amplitude as prescribed in (6.1):
 \begin{equation}{\alpha ^\ast } = \frac{{{{\Delta a} / \lambda }}}{{F({{{a_0}} / \lambda }) \cdot {{{P_4}} / {{P_1}}}}},\end{equation}
where F(a 0/λ) accounts for the effect of the initial perturbation amplitude, a 0. As shown in figure 5(f), a 0 is found to have a negligible effect until a 0 exceeds a critical value, acr, beyond which the effects almost dissipate. Hence,
 \begin{equation}\left. {\begin{array}{cc@{}} {F({a_0}/\lambda ) = 1,}&{{a_0}/\lambda \ge {a_{cr}}/\lambda }\\ {F({a_0}/\lambda ) < 1,}&{{a_0}/\lambda < {a_{cr}}/\lambda } \end{array}} \right\},\end{equation}
where F(0) represents the cases with unperturbed surfaces. Note that F(a 0/λ) is only a function of a 0/λ, and it is independent of other variables. Thus, the derivation of F(a 0/λ) from cases in Group $\_$ a 0/D (Pr = 6 atm, L = 120 mm, ϕ 0 = 0.65) wherein acr/λ = 0.25 is applicable to other cases with varied parameter sets (Pr, L, ϕ 0). By collapsing the scaled perturbation growth curves in Group
 $\_$a 0/D (Pr = 6 atm, L = 120 mm, ϕ 0 = 0.65) into a single curve, namely the scaled growth curve of case 6-120-65-0.25, we derive the expression of F(a 0/λ) as described by (6.3), which satisfies the requirements in (6.2):
 \begin{equation}F({a_0}/\lambda ) = 1 - 0.687{\textrm{e}^{ - 17.05({a_0}/\lambda )}}.\end{equation}
For the situation in the other groups, they have the same initial perturbation amplitude, a 0/λ = 0.05, yielding a consistent value of F(a 0/λ), F(a 0/λ) = 0.71 according to (6.3). It is worth noting that the expression of F(a 0/λ) given in (6.3) merely manages to normalize out the effect of a 0 via a limited number of cases with varying a 0, no physical implications or rigorous formations being involved. The exact expression of F(a 0/λ) needs more calibrations by inspecting a larger number of cases with varying a 0.
Employing the scaled time and the scaled increment of perturbation amplitude, all data in figure 5 are scaled onto a single curve as shown in figure 21. The collapse indicates that we successfully normalize out the effects brought by the shock strength (via trare and (6.1)), the length of the granular column (via trare), the initial porosity (via trare) and the initial perturbation magnitude (via F(a 0/λ)). The predictability of the scaled growth law lies in the validity and generality of the time and length scaling methods. The former is guaranteed by the universality of trare , as the characteristic time of the SDGI as long as trare can be well defined. The length non-dimensionalization given in (6.1) is appropriate when the wavelength λ is the only relevant length scale that holds in the present study. However, it is challenging to determine λ for the initially unperturbed granular interface, wherein the scales associated with the surface roughness may well be a candidate for the characteristic length. Additionally, one should be wary of applying the length scaling method using λ on granular media with intrinsic internal scales, such as scales pertinent to the internal fabric, since these scales probably cause significant effects on the SDGI.
Temporal evolution of the perturbation amplitude. Scaled master curve of the scaled amplitude increment, a*, versus the scaled time, t*. Inset: the perturbation amplitude increment, Δa, versus time.

As addressed in § 5.4, the SDGI is initiated when the microscopic transverse particle rearrangement outpaces the macroscopic shock compaction. This microscopic instability criterion is essentially in line with the macroscopic criterion proposed by Kandan et al. (Reference Kandan, Khaderi, Wadley and Deshpande2017), wherein the granular materials are modelled as an isotropic elastic–plastic J2 flow theory solid. Kandan et al. argued that the pressure gradient behind the transmitted wave front should be sufficiently high to cause plastic deformations therein, a precursor for the SDGI. For granular materials, the macroscopic plastic deformations are mediated by microscopic particle rearrangements. Based on the dimensionless number τ, we also demonstrate that a threshold pressure gradient as expressed in (5.12) is required for growth initiation. Furthermore, our instability criterion sheds new light on the instability map constructed by Kandan et al. in terms of the macroscopic properties of granular materials, namely the bulk density (ρb), Young's modulus (E), yield stress (σy) and friction angle (μ). The first three macroscopic properties, ρb, E, σy, are functions of the microscopic parameters, ρp, ϕ 0, dp, whose influences are quantified in our instability criterion. More importantly, other structural parameters, such as the perturbation amplitude, a 0, and the shock compacted particle volume fraction, ϕcomp, which is especially relevant to loosely packed particles, are incorporated into our instability criterion. The follow-up work will further consider the interparticle friction and the particle morphology and the microscopic parameters affecting the macroscopic friction angle of granular materials.
7. Conclusion
This study reveals a novel shock-induced interfacial instability involving dense granular media, the SDGI, which has unique initiation criteria and perturbation growth laws distinctly different from those of RMI or SDMI. In contrast with the interfacial vortex deposition mechanism, the SDGI arises from heterogeneous interfacial granular flows governed by the evolving coupling between the shock, interstitial gas flows and particles. The crossovers between three sequential perturbation growth regimes characterized by linear, exponential and quadratic polynomial growth curves correspond to the transitions of the dominant mechanisms featuring the shock interaction, rarefaction acceleration and semisteady diffusive pressure field, respectively. Theoretical models are proposed to predict the upper limit of the growth rate during the first stage and the characteristic growth rate during the third stage. A scaled growth law is found after normalizing the time by the rarefaction propagation time and properly accounting for shock strength and initial perturbation effects in the length non-dimensionalization. The findings shed fundamental light on transient multiphase flows involving complicated wave spectra and the resultant interfacial instabilities.
Declaration of interests
The authors report no conflict of interest.
Appendix A. Delineation of the granular column surface
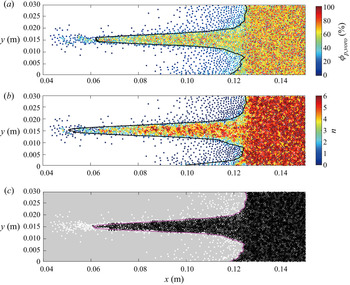
Only if the destabilized surface of the granular column is properly defined can the growth rate of the perturbation amplitude be correctly derived. One major task is to remove the scattered particles breaking away from the finger-like protrusion or the column bulk, as shown in figure 22. A dual criterion is adopted to distinguish the scattered particles from densely compacted particles. Specifically, for densely packed particles, the instantaneous local particle volume fraction, ϕp ,voro, ought to be greater than ϕ 0 − 0.1, while its coordination number n ought to be greater than 2. We use Voronoi tessellation (obtained with Voro++; Rycroft, Reference Rycroft2009) to calculate the ϕp ,voro values of each parcel (defined as the parcel's area divided by the area of its Voronoi cell). Figures 22(a) and 22(b) show the spatial distributions of ϕp ,voro and n in the neighbourhood of the front surface, respectively. We segment parcels in figures 22(a) and 22(b) such that all parcels that satisfy both criteria ϕp ,voro > ϕ 0 − 0.1 and n > 2 are assigned the value 1 (white), while the rest are assigned the value 0 (black). The result of this image segmentation is shown in figure 22(c) which yields a well-defined envelope of the column surface. We proceed to bin the particle column at a given t along the y axis and locate the leftmost parcel (with the smallest x coordinate) in each bin. These parcels constitute the envelope of the downstream surface, as illustrated in figure 22(c). The morphological evolutions of the downstream surfaces of particle columns derived in this way are shown in figure 4.
Images of the elongating spikes consisting of particles coloured by the local particle volume fraction, ϕp ,voro (a), and coordinate number (b). (c) Binarized image of the spike using the dual criterion. The profiles of spikes extracted via the ϕp ,voro criterion, the coordinate number criterion and the dual criterion are superimposed in (a–c), respectively.

Appendix B. Vortices along the shock-impinged granular surface
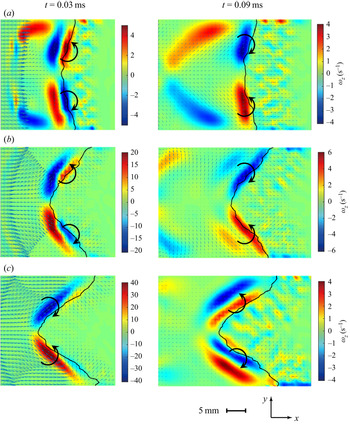
Figure 23(a–c) shows instantaneous snapshots of vorticity fields upon and after the shock interaction for cases 6-120-65-0.05, 6-120-65-0.15 and 6-120-65-0.25. For the case with a small perturbation amplitude (6-120-65-0.05), upon shock interaction, two vortex pairs emerge at the upper and lower half of the front surface. Each pair consists of two counter-rotating vortices on either side of the front surface. The clockwise vortex in the upper pair and the counter-clockwise vortex in the lower pair, both enclosed by the front surface, potentially contribute to the reversal of the convex perturbation. As the reflected shock travels far away from the surface, the two vortex pairs are reduced to one pair consisting of an upper counter-clockwise vortex and a lower clockwise vortex with much reduced intensities. The evolution of vortex pairs near the surface undergoes dramatic changes with increasing a 0. For case 6-120-65-0.025, the shock interaction induces one vortex pair consisting of an upper counter-clockwise vortex and a lower clockwise vortex, which transitions to two vortex pairs with much lower intensities as the reflected shock travels far away. The interfacial gaseous vortices evolve with the gas flows induced by the shock interaction with the perturbed surface. Hence, vorticity deposition is not the driving mechanism of the SDGI but rather the result of the interference of the granular surface on the shocked flows.
Instantaneous snapshots of the vorticity fields upon the shock interaction (left) and as the reflected shock travels away from the surface (right) for cases 6-120-65-0.05 (a), 6-120-65-0.15 (b) and 6-120-65-0.25(c).

Appendix C. Relation between the pressure gradient force
The diffusive pressure field in the wake of the transmitted wave propagating through particles is dominated by the shock-induced gas flows through particles. Ergun developed a nonlinear model accounting for the pressure drop associated with the infiltration-flow behaviour, as given in (C1):
 \begin{equation}\boldsymbol{\nabla }P = 150\frac{{{\mu _g}\phi _p^2}}{{{{(1 - {\phi _p})}^2}}}\frac{1}{{d_p^2}}({\boldsymbol{u}_g} - {\boldsymbol{u}_p}) + 1.75\frac{{{\rho _g}{\phi _p}}}{{1 - {\phi _p}}}\frac{{|{{\boldsymbol{u}_g} - {\boldsymbol{u}_p}} |}}{{{d_p}}}\boldsymbol{\cdot }{\bf (}{\boldsymbol{u}_g} - {\boldsymbol{u}_p}),\end{equation}
where μg, ρg and ug are the dynamic viscosity, density and velocity of gases, respectively. In the case wherein the compaction front exceeds the reach of the diffusive pressure field, the particle volume fraction ϕp = ϕcomp. Otherwise, the pressure gradient curve becomes piecewise since ϕp = ϕcomp for compacted particles and ϕp = ϕ 0 for particles beyond the compaction front. The first term on the right-hand side represents the linear dependence on the velocity difference, while the second term introduces a nonlinear dependence. Equation (C2) incorporates both the Darcy and Forchheimer mechanisms. The pressure gradient force exerted on particles per unit mass,  ${\boldsymbol{F}_{\boldsymbol{\nabla }P}}$, becomes
 \begin{equation}{F_{\boldsymbol{\nabla }P}} = \boldsymbol{\nabla }P/{\rho _p} = 150\frac{{{\mu _g}}}{{{\rho _p}}}\frac{{\phi _p^2}}{{{{(1 - {\phi _p})}^2}}}\frac{1}{{d_p^2}}({\boldsymbol{u}_g} - {\boldsymbol{u}_p}) + 1.75\frac{{{\rho _g}}}{{{\rho _p}}}\frac{{{\phi _p}}}{{1 - {\phi _p}}}\frac{{|{{\boldsymbol{u}_g} - {\boldsymbol{u}_p}} |}}{{{d_p}}}\boldsymbol{\cdot }({\boldsymbol{u}_g} - {\boldsymbol{u}_p}).\end{equation}
Note that units of  ${\boldsymbol{F}_{\boldsymbol{\nabla }P}}$ are m s−2.
The drag force of particles is calculated by the Di Felice model combined with Ergun's equation as expressed in (C3):
 \begin{equation}{F_{drag}} = 150\frac{{{\mu _f}}}{{{\rho _p}}}\frac{{{\phi _p}}}{{1 - {\phi _p}}}\frac{1}{{d_p^2}}({\boldsymbol{u}_f} - {\boldsymbol{u}_p}) + 1.75\frac{{{\rho _f}}}{{{\rho _p}}}\frac{{|{{\boldsymbol{u}_f} - {\boldsymbol{u}_p}} |}}{{{d_p}}}\boldsymbol{\cdot }({\boldsymbol{u}_f} - {\boldsymbol{u}_p}).\end{equation}
Comparing the formulations of  ${\boldsymbol{F}_{\boldsymbol{\nabla }P}}$ (equation (C2)) and Fdrag (equation (C3)), there exists a relationship between
 ${\boldsymbol{F}_{\boldsymbol{\nabla }P}}$ and Fdrag:
 \begin{equation}{F_{drag}} = \frac{{1 - {\phi _p}}}{{{\phi _p}}}{F_{\boldsymbol{\nabla }P}}.\end{equation}
Appendix D. Characterization of the transverse granular flows
The transverse granular flows from bubbles to spikes dramatically evolve in terms of the velocities and spatial distributions. Thus, we define a transverse flux integral,  ${\dot{m}_y}(t)$, to characterize the instantaneous intensity values of the transverse granular flows:
 \begin{equation}{\dot{m}_y}(t) = \sum\limits_{i = 1}^{{N_y}(t)} {{m_{p,i}}({x_i}){u_{py,i}}({x_i}),}\end{equation}
where Ny(t) is the total parcel number inside the interfacial area wherein the transverse granular flows are non-trivial. This interfacial area is denoted as  $\varOmega_{tran}$. As expressed in (D1),
 ${\dot{m}_y}(t)$ sums up the particle mass flux inside
 $\varOmega_{tran}$. We first determine the boundary of
 $\varOmega_{tran}$ by examining the variations in the coarse-grained transverse particle velocity
 $(\overline {|{u_{py}}|} )$ along the x axis, as shown in figure 24(b). The front beyond which
 $\overline {|{u_{py}}|} $ becomes negligible is defined as the far end of
 $\varOmega_{tran}$. The temporal variations in
 ${\dot{m}_y}(t)$ are plotted in figure 12.
Transverse granular flows in terms of upy and the boundary of  $\varOmega_{tran}$ (a) and the variations in the coarse-grained transverse particle velocity
 $(\overline {|{u_{py}}|} )$ along the x axis (b).

Appendix E. Approach to obtain the rarefaction time
The rarefaction time, trare, is defined as the time it takes for the rarefaction wave to propagate from the rear surface of the column to the front surface. The start time of the rarefaction wave corresponds to the time the compaction wave reflects off the rear surface, trare ,start. The time at which the upstream-propagating rarefaction wave reaches the front surface, trare ,end, is determined from the axial variations in the particle velocity. As shown in figure 25(a–c), particles in the wake of the rarefaction front undergo a persistent acceleration, while particles ahead of the rarefaction front remain compact and have a constant velocity. Accordingly, the profiles of the coarse-grained axial particle velocity  $(\overline {|{u_{px}}|} )$ along the x axis display a plateau followed by a gradually elevated segment, as shown in figure 25(d). The deflection points between these two segments indicate the locations of the rarefaction front. Hence, we can detect the moment the rarefaction front arrives at the front surface, more specifically the root of the surficial protrusion, from the
 $\overline {|{u_{px}}|} (x)$ profiles, as indicated in figure 25(d). For case 6-120-50-0.05, trare ,start = 3.13 and trare ,end = 3.71 ms, leading to trare = 0.58. The rarefaction times for all cases obtained in this way are summarized in table 2 in Appendix F.
(a–c) Snapshots of the particle columns during the upstream propagation of the rarefaction front denoted by the dashed lines for case 6-120-50-0.05, wherein particles are rendered according to the magnitude of particle velocities. The times of (a–c) are 3.25, 3.48 and 3.71 ms, respectively. (d) The  $\overline {|{u_{px}}|} (x)$ profiles at times corresponding to (a–c), wherein the filled and open circles denote the locations of the front surfaces and the rarefaction fronts, respectively.

Appendix F. Characteristic variables of the perturbation growth laws
To provide more details for the whole growth history of the perturbation amplitude, table 2 summarizes the values of some key variables that characterize the growth laws for all investigated cases. Times tLE and tEQ define the transition times between the three consequent growth regimes that feature different growth laws. Since the third growth regime exhibits a quadratic polynomial growth of perturbation amplitude as formulated in (5.15), we can predict Δa(t) (t > tEQ) via the values of ΔaEQ, ub ,EQ and us ,EQ, which denote the perturbation amplitude increment and the bubble and spike velocities at tEQ, respectively. Values of the pertinent parameters except  ${\dot{u}_{b,III}}$, together with the coefficient of determination,
 $R_{III}^2$, are given in table 2. The fairly high coefficients of determination guarantee the validity of the predictions by (5.15) and corroborate our arguments.