

1. Introduction
In an earlier issue of this journal Wichmann (Reference Wichmann2005) showed how the sizes of languages families, measured in terms of the number of languages of which they are comprised, conform to a so-called ‘power-law’ or ‘Pareto distribution’, a special instance of which is better known to linguists as ‘Zipf's law’. Such distributions are frequently found in both the physical and social universes. It was also observed, however, that the sizes of languages (in terms of numbers of speakers) have a different kind of distribution. Wichmann called for computer simulations that might help us in understanding how such distributions can come about. The present paper, which represents the culmination of much recent work on the quantitative modelling of language distributions, addresses this concern. It presents simulation models which may help us to investigate past events leading to the current global language situation and which may potentially serve to simulate the future of global linguistic diversity.
At the time of Wichmann's writing, work on computer simulations of the interaction among languages had already started to take flight among scholars in physics departments following in the footsteps of Abrams and Strogatz (Reference Abrams and Strogatz2003). Schulze et al. (Reference Schulze, Stauffer and Wichmann2008) provide a recent review of this work (cf. also Wichmann et al. Reference Wichmann, Stauffer, Welington, Lima and Schulze2007 for a generous list of references). Moreover, a few years earlier than Wichmann, physicist Damian Zanette and biologist William Sutherland had respectively plotted language family sizes and language populations (Zanette Reference Zanette2001, Sutherland Reference Sutherland2003). While most simulations have been concerned with speaker populations, some have concentrated on modelling taxonomic structures similar to language families (Wang & Minett Reference Wang and Minett2005, Tuncay Reference Tuncay2007, Wichmann et al. Reference Wichmann, Stauffer, Welington, Lima and Schulze2007, Schulze, Stauffer & Wichmann Reference Schulze, Stauffer and Wichmann2008). In spite of progress, none of these simulations have simultaneously succeeded in capturing both the current distribution of language sizes in terms of speaker populations (henceforth ‘language sizes’) and the distribution of language family sizes in terms of the number of languages in families (henceforth ‘language family sizes’). This is achieved in the present paper, which uses simulations of languages with internal structure (represented as bit-strings), and in which a taxonomy of languages is developed through a branching mechanism starting from a single ancestor. The population dynamics model that we will use is based on de Oliveira et al. (Reference de Oliveira, Stauffer, Welington, Lima, de Oliveira Sousa, Schulze and de Oliveira2007), which has been shown to provide a good match to empirically observed distributions of numbers of speakers across the languages of the world. In this paper, an additional level of structure is added to the model, that of language families, providing a way to model empirical data about sizes of language families.
The properties of evolutionary systems can be divided into two different kinds: those which depend on the particular historical contingencies that have occurred during the evolution, and those which depend only on the general rules of dynamics that determine how new elements of the system inherit their properties from other already-existing elements. Such inheritance necessarily has a stochastic character, as is exemplified by the random genetic mutations that take place between parents and their offspring and which follow well-defined probability rules. The sequence of events can be described by a bifurcating historical tree, each branch corresponding to some event which has occurred in reality. If it were possible to return back to some point in the remote past and to construct an historical evolution all over again from that point on, then one would see a different tree evolving, even if the same rules of dynamics were applied. Some characteristics of the new tree would differ from the real tree representing what has occurred in reality. Some other characteristics, however, will be the same because both the real and the imaginary tree follow the same dynamic, stochastic inheritance rule. These universal characteristics relate to the general topology of the tree, not to whether a particular branch appears or not. The aim of computer models like ours is to identify and reproduce universal, history-independent features, simulating an artificial dynamic evolution. The method consists in proposing a set of stochastic inheritance rules, and then verifying which characteristics coincide with reality. From the result, one can predict some future properties which will occur independently of unpredictable contingencies. On the other hand, these models are not supposed to give any clue about details such as the particular internal structure of some language or language family.
2. Family definition
World geography is simulated by operating with a large square lattice on which populations can grow and migrate. We then simulate the development of linguistic taxa as follows (cf. the appendix for more detail). Initially, only the central point of the lattice is occupied by one group of people speaking one original language. This language (and subsequent ones) is modelled as a string of bits which can take the values 0 or 1. These are imagined to correspond to different prominent typological features. The population grows and spreads over the whole lattice, with languages diffusing as the populations diffuse. When a new site becomes occupied there is a certain probability that a change will occur in one of the bits of the language of the population occupying the new site. If such a change occurs (and if the resulting bit-string is not identical with one already occurring elsewhere), the resulting language is defined as being a new language different from but descending from the language that underwent the change. Furthermore, with probability 1/2 this new language is defined as the starting point of a new language family, with all its later descendants belonging to this one family. If no new family is created by the new language, then all its later offspring again have the chance to found with probability 1/2 a new family, whenever another new language is created. The family-founding events correspond to the perceived continuities in the phylogenetic landscape of the world's languages.
The definition entails three assumptions: (i) language was only created once and thus all languages descend from a common proto-World language; (ii) linguistic diversity arises from changes that are stochastic in nature; (iii) there are three major taxonomic levels: proto-World, the family level, and the language level. Assumption (i) cannot presently be proven, but is a reasonable one, and additionally obeys Occam's razor. If assumption (ii), seen as an assumption about the majority of linguistic changes, did not hold, linguists would be able to predict how and when languages change, which they clearly cannot. There is also no principled way of explaining why a certain language, such a proto-Indo-European, has ‘reproductive success’ and is subsequently recognised as a founder language by linguists some thousands of years later. Our assumption that language changes are stochastic carries over to the process by which a founder language is selected, which is also stochastic. Assumption (iii) is obviously reductionistic since any number of taxonomic levels could be added below the family level, but here we single out families and languages because these are the levels we want to investigate. Having definitions for lower taxonomic levels (corresponding, say, to the genera of Dryer Reference Dryer, Haspelmath, Dryer, Gil and Comrie2005, or to dialects) would not necessitate a different family definition, and would therefore not change the results.
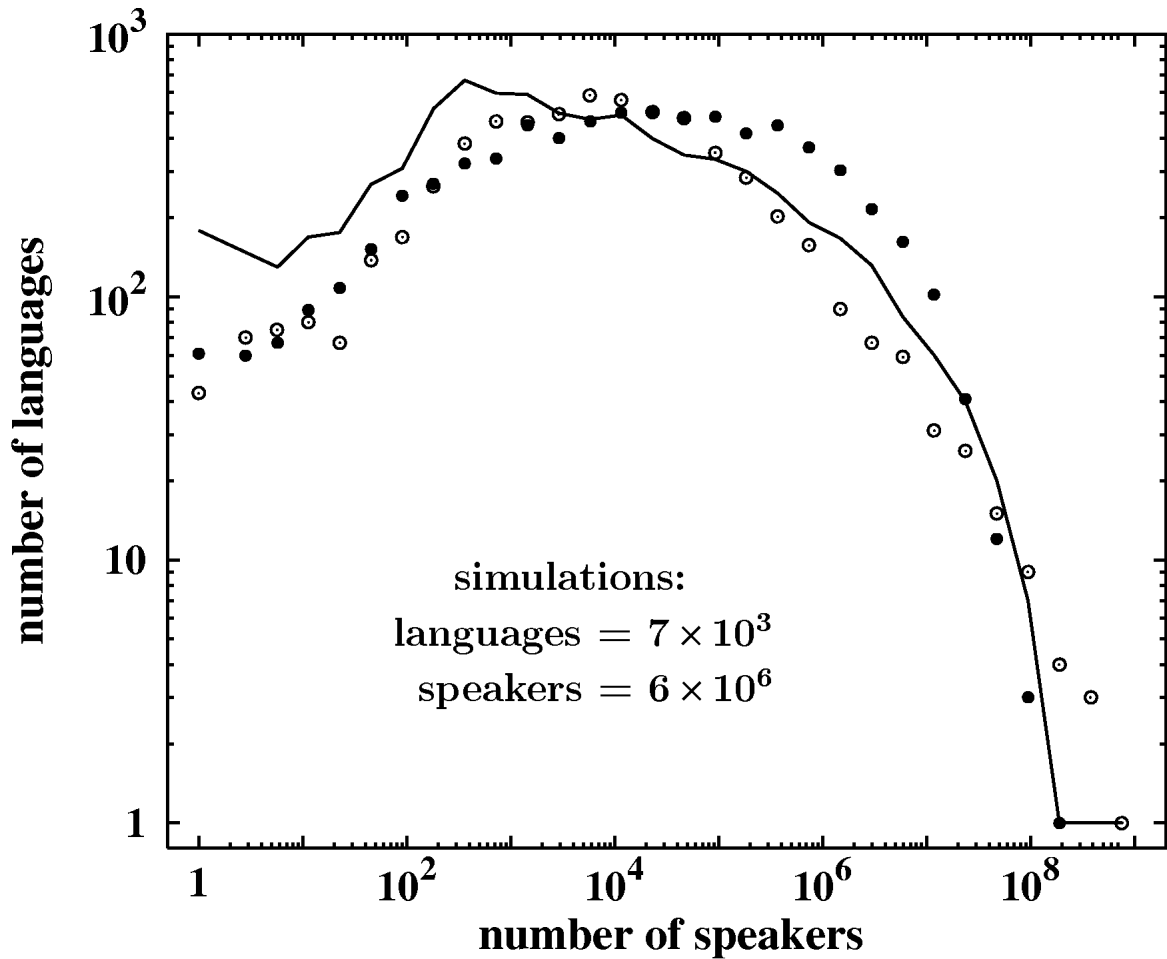
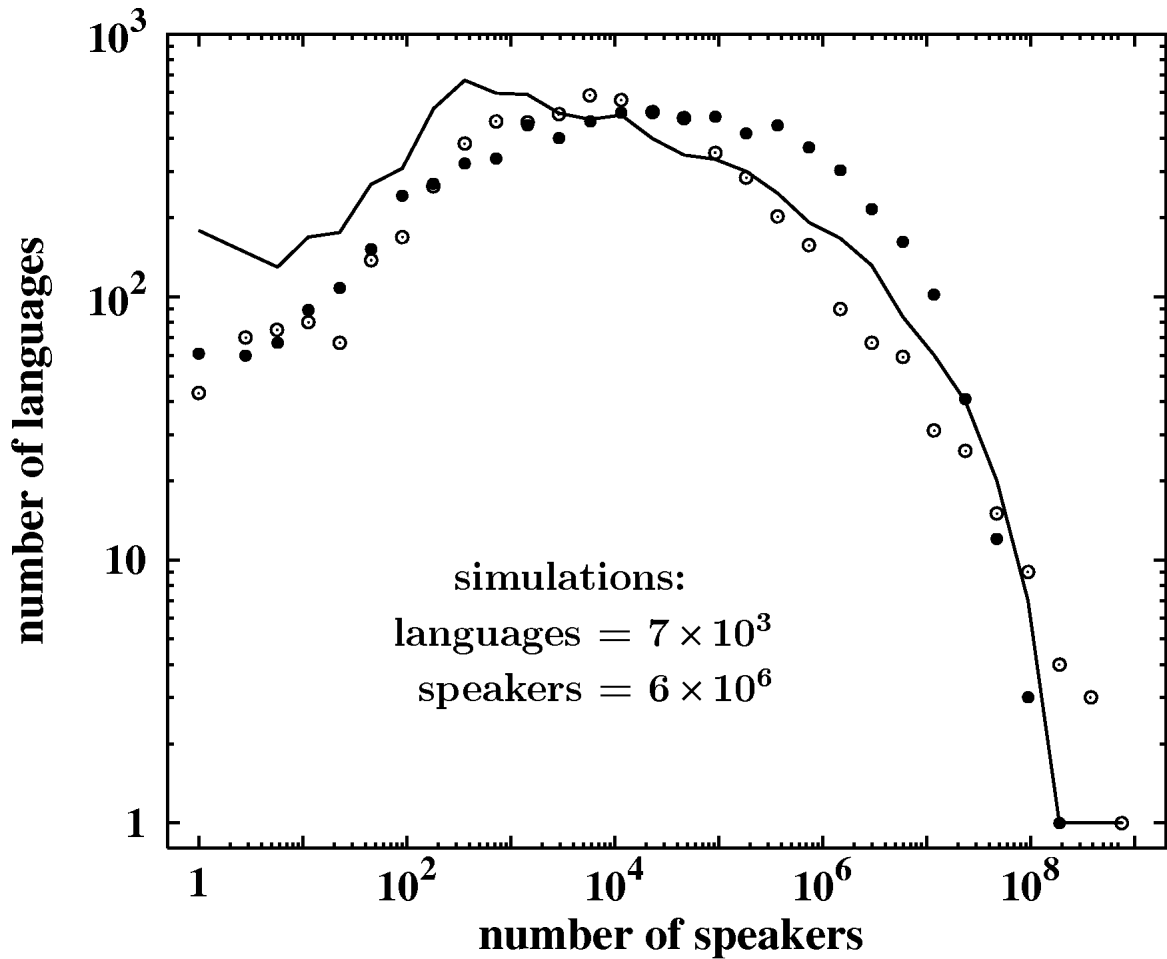
A different set-up of the simulation, starting from a random point rather than the central point, gives similar results. One might also consider a landscape with uninhabitable areas such as mountains or oceans. Building in such features simply corresponds to a reduction of the lattice space, which in turn corresponds to halting the simulation before all lattice sites are occupied. We tested the effects of this and found no differences in the results. Moreover, previous simulations of mountain ridges in the Viviane model (Schulze and Stauffer Reference Schulze and Stauffer2006) showed surprisingly little influence of the language geography. Indeed, all sorts of parameters could be added. In the somewhat different Schulze model, features such as extinction of languages, migration of peoples, diffusion of linguistic features, influence of geographical barriers, conquests, language shift, and bilingualism were tested (see Schulze et al. Reference Schulze, Stauffer and Wichmann2008 for a review). Compared to our present model, however, this model never gave as good an agreement as that seen in figure 1 for the language size distribution. This suggests that it is the differences between the core features of our model and the Schulze model which are important, not various aggregated parameters.
Empirical size distribution of the ~7000 present human languages, Grimes (Reference Grimes2000) (open circles). The full circles show one simulation of our model, with parameter values L=20,000, b=13, M=64, F max=256, α=0.07 (see appendix for these parameters). The full line corresponds to another simulation with parameter values L=11,000, b=16, M=300, F max=600, α=0.18.
A different approach to how a language family is created would be to randomly select family founders among all languages. Another is to consider as founders all languages of the second generation, counted from the ‘mother tongue’ (generation zero). Yet another is to take random languages of the fourth generation as founders. These alternative definitions were also tested, with inferior results compared to the power-law exponent measured by Wichmann (i.e. the figure −1.905 in the expression of proportionality n∝r −1.905, where n is the number of languages in a family and r the rank – in terms of numbers of languages – of a given family among the world's languages). Not only do these definitions not work as well, they are also less realistic since they do not involve language change as a prerequisite for genealogical differentiation. In our preferred definition a historical taxonomic hierarchy arises, and the resulting system of languages develops as follows. The ‘mother tongue’ is a family founder with certainty. Its direct descendants form the first generation, and each of these with a 1/2 probability becomes a new family founder. Each language of the second generation has on average a corresponding probability 1/4 of being a family founder, the third generation 1/8, etc. Therefore, a new language's chance of becoming a family founder depends on which other languages have already founded other families in the past, since the very beginning.
3. Results
The distribution of languages as a function of the number of speakers is known to be roughly log-normal, with an enhanced number of languages for very small sizes (Grimes Reference Grimes2000, Sutherland Reference Sutherland2003). Figure 1 compares reality with new simulations of the Viviane model (de Oliveira et al. Reference de Oliveira, Campos, Gomes and Tsang2006a, Reference de Oliveira, Gomes and Tsangb), as modified in de Oliveira et al. (Reference de Oliveira, Stauffer, Welington, Lima, de Oliveira Sousa, Schulze and de Oliveira2007), and as explained again in the appendix.
Different parameters give different curves, of which two are shown in figure 1, but the curves always have the same overall log-normal shape with enhancement at small language sizes. That is, by changing the parameters one can fine-tune both the height and the width of the curve. However, the same overall parabolic shape with deviations at the left always appears, for completely different sets of parameters. The points at the left represent languages spoken by very few people; the last point to the right represents the number of people speaking the largest language; and the height of the curve is related to the total number of languages (the integral). Within the model it is possible, for instance, to create a curve where the largest language is spoken by not one billion people but instead one million. One could also tune it to show, say, one thousand rather than seven thousand languages. Such adjustments, which might be imagined to take us back to some early stage in the evolution of linguistic diversity, do not change the shape of the curve, which is still log-normal with deviations for small languages. Thus, the overall shape of figure 1 is universal although its precise height and width depend on the numbers of speakers and languages. Different runs of simulations using one and the same set of parameters were also made. Deviations between different runs were mostly of the order of the size of the dots in the plot.
Once parameters were fitted to produce the results for language sizes shown in figure 1 they were not adjusted further in order to capture the family size distributions. The latter thus followed directly from the same settings which produced the full circles in figure 1.
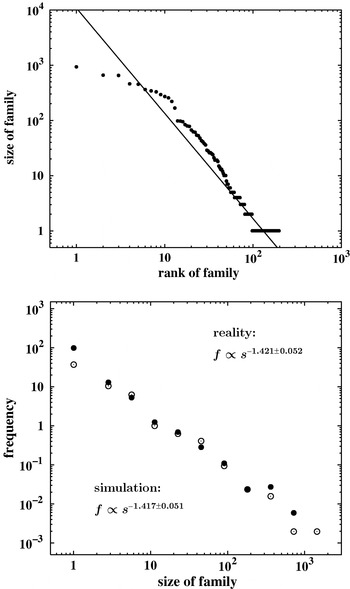
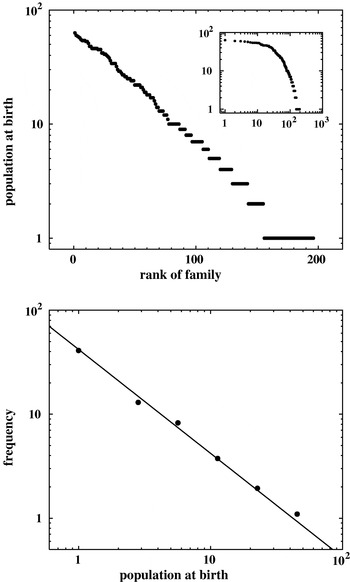
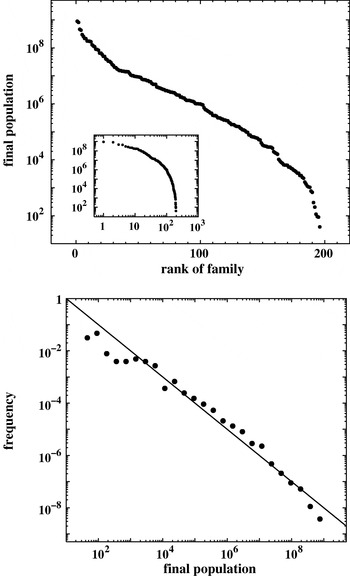
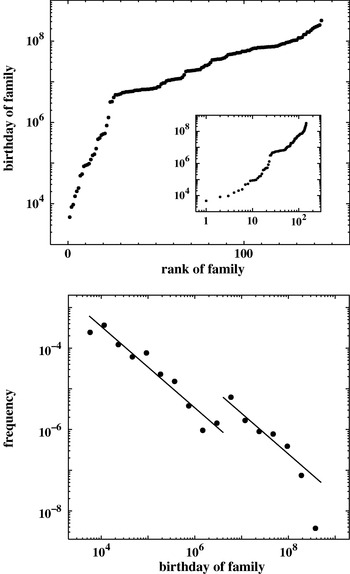
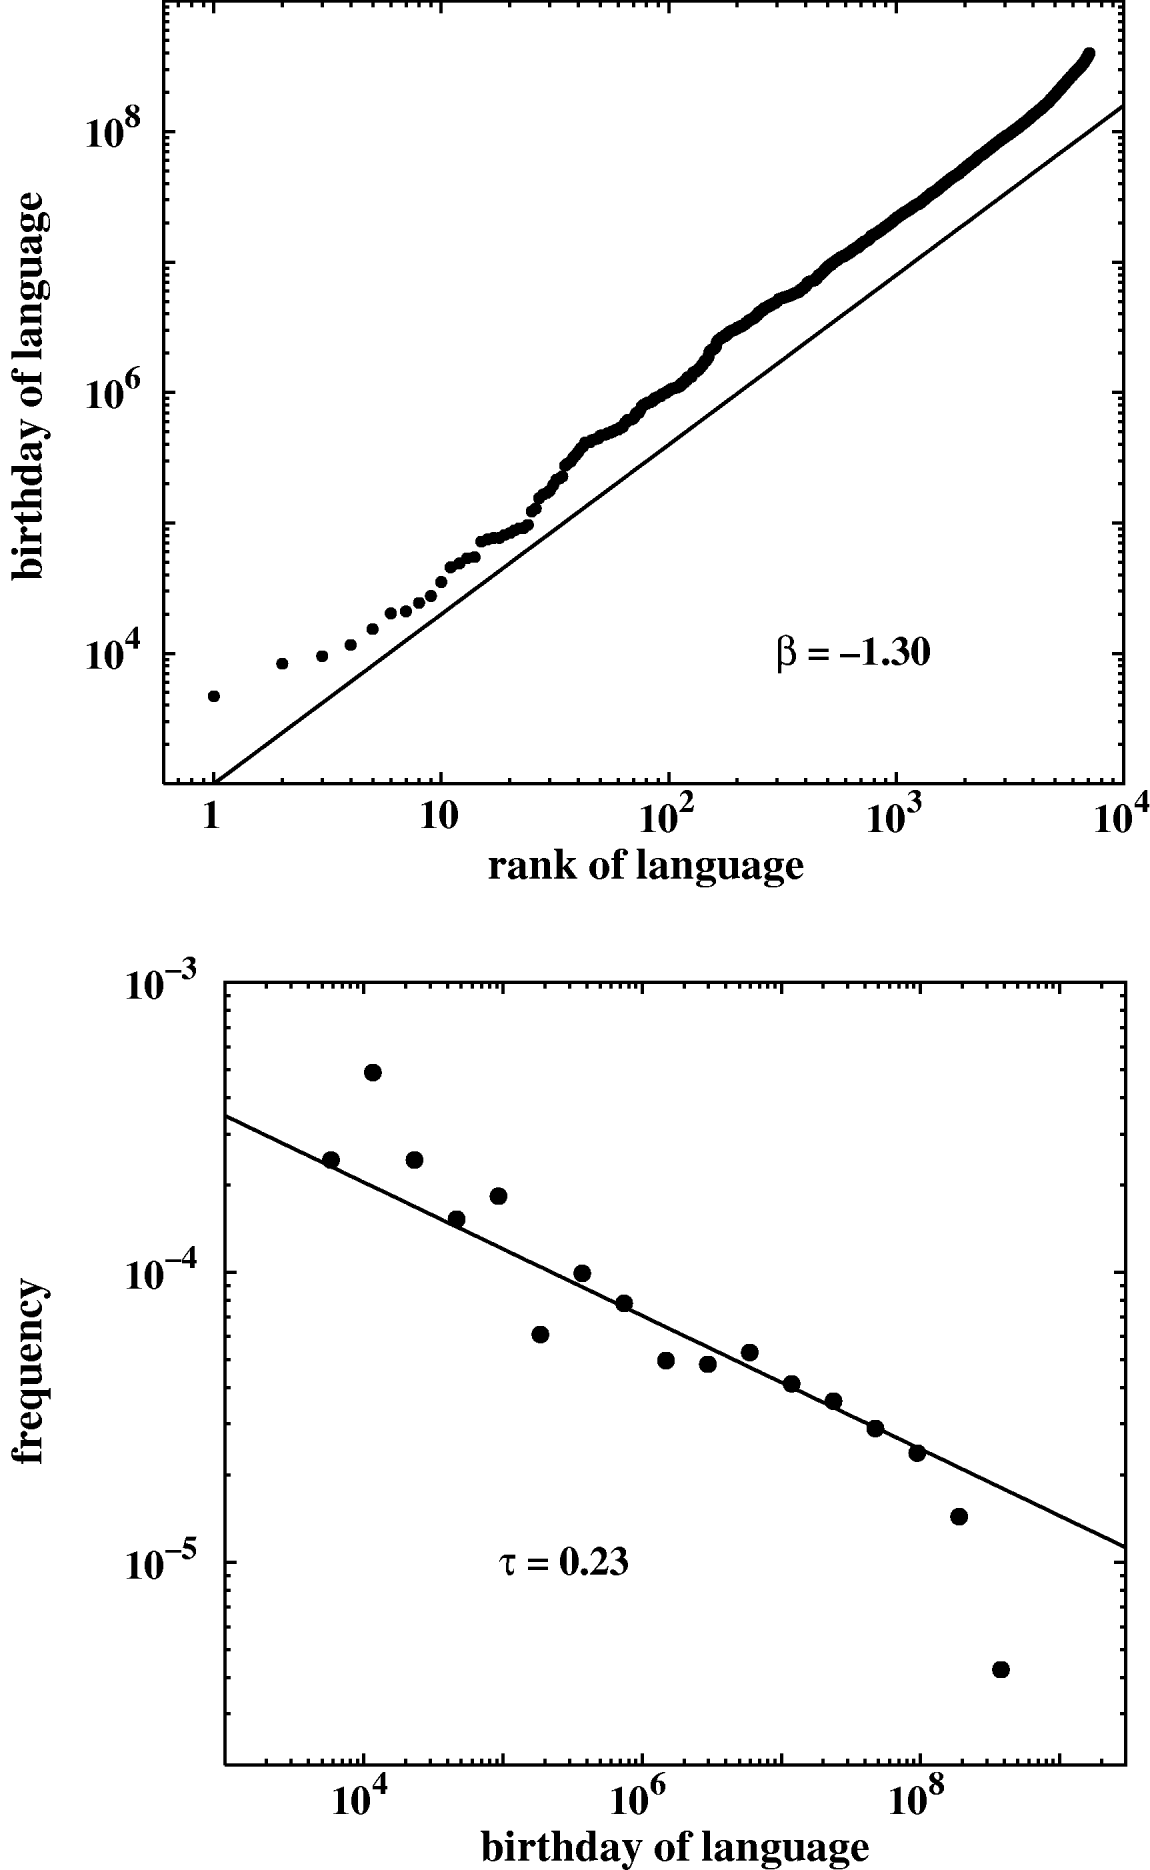
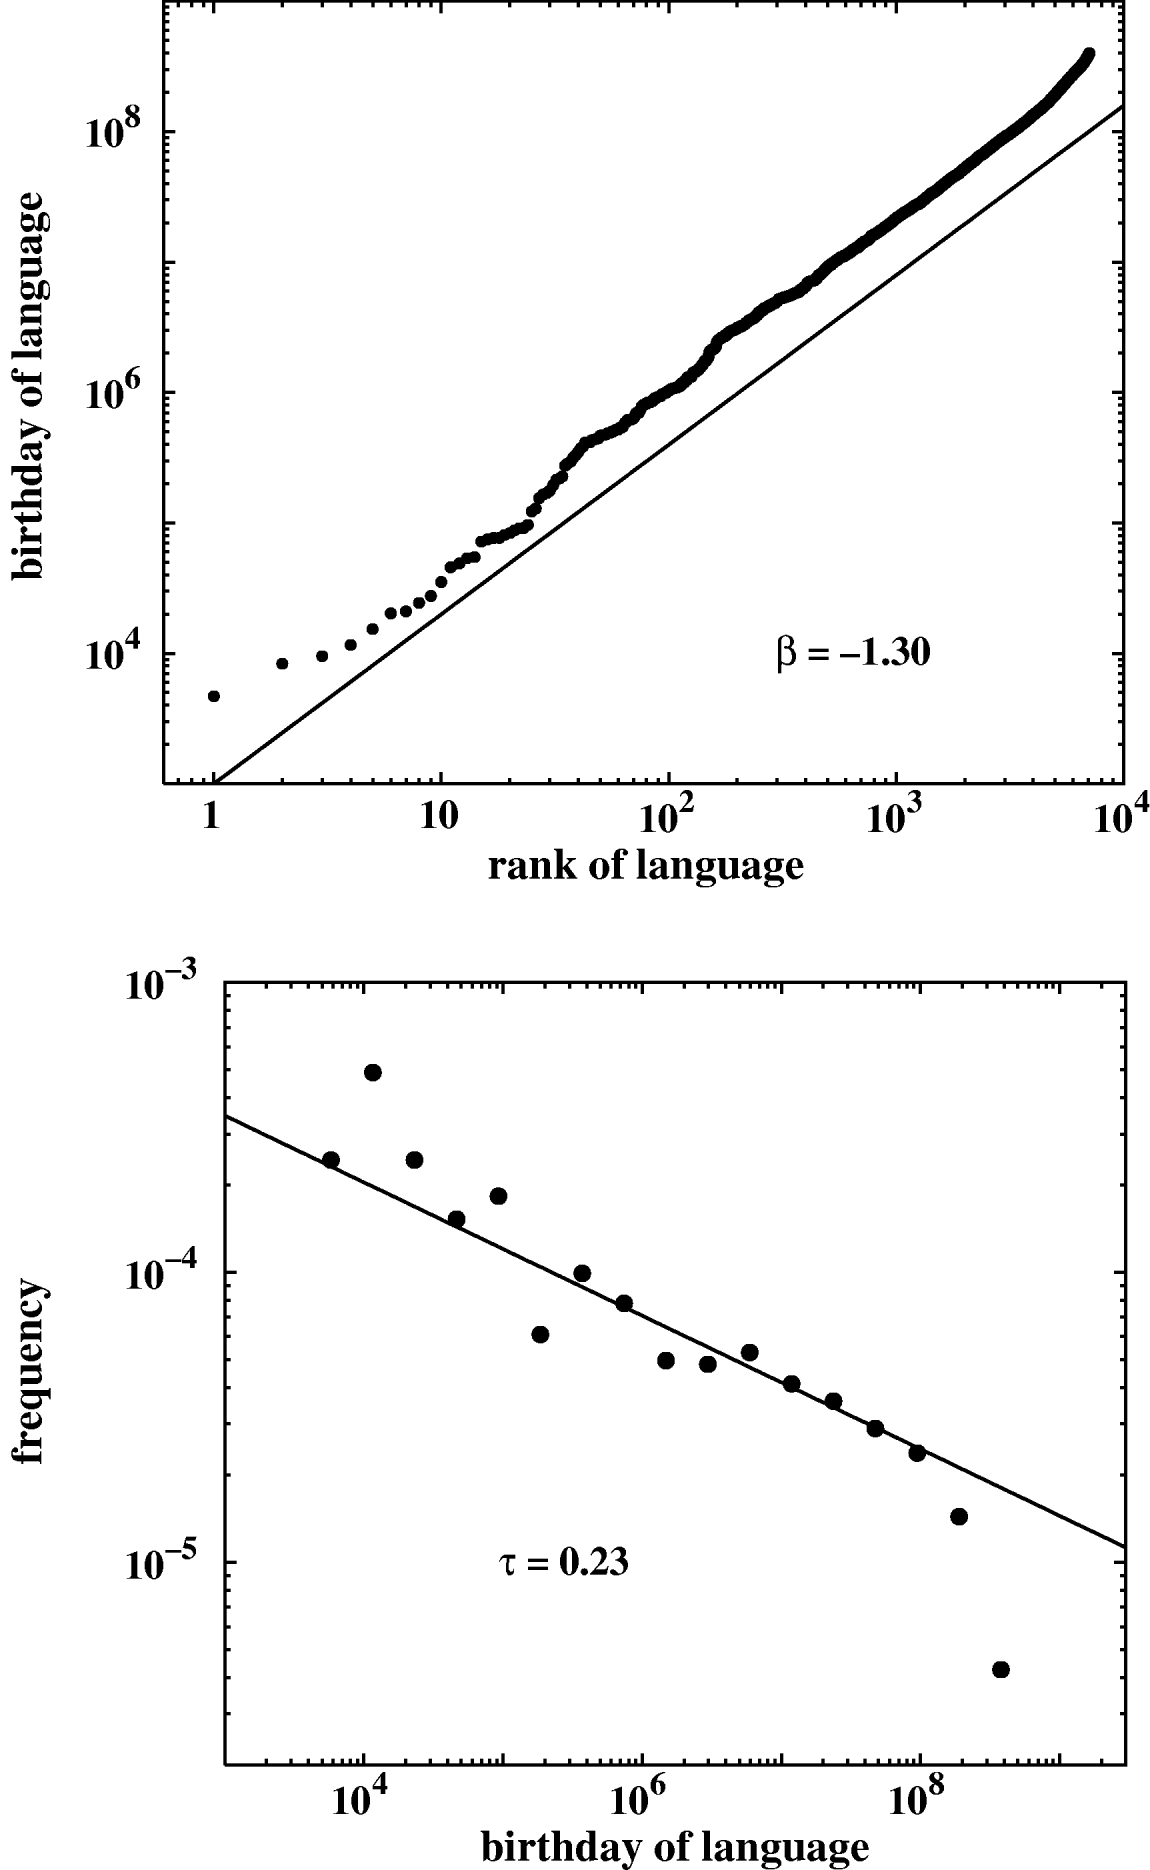
The plots in figures 2–6 all consist of two parts: a rank plot on top and a histogram below it. In figure 2, for example, for the size (=number of languages in a language family) the rank plot shows the largest family at its left end, followed by the second-largest family, then the third-largest family, etc. The histogram below shows at its left end the number of families containing only one language (‘isolates’), followed by those containing two, three, and more languages. To avoid overcrowding in the plots, we binned sizes together by factors of two. This means that sizes 2 and 3 give one point, all sizes from 4 to 7 give the next point, all sizes from 8 to 15 the next, etc. The resulting sum was divided by the length 2, 4, 8, … of the respective binning interval, thus giving the frequency. This division was not performed in figure 1, which gives the summed numbers. If the rank plot is described by a power-law s∝r −β (where the symbol ∝ represents proportionality), then the corresponding frequency plot is also described by a power-law f∝s −τ, where β=1/(τ−1). In the particular case of τ=1 the corresponding rank plot is no longer described by a power-law, but by an exponential function s∝exp(λr).
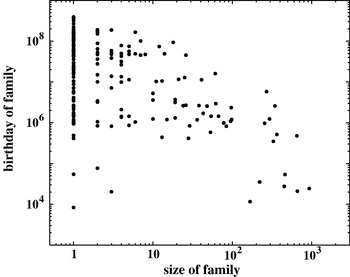
Figure 2 gives the number of languages in each family. Figure 3 shows the initial population of each language at the site where it gave rise to a new family. Figure 4 gives the number of speakers in each family. This turns out to be proportional to the number of lattice sites occupied by the speakers of the given family (not shown). Finally, figure 5 shows the birthday (number of iterations since the start of the simulation, i.e. total simulation time minus present age of family) of each family. In all cases the histogram roughly follows a power-law (straight line in our log–log plots), and figure 2, our most important plot, shows that the rank plot, too, follows a power-law compatible with Wichmann's exponent 1.905. The histograms are more sensitive as tests of the power-laws than the rank plots, both for reality and for simulations.
Number of languages in a family. The straight line is not a fit on these data but the fit of Wichmann (Reference Wichmann2005) on his rank plot taken from real languages (Grimes Reference Grimes2000). In the lower plot, full circles represent simulated data points and open circles empirical data points.

Initial population of the founder of a family. Ranking in the upper plot is by population size. Different from the log–log plot, the ranking is now displayed with a linear horizontal scale, for which the straight behaviour shown in the upper plot indicates an exponential decay. The inset here (same for figures 4 and 5) shows the corresponding log–log curved plot. Accordingly, the straight line on the frequency plot (below) gives τ=1.

Number of speakers in a family (ranking is by population size at the end of the simulation)

Birthday of a family (ranking is by birthday)

These power-laws are not valid over the whole range (Arnold & Bauer Reference Arnold and Bauer2006), neither in our simulations nor in reality: No family can contain half a language, or more than the all languages in the entire world. But the exponents in the central part are not only a convenient way to summarise the results in a single number; they also seem to have some universality in the sense that the same exponent tends to occur independently of many details of the simulations. Indeed, when we changed parameters (including the probability 1/2 of section 2) the details of our results changed but the central exponents did not change significantly.
Only the definition of families had a drastic effect on the outcome. As mentioned above, we tried a number of possible definitions. However, only the hierarchical definition presented in section 2 gives the proper exponents compared with reality, as seen in figure 2. The variation resulting from different definitions suggests that continuous branching is the most realistic description of the evolution that has led to the present phylogenetic diversity.
Figure 5 presents a curious behaviour. Instead of a single straight line, the ranking plot consists of two lines, which correspond to s∝exp(λ1r) for the older families and exp(λ2r) for the more recent ones, with λ1>λ2. This transition from one regime to the other defines a typical time scale for cases where the successive creation of new families changes rhythm such that the quantity of new families formed per time unit increases. This same general pattern appeared for different sets of parameters and/or random numbers we tested. In the frequency plot, the signature of this transition is the presence of two parallel straight lines, both corresponding to τ=1. The explanation for the knee in the upper plot of figure 5 relates to the fact that the simulations start from a single ancestor. The production of new founders is relatively slow in the beginning when there are only a few branches on the tree, but when the tree gets sufficiently complex the dynamics changes and founders are produced at shorter intervals. To test whether something similar to the knee of figure 5 occurs in reality we plotted the data for cognate percentages for most of the world's languages families, as collected by Holman (Reference Holman2004) from a variety of sources. If the assumptions of glottochronology are correct these cognate percentages should translate into ages. A curve with a shape similar to that of figure 5 results, also having a ‘knee’, even if only three families are found in the lower part of the ‘leg’: Afro-Asiatic (6% cognates), Eastern Sudanic (9% cognates), and Chibchan (11% cognates). Thus the tendency is not so pronounced. The explanation for this ‘empirical knee’ may be the same as for the behaviour of the simulations, supporting the idea that all language families derive from a common ancestor. It is equally possible, however, that the explanation relates to the fact that it gets more difficult to establish what is and what is not a cognate as the time depth increases; the deviant behaviour for a few old families, then, could be due chiefly to lack of knowledge.
The rhythm of successive appearance of new languages (not families), as shown in figure 6, does not exhibit the kind of transition between two regimes that we saw for families. Instead, both the ranking and the frequency plot seem to be described by power-laws.
Birthday of a language (not family) (ranking by birthday). In the upper plot the best-fit line is displaced for better visibility but with no change to the slope.
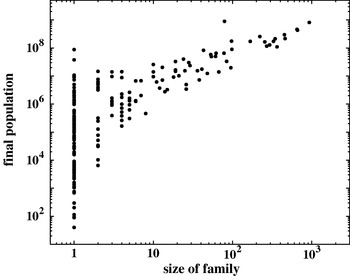
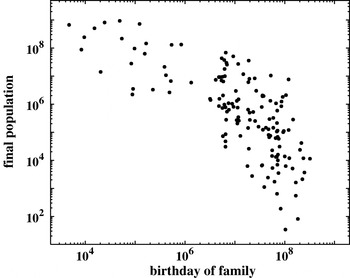
We also looked at correlations between the various results. Area and population are proportional to each other apart from statistical fluctuations, as expected. It is also not surprising that the final population increases with the size of the family (figure 7), and decreases with the birthday of the family (figure 8), both in a nonlinear way (birthdays are numbered iterations counted from the beginning of the simulation). Figure 9 shows only a weak correlation between birthday and family size. This is compatible with reality, where the size of a language family is not necessarily an indicator of its age.
Strong correlation between family population and family size. Each point corresponds to a family. Neither averaging nor binning is used in the scatter plots of figures 7–9.

Strong correlation between family birthday and family population

Weak correlation between family size and family birthday

Using a slightly different program, we found that the average number of generations from a final language back to the one original language increases about logarithmically for large lattice sizes but more weakly for small lattices. In all of the above simulation versions the language spoken at one site never changes after the site becomes inhabited. To investigate the effects of correcting for this unrealistic assumption we also included a later diffusion of language features to and from already-occupied neighbour sites, for all or for only selected bit positions. With strong diffusion we found a strong reduction in the number of languages, without a drastic change in the family size histogram.
4. Outlook
Our simulations yielded a surprisingly good agreement with reality for the rank plot of family sizes, cf. figure 2a. In earlier work (de Oliveira et al. Reference de Oliveira, Campos, Gomes and Tsang2006a, Reference de Oliveira, Gomes and Tsangb), the number of languages as a function of occupied area was already found to agree with reality (Nettle Reference Nettle1998). Since one and the same model can produce both the current language size distribution and the family size distribution, these two distributions are not likely to be somehow out of tune due to the current rapid extinction of many languages – a possibility very tentatively raised by Wichmann (Reference Wichmann2005: 128).
Given that the model is sufficiently fine-tuned to capture the quantitative distributions just mentioned it may be considered an adequate starting-point for addressing other problem areas that invite simulations. Unlike some other models that operate with languages that lack internal structure, the combined Schulze–Viviane model characterises languages structurally in terms of bit-strings. This makes it possible, for instance, to use the model to test how well different phylogenetic algorithms can adequately recover taxonomic relations among languages from the distributions of their typological features (cf. Wichmann & Saunders Reference Wichmann and Saunders2007). Other issues of language change can also be addressed, such as the development and distribution of creoles, large-scale diffusion of linguistic features, change rates of typological profiles, prehistoric bottle-neck effects, and last but not least the future of global linguistic diversity. We see the development of a simulation model which is both simple and versatile as the most important outcome of the present contribution.
In this paper we have simulated sizes of language families and populations. Whether a given language or language family grows or shrinks depends on many concrete historical events which we have not taken into account, such as wars, famines, etc. While such individual events are not predictable, we know from other social and physical phenomena that after a long history of interaction among many components of a system statistical properties emerge which are independent of specific events of the process. Thus, it does make sense to simulate on a computer how many languages belong to the largest family, how many to the second-largest family, etc., without specifying which particular family is the largest, or what rank a given family such as Indo-European has. The evolution (of living beings, languages, etc.) depends on the particular sequence of historical events, and contingencies that have occurred at some past time influence the future. However, for statistics involving thousands of elements, the structure of an evolutionary trajectory presents some basic universal characteristics which are independent of the particular contingencies that have occurred in reality and depend only on these contingencies having occurred according to some prescribed probability rules common to different kinds of evolutionary systems.
5. APPENDIX
5.1 Modified Viviane model
The Viviane model of language competition, as modified in de Oliveira et al. (Reference de Oliveira, Stauffer, Welington, Lima, de Oliveira Sousa, Schulze and de Oliveira2007), describes the spread of human population over a previously uninhabited continent. Each site j of a large L×L lattice can carry a population c j, chosen randomly between 1 and a maximum M, with a probability inversely proportional to c for large c – more precisely c=exp[r∗ln(M)], where r is a random number between 0 and 1. On each site only one language is spoken, characterised structurally by a string of b bits (0 or 1). Initially only the central lattice site is occupied. Then at each iteration, one empty neighbour j out of the set of unoccupied sites becomes populated by c j people. This newly inhabited site is selected by randomly choosing two empty neighbours of the set of occupied sites and by taking the one which has the larger prespecified carrying capacity c. The new site gets the language ℓ of one of the occupied neighbours i, selected with a probability proportional to the fitness of this language. This fitness F ℓ is the number of people speaking at that particular time the language ℓ spoken at site i, bounded from above by some maximum fitness chosen randomly between 1 and F max. Once the new site j is occupied, its language ℓ changes with probability α/F ℓ, with some proportionality factor α.Footnote 2 In the model such a change means that one randomly selected bit is changed. The simulation stops if all sites became occupied; the total number of languages is then the total number of different bit-strings.
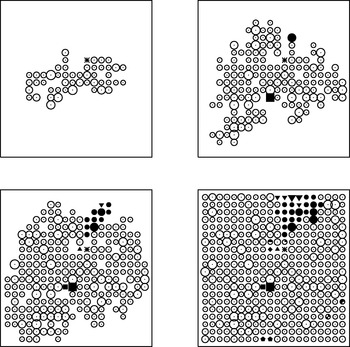
Figure A1 provides successive snapshots of the gradual occupation of the lattice. The figure is included for illustrative purposes only, so the lattice contains only 20×20 sites. At 50 time steps we see the spread of the initial language (open circles) and the birth of a second one (asterisk). The sizes of the symbols correspond to the population at each site. At 150 time steps a third (black square) and a fourth (black circle) language have been born. At 250 time steps we see the further expansions of previously born languages and the emergence of some new ones (upward and downward triangles). The final snapshot shows the the fully occupied lattice with still more new symbols for new languages, and a total of 12 languages.
Snapshots of the growth of a small lattice (top left: 50 time steps; top right: 150 time steps; lower left: 250 time steps; lower right: 400 time steps).