INTRODUCTION
Parasites are a ubiquitous but inconspicuous part of ecosystems that has largely been overlooked in ecological studies. In recent years, ecologists have increasingly recognized the importance of parasites for host populations, ecological communities, and the dynamics of entire food webs (e.g. Sousa, Reference Sousa1991; Mouritsen & Poulin, Reference Mouritsen and Poulin2002; Sukhdeo, Reference Sukhdeo2012). This also holds true for the ectoparasitic copepods of marine fish, a group of parasites with a diverse range of host species, life histories and impacts. For example, much attention has been devoted to sea lice, which are copepods parasitic on farmed salmon, due to the particularly detrimental effects on these economically valuable stocks (Tully & Nolan, Reference Tully and Nolan2002) but also due to their dramatic effects on wild salmon populations via a spill-over from aquaculture farms (Krkošek et al., Reference Krkošek, Ford, Morton, Lele, Myers and Lewis2007, Reference Krkošek, Connors, Morton, Lewis, Dill and Hilborn2011). In general, parasitic copepod species are well known and described, especially in the north-east Atlantic (Kabata, Reference Kabata1979, Reference Kabata2003; Möller & Anders, Reference Möller, Anders, Möller and Anders1986) and host–parasite lists have been compiled from various regions (e.g. Bere, Reference Bere1936; Heegaard, Reference Heegaard1962; Palm et al., Reference Palm, Klimpel and Bucher1999; Boxshall, Reference Boxshall2009). However, local inventories and quantitative data sets remain rare and are usually restricted to limited numbers of host species (e.g. Causey, Reference Causey1960; Groenewold et al., Reference Groenewold, Berghahn and Zander1996; Schmidt et al., Reference Schmidt, Zander, Körting and Steinhagen2003; Kleinertz et al., Reference Kleinertz, Klimpel and Palm2011). In addition, long-term time-series on parasitic copepod faunas are scarce.
Long-term data series on parasitism can be very informative as they help reveal links between the environment and parasite community dynamics. Parasite abundance can be strongly dependent on the presence and abundance of hosts (Poulin et al., Reference Poulin, Krasnov, Mouillot and Thieltges2011). Changes in the diversity and abundance of parasites can thus be indicative of broader changes due to environmental factors affecting hosts, such as pollution, temperature, habitat loss and exploitation of fish stocks (Vidal-Martinez et al., Reference Vidal-Martinez, Pech, Sures, Purucker and Poulin2010; Wood et al., Reference Wood, Lafferty and Micheli2010). For example, altered fish host abundance and distribution, as well as selective removal of hosts as a result of human exploitation, may lead to changes in parasite population dynamics (Wood et al., Reference Wood, Lafferty and Micheli2010).
In this study, we present the first qualitative inventory of parasitic copepods from fish in the western Wadden Sea (North Sea) based on field surveys in 1968 and 2010 and additional records from the archives of the NIOZ Royal Netherlands Institute for Sea Research. In addition, we investigate quantitative changes in the infection patterns of two copepod species (Acanthochondria cornuta (Müller, 1776) and Lepeophtheirus pectoralis (Müller, 1776)) infecting European flounders (Platichthys flesus (Linnaeus, 1758)), using data from surveys in 1968 and 2010. To link potential changes in parasite infection patterns with changes in host abundance and size, we also analysed long-term data from flounders from the NIOZ fyke net sampling programme (1960–2011).
MATERIALS AND METHODS
Acquisition of parasite inventory data
Observations of host–parasite relationships were retrieved from three sources: (1) archival data from the NIOZ Royal Netherlands Institute for Sea Research where host–parasite relationships observed during ongoing fish surveys in the western Wadden Sea and adjacent North Sea in the first half of the 1900s were noted without reporting a date or sampling effort; (2) an unpublished field survey from 1968 including sampling effort and dates; and (3) a recent field survey undertaken in May to June 2010. In both field surveys, fish were collected from several bottom- and pelagic trawls in the Wadden Sea (inshore) and North Sea (offshore) adjacent to the island of Texel in the western Wadden Sea, The Netherlands. In addition, fish caught in a fyke net located at the south of Texel were added to the sample population in both surveys (for more details on the NIOZ fyke sampling programme see Van der Veer et al., Reference van der Veer, Koot, Aarts, Dekker, Diderich, Freitas and Witte2011). Both data sets (1968 and 2010) can be considered to be comparable since the fyke net has been located at the same spot in both periods and maps in the respective internal reports indicate that the locations of the trawls were within the same area around the island of Texel.
Parasite investigations were conducted in a similar manner in both field surveys. Captured fish were identified, measured and checked for ectoparasites. In order to find parasites, the skin and fins of the host were examined, after which the skin connected to the gill flaps was incised to allow an inspection of the gill arches. All ectoparasites found were collected, counted and subsequently stored in alcohol in a separate vial per host. Whenever fish could not be examined within 15 min of capture, they were stored individually in sealed plastic bags at -20°C. Parasites were reviewed under magnification and identified to species level using Kabata (Reference Kabata2003). Since classification slightly differed in the 1968 survey, when Dogiel et al. (Reference Dogiel, Petrushevski, Polyanski and Kabata1953) and Scott & Scott (Reference Scott and Scott1912) were used for copepod identification, those parasite species were reassessed to comply with the modern classification and nomenclature as described in Kabata (Reference Kabata2003).
Temporal changes in infection patterns and host size and abundance
The 1968 data contained detailed information on the intensity (number of copepods per infected host) per host size-class of two copepod species found on European flounder (Platichthys flesus) in spring/summer: Acanthochondria cornuta and Lepeophtheirus pectoralis. Similar data for both parasite species from the same season were obtained in 2010, allowing for a comparison of host size–parasite infection level relationships between the two periods. To do so, we plotted the numbers of Acanthochondria cornuta and Lepeophtheirus pectoralis against host length and used an ANCOVA approach to test for significant changes in the slopes of the parasite intensity–host length relationships between the two periods. We tested for differences in prevalence between the two periods using a χ2 test.
Long-term trends in the abundance and size of the flounder hosts (Platichthys flesus) were investigated using data from a long-term time-series conducted by the NIOZ from a fyke net situated at the south of the island of Texel. During spring (April–June) and autumn (September–October) the catch of this fyke net is emptied almost every day (as long as the weather allows) and is considered to be a representative snapshot of the fish fauna occurring in the area (for details see Van der Veer et al., Reference van der Veer, Witte, Beumkes, Dapper, Jongejan and van der Meer1992; Van der Meer et al., Reference van der Meer, Witte and van der Veer1995). We investigated temporal trends in flounder abundance by plotting mean daily catches (ind. d−1) between 1960 and 2011. Data on the size of caught flounders were only available from 1975–2011. We plotted the frequency of flounders (total number of individuals) caught per size—class (2 cm bins) grouped into four periods: 1975–1979, 1980–1989, 1990–1999 and 2000–2011. Since these data only served as background information for interpreting the parasite data, the results were only qualitatively compared without any statistical analysis. Using the mean daily catches in 1968 and 2010, we calculated the density of infected fish (mean daily catches × copepod prevalence) and the density of copepods (mean daily catches × copepod abundance), following Hechinger et al. (Reference Hechinger, Lafferty and Kuris2008).
RESULTS
Parasite inventory
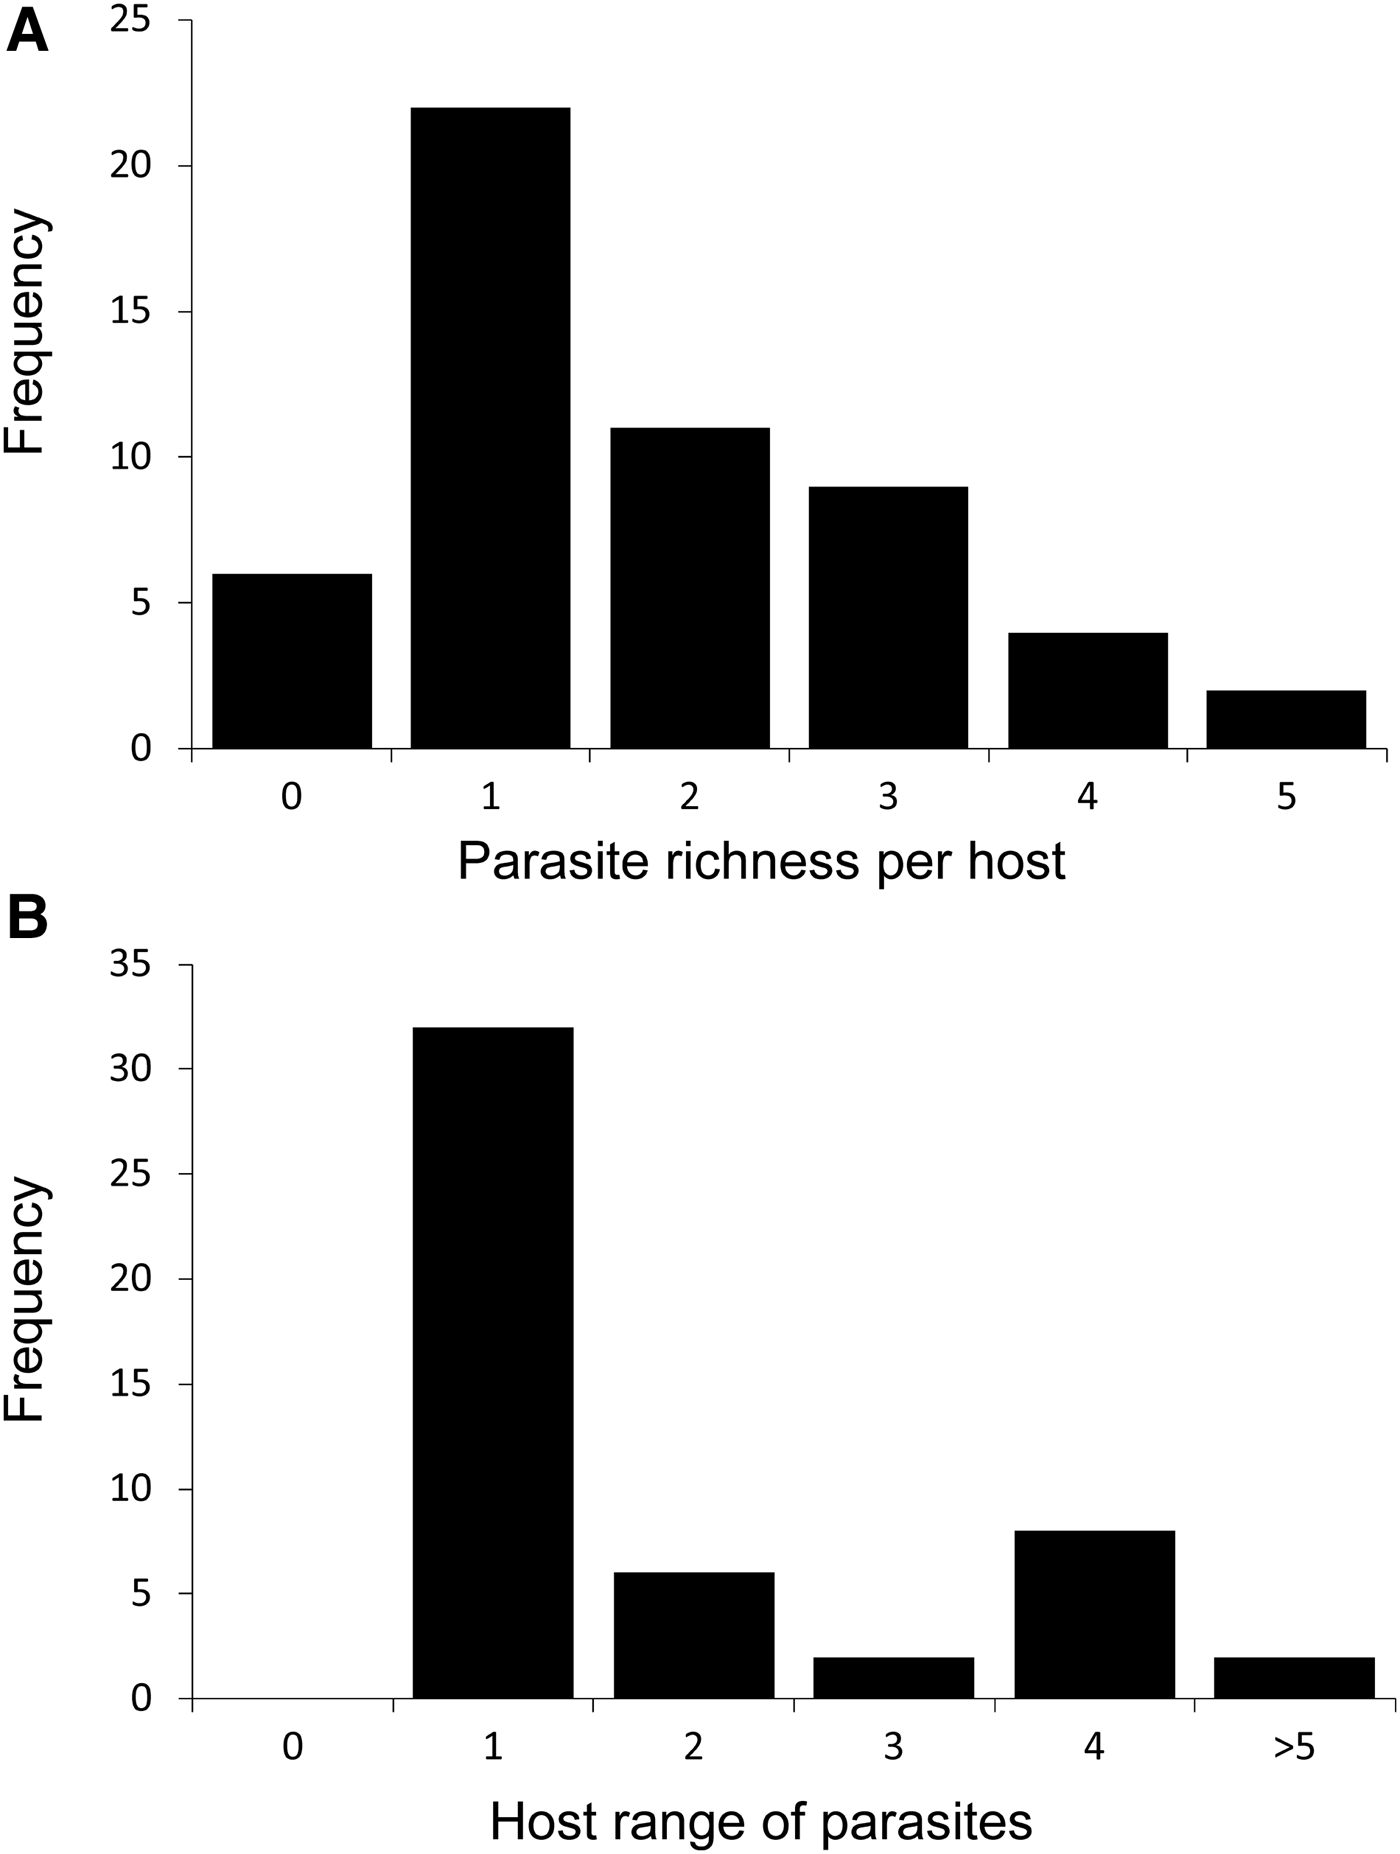
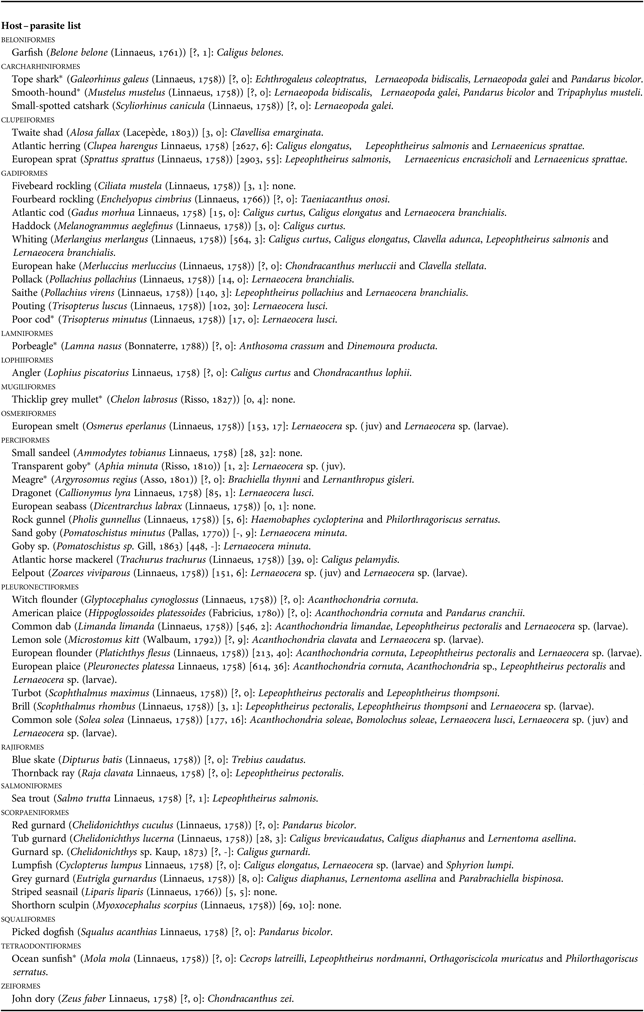
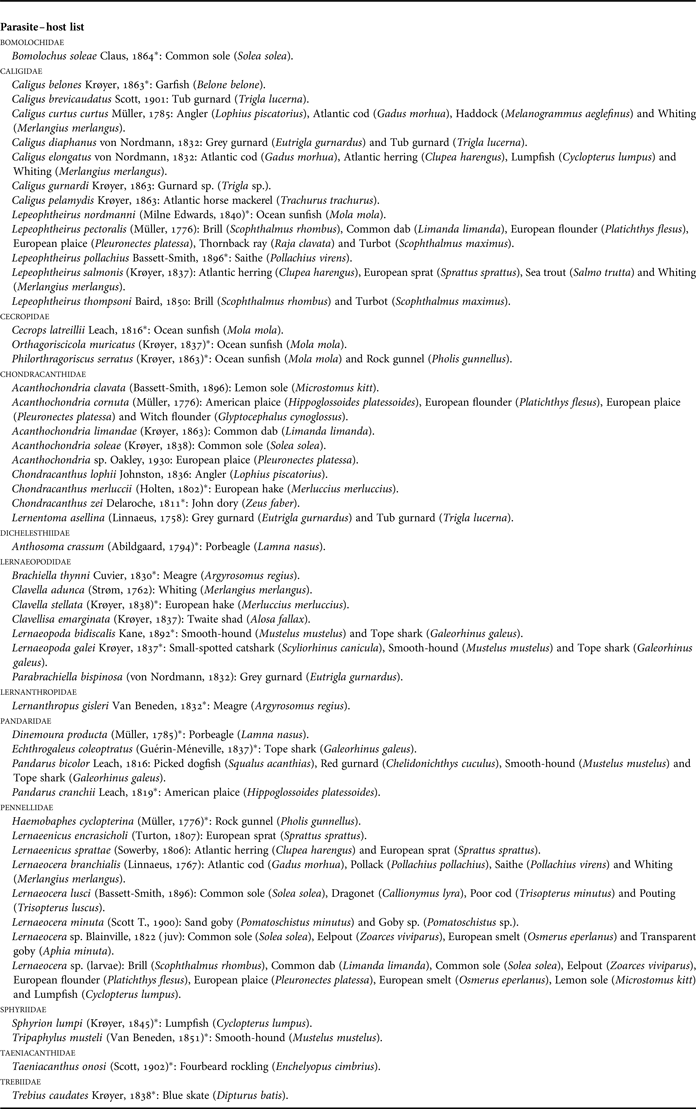
In total, 52 fish species from the waters around Texel belonging to 16 orders were inspected for parasitic copepods (see Table 1). Most of the fish species were only infected by a single copepod species and six species were found not to be infected at all (Figure 1A). However, two host species were infected by up to five copepod species (Merlangius merlangus, Solea solea; Figure 1A). There was a significant positive correlation between the number of individual fish of a species examined (where these data were available) and the number of parasites species found to occur on them (both log-transformed, R 2 = 0.284, P = 0.002), indicating that higher sampling effort increases the number of parasite species found, and that the current sampling effort is not high enough to result in a complete list. In total, 47 parasite species were found in the waters of the western Dutch Wadden Sea (see Table 2). The dominant families were the Caligidae, Chondracanthidae, Lernaeopodidae and Pennellidae. Most parasite species occurred only on a single host species, but some parasite species were found on as many as six different host species (Figure 1B).
Frequency distribution of (A) the total number of parasite species found per fish species (parasite richness per host) and (B) the number of fish species that a parasite species was found to infect (host range of parasite) in the western Dutch Wadden Sea.

List of host species by order, and the parasites found on them in the western Wadden Sea. Numbers in square brackets indicate the host sample size in 1968 and 2010, respectively. Question marks in the 1968 data set occur where species were mentioned without quantitative information, referring to the NIOZ archive as the source. A dash is used where that particular host taxon was not included in that year. The distinction between the common goby and the sand goby was not made in 1968, so goby sp. is included to provide a combined 1968 sample size. Host names are in accordance with www.fishbase.org; parasite names follow Kabata (Reference Kabata2003). The eight host species not investigated in other studies from the North Sea region (Groenewold et al., Reference Groenewold, Berghahn and Zander1996; Palm et al., Reference Palm, Klimpel and Bucher1999; Schmidt et al., Reference Schmidt, Zander, Körting and Steinhagen2003; Boxshall, Reference Boxshall2009) are indicated with an asterisk. Name changes compared to the 1968 study due to taxonomic changes are as follows (1968 name = updated name): Acanthochondria depressa = Acanthochondria cornuta; Acanthochondria florae = Acanthochondria cornuta; Bomolochus onosi = Taeniacanthus onosi; Brachiella ovalis = Parabrachiella bispinosa; Caligus rapax = Caligus elongates; Medesicaste triglarum = Lernentoma asellina.
List of ectoparasitic copepods by family, and the hosts they have been found on in the western Wadden Sea. Data based on Table 1. The 23 copepod species found in our study area but not mentioned in previous publications from the North Sea region (Groenewold et al., Reference Groenewold, Berghahn and Zander1996; Palm et al., Reference Palm, Klimpel and Bucher1999; Schmidt et al., Reference Schmidt, Zander, Körting and Steinhagen2003; Boxshall, Reference Boxshall2009) are indicated with an asterisk.
Temporal changes in infection patterns and host size and abundance
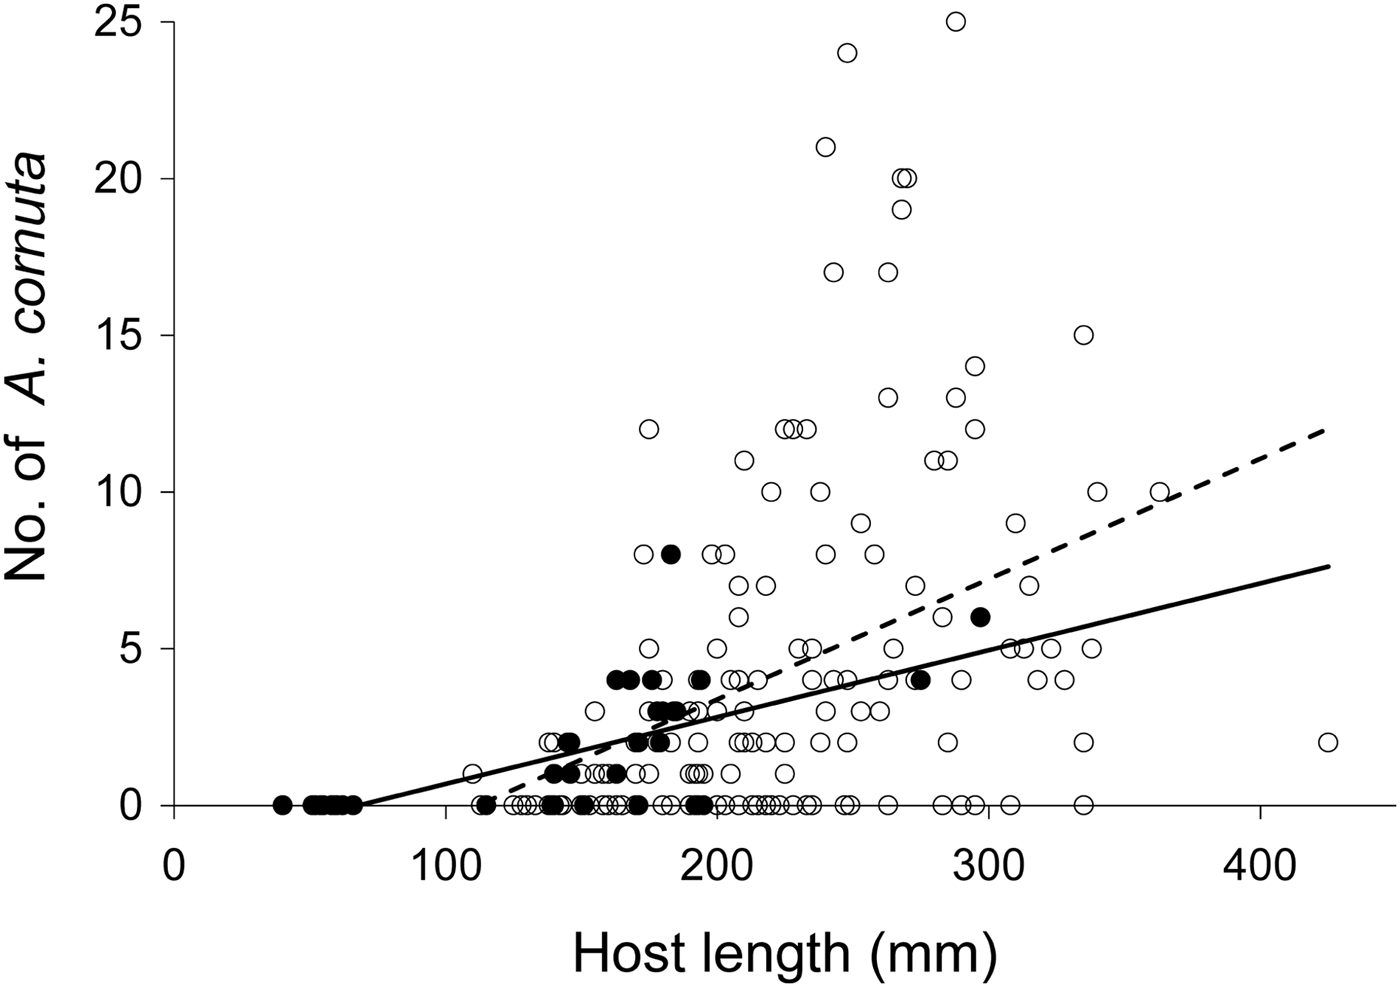
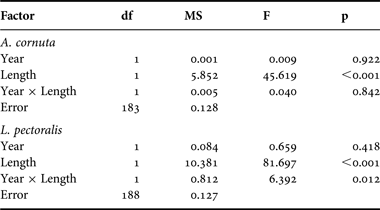
The two copepod species Acanthochondria cornuta and Lepeophtheirus pectoralis infecting the European flounder (Platichthys flesus) showed different infection patterns between the two sampling periods. In 1968, 101 European flounders out of 147 (69%) were infected with A. cornuta. Infected flounders had a mean size of 235 mm (±SD 55.9) and were host to an average of 6.3 (±5.5) A. cornuta. Fish sampled in 2010 were smaller, containing proportionally fewer A. cornuta: 18 out of 40 (45%) European flounders were infected and infected individuals had an average size of 182 mm (±41.2) and hosted an average of 3.2 ±1.8 A. cornuta. While a χ2 test indicated a significant difference in prevalence between the two periods (P = 0.006), the ANCOVA did not show a difference in intensity between the years (Table 3). Only host size had a significant effect on A. cornuta infection levels and the non-significance of the interaction term indicated a similar slope of the size–infection level relationship in both periods (Figure 2; Table 3). Density of infected fish and density of copepods increased from 1968 to 2010 (0.3–1.5 and 1.9–4.9 per day, respectively).
Number of Acanthochondria cornuta on Platichthys flesus versus host fork length (mm) in the western Dutch Wadden Sea. Open dots and dashed trend line represent 1968 data, filled dots and solid trend line represent data from 2010.
ANCOVA results, testing for the effect of year (main effect) and host size (covariate) on copepod infection levels (log-transformed). The interaction term was added to test for differences in the slope of the size–infection level relationship between the two periods.
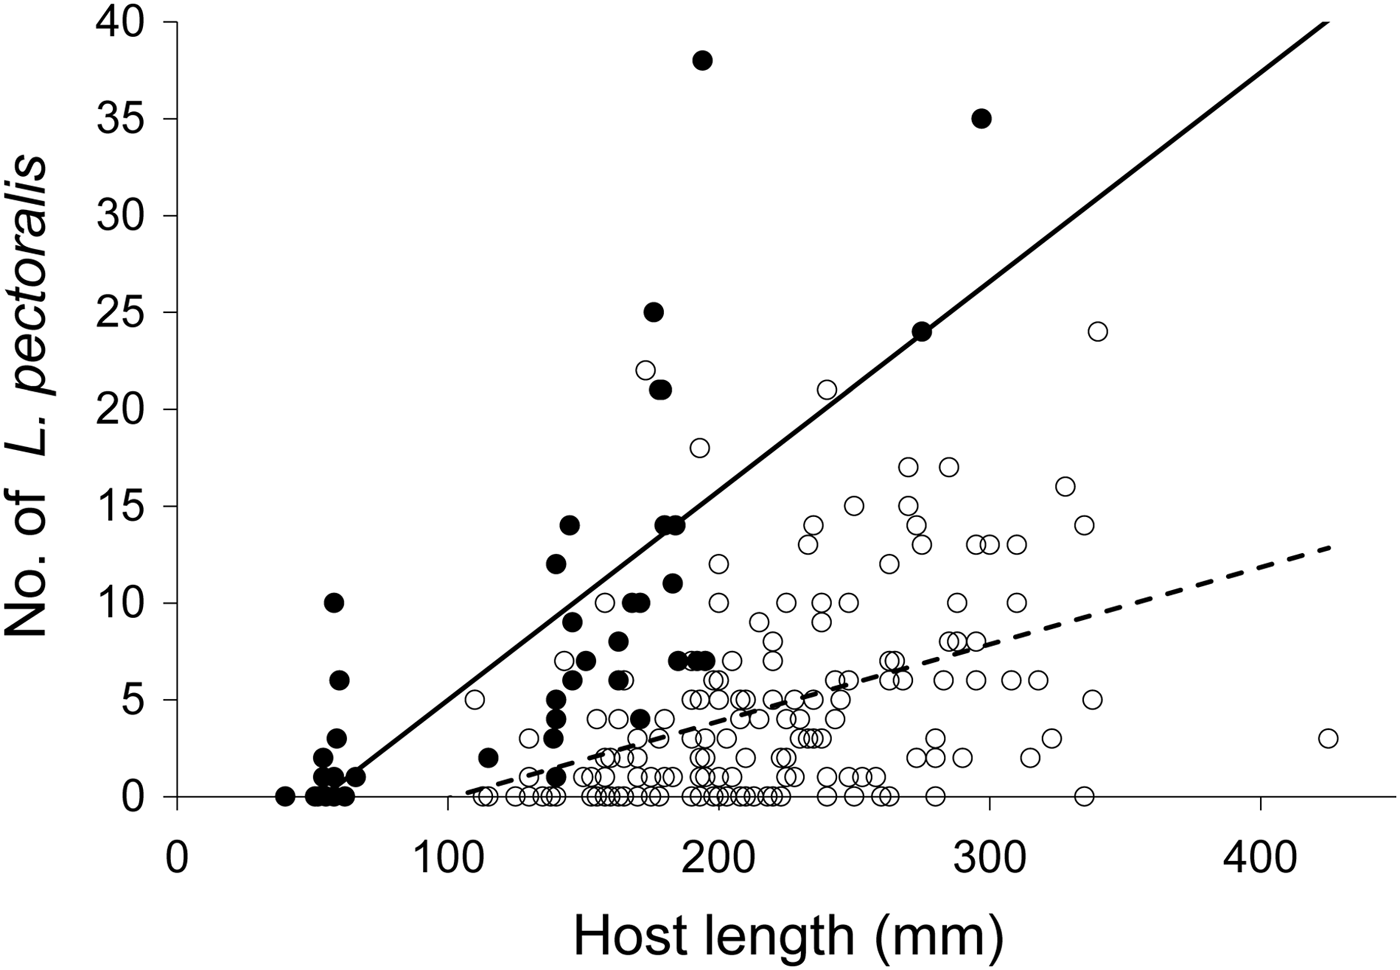
In contrast, L. pectoralis showed a more marked change in infection patterns from 1968 to 2010. In 1968, 115 European flounders out of 152 (76%) were infected with L. pectoralis. Infected flounders measured on average 230 mm (±55.0), and were host to an average of 6.2 (±5.1) L. pectoralis. In 2010, mean host size was only 149 mm (±58.2) on average, but still 34 out of 40 (85%) flounders were infected with L. pectoralis, and at a higher per-host abundance (10.3 ±9.3). While a χ2 test indicated no significant difference in prevalence between the two periods (P = 0.207), the ANCOVA revealed a significant effect of host size (Table 3). More importantly, the significance of the interaction term (size × year) indicated a difference in slope of the size–infection level relationship between the periods (Figure 3; Table 3). In 2010, L. pectoralis infected smaller hosts, and with higher infection intensity at a given host size than in 1968 (Figure 3). Density of infected fish and density of copepods increased more markedly compared to A. cornuta from 1968 to 2010 (0.3–2.9 and 2.1–30.6 per mean daily catches, respectively).
Number of Lepeophtheirus pectoralis on Platichthys flesus versus host fork length (mm) in the western Dutch Wadden Sea. Open dots and dashed trend line represent 1968 data, filled dots and solid trend line represent data from 2010.
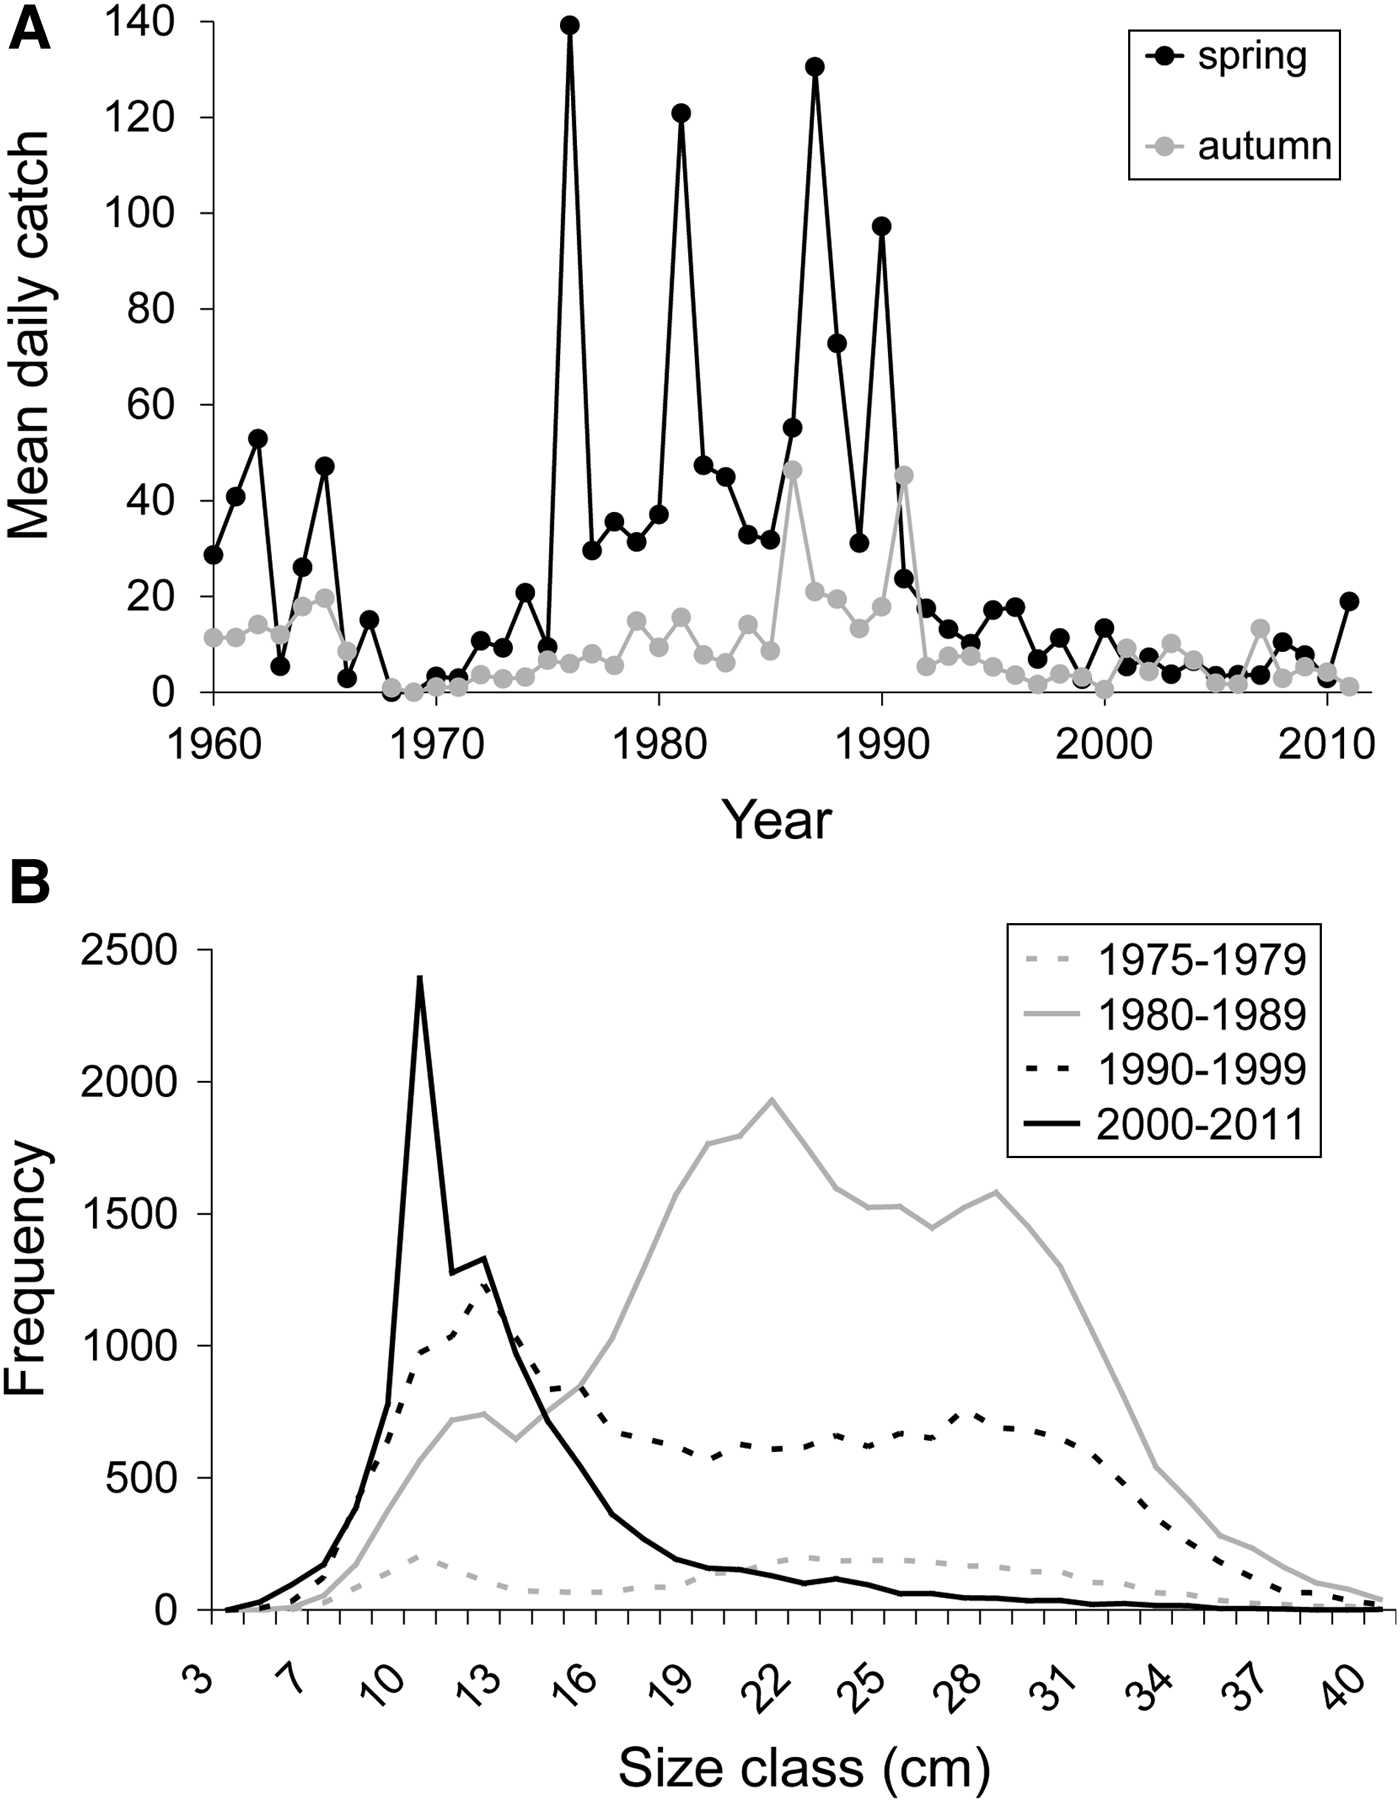
The data from the fyke showed clear changes in flounder abundance with highest daily catches between the late 1970s and early 1990s (up to 140 ind. d−1) and low daily catches (below 20 ind. d−1) since then (Figure 4A). In addition, catches in the 1960s were, on average, higher than in recent times (Figure 4A). The size–frequency distribution patterns of flounders in the four periods reflected the high flounder abundances in the 1980s (Figure 4B). More importantly, while in the 1970s and 1980s large size-classes were still present, the larger size-classes strongly decreased in frequency from the 1990s onwards. In recent times, the catches were strongly dominated by small-sized individuals (Figure 4B).
Long-term trends of European flounders (Platichthys flesus) in (A) abundance (mean daily catch; ind. d −1) in spring (April–June) and autumn (September–October) between 1960 and 2011; and (B) size–frequency distributions (2 cm steps) in four periods between 1975 and 2011 (1975–1979, 1980–1989, 1990–1999, 2000–2011). Data based on the NIOZ fyke net long-term time-series (for details see text).
DISCUSSION
This first inventory of parasitic copepods of fish in the western Wadden Sea to date revealed a rich parasite fauna, with 47 copepod parasite species found on 52 examined fish species. The observations in this study expand our knowledge from previous surveys in the North Sea region (Groenewold et al., Reference Groenewold, Berghahn and Zander1996; Palm et al., Reference Palm, Klimpel and Bucher1999; Schmidt et al., Reference Schmidt, Zander, Körting and Steinhagen2003; Boxshall, Reference Boxshall2009). In these reports, another 37 fish species were investigated that were not examined in our study, including the orders Syngnathiformes (five species, all without copepods) and Perciformes (15 species, only a few with copepods). These studies furthermore report 19 copepod species not found in this survey, including Ergasilidae and Eudactylinidae (with three species reported from each of these families). About half (23 out of 47, see Table 2) of the copepod species found in our study were not present in previous reports from the North Sea region, including all findings of Cecropidae (three species) and Sphyriidae (two species). Of these 23 additional copepod species, 13 were found on one of the eight host species not examined in the earlier reports (see Table 1), although none of these host species are particular to the Wadden Sea. Hence, while there is considerable overlap with other studies from the North Sea region, about half of the copepod species found in our study area are new findings that can probably be ascribed to both the inclusion of other host species, and the specific parasite fauna in the western Dutch Wadden Sea. Overall, the number of copepod species found is similar to the ones found in surveys from other regions (e.g. Mexican coastal fish: Causey, Reference Causey1960). Large studies, sampling a larger array of fish species and individual hosts, have however, found higher numbers of parasite species especially when a large percentage of examined hosts are nektonic and pelagic species, migratory and gregarious (e.g. Raibaut & Combes, Reference Raibaut and Combes1998). The observation that the sum of parasites found in a region greatly exceeds what is found in any single survey (Causey, Reference Causey1960) further demonstrates that even the most extensive study is likely to find only a subset of parasite fauna present, as is likely to be the case here. In addition, the number of copepod species found is linked to the sampling effort per fish species. This suggests that our copepod inventory of the western Wadden Sea is not complete and that the number of host–parasite observations will increase when more host individuals and species are investigated.
The two parasite species infecting European flounders (Platichthys flesus) examined in more detail here, Acanthochondria cornuta and Lepeophtheirus pectoralis, exhibited different changes in infection patterns between 1968 and 2010. Whereas A. cornuta seems to show the same host size–parasite intensity relationship in both periods, L. pectoralis has shifted towards the infection of smaller hosts and higher infection levels at a given host size. The different patterns between the two copepod species probably result from both the properties of the parasites themselves and a shift in population structure of their host species. Acanthochondria cornuta is a parasite of the gill cavity, attaching to the gill arches, whereas L. pectoralis attaches to the skin of its host, where it is relatively mobile but usually found in close proximity to the fins (Kabata, Reference Kabata2003). With these specific life histories, the two copepods probably face different constraints in regard to general changes in the population structure of their hosts. The long-term data from the NIOZ fyke net showed a clear decrease of abundance and a shift toward smaller size-classes of flounders during the last decades (Van der Veer et al., Reference van der Veer, Koot, Aarts, Dekker, Diderich, Freitas and Witte2011). This trend is in line with the general observation in many commercially harvested fish species which have become less abundant and tend to stay smaller as an adaptive response to the largest specimens being selectively fished out of the population (Rijnsdorp et al., Reference Rijnsdorp, van Leeuwen, Daan and Heessen1996; Law, Reference Law2000; Daan et al., Reference Daan, Gislason, Pope and Rice2005; Jørgensen et al., Reference Jørgensen, Enberg, Dunlop, Arlinghaus, Boukal, Brander, Ernande, Gærdmark, Johnston, Matsumura, Pardoe, Raab, Silva, Vainikka, Dieckmann, Heino and Rijnsdorp2007; Tulp et al., Reference Tulp, Bolle and Rijnsdorp2008). Both parasite species are thus confronted with a declining host density, and the available hosts are on average smaller than in 1968. As gill cavities are a much confined space, containing a fixed number of gill arches, A. cornuta may not be able to infect individuals at higher per-host abundance, nor infect individuals below a certain size, preventing it from compensating for the overall decline of host numbers. Indeed, intra-specific competition has been suggested for this species (Cavaleiro & Santos, Reference Cavaleiro and Santos2011), in particular because A. cornuta is a large species (body length 5–9 mm: Kabata (Reference Kabata2003)) and only infects a limited area of the gills (Kabata, Reference Kabata1959; Cavaleiro & Santos, Reference Cavaleiro and Santos2011). In contrast, L. pectoralis does not face such intrinsic limitations and can potentially compensate for dwindling host abundance and smaller host size by simply infecting smaller fish as well as by increasing its per-fish abundance. Hence, the observed changes in infection patterns probably reflect general environmental changes in the form of size-selective fishing pressure and dwindling fish stocks. Interestingly, the overall population size of copepods does not seem to suffer from a reduced number and size of fish hosts, because in both species the overall density of infected fish and copepods increased from 1968 to 2010. However, our measures of fish abundance may be too coarse to make strong inferences. Besides affecting infection levels of parasites, changes in fish size and abundance may also affect parasite life history traits (Poulin, Reference Poulin1996). For example, with a decreased abundance and size of hosts, selection might favour female copepods that mature at smaller body sizes, and that produce more and smaller eggs, but, due to a lack of data for our species, this remains to be investigated.
The changes in infection patterns observed in the two copepod species are striking and consistent with general fish stock changes in the study area, but we acknowledge that our study was restricted to only two points in time and thus limited in temporal scope. In general, to monitor and identify trends in infection levels, a continuous data series would be preferable. However, such time series on parasite infection patterns are very rare and logistically challenging (Wood et al., Reference Wood, Lafferty and Micheli2010). Our snapshot approach is valuable nonetheless, in particular because it links patterns in parasite infection levels with changes in host abundance and size. There are various other environmental parameters, such as temperature, pollutants, hunting- and fishing regulations, invasive species and recreational activity, that are known to have changed during the last decades in the study area (Lotze et al., Reference Lotze, Reise, Worm, van Beusekom, Busch, Ehlers, Heinrich, Hoffmann, Holm, Jensen, Knottnerus, Langhanki, Prummel, Vollmer and Wolff2005, Reise & Van Beusekom, Reference Reise and van Beusekom2008). Some of those changes might offer alternative explanations for the observed patterns in the two copepod species, and we cannot rule out that some of these other variables might drive the temporal patterns we detected. In general, a combination of parasite-time series with time-series on environmental factors will be helpful to link observed patterns with underlying process. Combined with experimental studies on the effects of environmental changes on parasite infection parameters such correlative field studies on parasite infection patterns may become helpful tools to trace broad-scale environmental changes in the future (Vidal-Martinez et al., Reference Vidal-Martinez, Pech, Sures, Purucker and Poulin2010; Wood et al., Reference Wood, Lafferty and Micheli2010).
ACKNOWLEDGEMENTS
Thanks are due to all those who assisted over the years in setting up, maintaining and emptying the komfyke, especially to the late Henk Beumkes, Willem Jongejan, Ewout Adriaans and Sieme Gieles. We also thank the referees for their comments on the manuscript.