1 Introduction
Missing data are ubiquitous, and missing data imputation remains an important preprocessing step in any data analysis. A large number of multiple imputation models have been developed over the years. Popular examples of univariate multiple imputation methods include parametric regression imputation (Rubin Reference Rubin1987) as well as nonparametric approaches such as predictive mean matching imputation (Little Reference Little1988), hot-deck imputation (Andridge and Little Reference Andridge and Little2010; Cranmer and Gill Reference Cranmer and Gill2013) and random forest imputation (Doove, Van Buuren, and Dusseldorp Reference Doove, Van Buuren and Dusseldorp2014; Stekhoven and Bühlmann Reference Stekhoven and Bühlmann2012). Multivariate multiple imputation approaches include multivariate normal imputation (King et al. Reference King, Honaker, Joseph and Scheve2001; Schafer Reference Schafer1997) as well as imputation using a sequence of chained univariate imputation methods (Van Buuren Reference Van Buuren2007; Van Buuren et al. Reference Van Buuren, Brand, Groothuis-Oudshoorn and Rubin2006).Footnote 1
For users imputing a dataset, choosing among available imputation models is often difficult. As imputation is different from optimal point prediction (e.g., Rubin Reference Rubin1996), standard model choice approaches such as cross-validation have limited use. In this letter, we point to a simple criterion to choose among imputation approaches: choose the imputation model that produces imputed values that are more consistent with the assumed missing data mechanism. Specifically, for observations that only differ in that some values of one variable y are missing, choose the imputation model that produces a conditional density of imputed values that is most similar to the conditional density of the observed values. To render this criterion operational, we suggest computing weights such that the densities of covariates X for observations with and without missing values on y are identical, and then utilizing discrepancy statistics to determine the differences between the density of imputed values and the adjusted density of observed values.
The concept of comparing the unadjusted density of observed and imputed values is an established recommendation for identifying problems with imputation models (e.g., Abayomi, Gelman, and Levy Reference Abayomi, Gelman and Levy2008; Van Buuren Reference Van Buuren2018). However, an unadjusted comparison often has limited use as it is expected that there will be differences in the densities if the missing data indicator is correlated with other covariates in the data, that is, if the data are not missing completely at random in the terminology of Little and Rubin (Reference Little and Rubin2019). We therefore suggest weighting the data before making the comparison.
Our approach is complementary to a recently proposed, graphical approach in the medical research literature which has not been used in social science research.Footnote 2 Specifically, Bondarenko and Raghunathan (Reference Bondarenko and Raghunathan2016) propose plotting the imputed and observed values against the (estimated) probability that a value is missing and preferring imputations that display fewer differences in the density of observed and imputed values across various levels of the missingness probability.
Given the limited popularity of this approach, we developed a general, simple—and, arguably, more intuitive—weighting method that allows users to choose an imputation model that suits their dataset best. More generally, we hope that the suggested approach facilitates the application of multiple imputation in applied research. In the following, we detail the assumptions needed, show how to estimate the weights, and illustrate the application using simulated and real-world data. The R package missDiag (available on CRAN) accompanies this letter and implements the suggested approach.
2 Adjusted Comparison of Imputed and Observed Values
Consider a variable Y for which some values are missing and some values are observed. A missing data indicator, M, encodes
 $M_{i}=0$
if a value
 $y_{i}$
is observed or
 $M_{i}=1$
if it is missing. Let X be the set of all other covariates. We assume that the observations are independent and identically distributed (i.i.d.) and that the data are missing at random (MAR) (Mealli and Rubin Reference Mealli and Rubin2015; Rubin Reference Rubin1976), that is,
 $f(M_{i}|x_{i},y_{i}) = f(M_{i}|x_{i}) \forall i=1,\ldots , N$
. Most imputation models, including those mentioned in the introduction, rely on both these assumptions.
When the data are i.i.d. and MAR, the conditional density of the missing values,
 $f(Y|X=x, M=0)$
, is equal to the conditional density of the observed values,
 $f(Y|X=x,M=1)$
(e.g., Little and Rubin Reference Little and Rubin2019, 18). In other words, holding X constant, the density of missing and observed values is equal under the MAR assumption. This notion suggests an assessment of whether the empirical densities of the imputed values and observed values differ after adjusting for differences in X. Imputation models for which imputed values are more similar to the observed values after adjustment are more consistent with MAR and may be preferred over imputation models that lead to imputed values with larger deviations.
To adjust for the covariates X, we propose computing a weight such that the moments of the covariate densities for observations with and without missing values in Y match. Different weighting schemes have been proposed in the literature to compute such weights. For example, Hainmueller’s entropy balancing weighting scheme computes such weights by minimizing the Kullback entropy divergence (Hainmueller Reference Hainmueller2012) and Zubizarreta’s weighting scheme minimizes the variance among the weights (Zubizarreta Reference Zubizarreta2015). We prefer the latter as it, naturally, leads to fewer instances of extreme weights but note that entropy-balancing computations tend to be faster in practice.
Zubizarreta’s weighting scheme, a convex quadratic programming problem that can be solved with standard optimization solvers, takes the following form:
 $$\begin{align*}\underset{w}{\mathrm{minimize}} \quad & \| w-\overline{w} \|_{2}^{2} \\\mbox{subject to } \quad & | w^{\prime}x_{M=0,p} - \overline{x}_{M=1,p} | \leq \delta_{p}, \quad p=1,\ldots, P, \\& \mathbb{1}^{\prime} w = 1, \\& w \geq 0,\end{align*} $$
where w is the vector of weights to be computed,
 $\overline {w}$
is the average weight,
 $\| \cdot \|_{2}$
is the Euclidean norm (the square root of the sum of squares),
 $x_{M=0,p}$
is the covariate vector p of observations without a missing value on y, and
 $\overline {x}_{M=1,p}$
is the sample mean of covariate p among observations for which y is imputed. The tolerance parameter
 $\delta _{p}$
is typically set to a small value if not exactly 0. This weighting scheme balances the first moment of the covariate densities (the means). To balance higher-order moments one may include the appropriate terms. For example, to balance the second moment of
 $x_{p}$
(the variances) one includes
 $x_{p}^{2}$
.
To identify the difference between the (weighted) density of observed and imputed values, we suggest adopting statistics that are widely used to assess the balance between the treatment and control groups in causal inference (e.g., Franklin et al. Reference Franklin, Rassen, Ackermann, Bartels and Schneeweiss2014). The two most important statistics are the standardized mean difference (SMD) and the log variance ratio, log(VR). While the SMD measures the difference in the densities’ locations (the difference in means standardized by the square of the average variance), the VR measures the difference in the densities’ dispersion. Imputation models for which the mean and variance of the imputed values of a continuous variable are similar to the observed values may be preferred over imputation models that do poorly on both the mean and the variance. For binary variables it is sufficient to compare the means.
The Kolmogorov–Smirnov (KS) statistic and the overlap (OVL) coefficient are alternative statistics that do not measure moment-specific differences, but are sensitive to differences across all the moments of a density including differences due to outliers. The KS statistic measures the largest discrepancy between the cumulative distribution functions. It is best thought of as a measure of the largest dissimilarity between the imputed and observed values. Another statistic is the OVL coefficient. This statistic measures local similarities between two densities instead of local discrepancies. Specifically, it is defined as the proportion of the overlap between the two densities. Typically, the difference 1-OVL is reported such that smaller values suggest a higher similarity.
To properly reflect uncertainty about the imputed values in any analysis, a series of imputed datasets (typically five) are generated; each dataset is analyzed and the estimates are combined using Rubin’s rules (Rubin Reference Rubin1987). This procedure can also be applied to the discrepancy statistics introduced above. Users may average the discrepancy statistics across the multiple imputed datasets or, alternatively, compare the densities of the balance statistics graphically as illustrated below.
In practice, the covariates X might also include missing values. Adopting a multivariate version of MAR (cf. Little and Rubin Reference Little and Rubin2019, 14), one typically imputes missing values in X jointly with missing values in Y. Therefore one can compute a weight such that the moments of the filled-in covariate densities for observations with and without missing values in Y match.Footnote 3 One concern with this strategy is that the multivariate version of MAR implies that the joint density of missing values is equal to the joint density of observed values. Yet, applying the suggested approach amounts to comparing the (full) conditional densities of Y alone rather than the joint densities. A more comprehensive assessment therefore involves the comparison of the conditional densities of Y and all covariates X one at a time. That said, it would be desirable for future research to develop an approach that compares the joint densities directly.
3 Illustration with Simulated Data
In this section, we use simulated data to demonstrate how the above approach can be used to assess which imputation model produces better imputed data (i.e., generates a density of imputed values more similar to the [reweighted] density of observed values) and that pooled regression estimates from models fitted on better imputed data are also less biased.
We simulate 1,000 datasets (with
 $N=1,000$
) from a linear model of the form
 $y = x \cdot z + e$
with fixed parameters. Covariate z is drawn from a Bernoulli distribution with mean 0.5 and continuous covariate x from a uniform distribution with a range of
 $-5$
to 5. We set the variance of the normal error distribution to 1 and let the proportion of missing values in y vary with z. The two proportions are drawn independently from a uniform distribution in the range of 0.1–0.5. The larger value determines the proportion of missing values if
 $z=1$
, whereas the smaller value determines the proportion of missing values if
 $z=0$
. The simulated missing data mechanism is consistent with the i.i.d. and MAR assumptions.
Iterating over all the simulated datasets, we impute the missing values five times using four popular imputation approaches: predictive mean matching imputation, hot-deck imputation, normal model imputation and random forest imputation. We rely on the Amelia package (Honaker, King, and Blackwell Reference Honaker, King and Blackwell2011) for the normal model imputation and on the MICE package for the other three approaches (Van Buuren and Groothuis-Oudshoorn Reference Van Buuren and Groothuis-Oudshoorn2011). Predictive mean matching amounts to measuring the distance between all observed values and a missing value using their predicted values from a linear, additive regression model. The five observations with the smallest distance are used to construct a donor candidate pool from which one observation is drawn at random to impute the missing value.
Hot-deck imputation is similar to predictive mean matching imputation but it compares observations’ covariate profile using a (multivariate) distance function such as the Mahalanobis distance. A random draw from the candidate pool of five observations is used to impute the missing value. Normal model imputation uses the predicted values from a linear, additive regression model to impute the missing values.
Random forest imputation is typically encountered as a single imputation method (e.g., Stekhoven and Bühlmann Reference Stekhoven and Bühlmann2012), but an implementation for the multiple imputation context is also available (Doove, Van Buuren, and Dusseldorp Reference Doove, Van Buuren and Dusseldorp2014). Random forest is an ensemble machine learning method based on decision trees. Different from the normal model imputation, it does not rely on a linear, additive model and thus has the potential to accommodate more flexible dependencies between variables.
We apply the diagnostics as described above and estimate the coefficients of a linear regression model that includes an interaction term. Consistent with the multiple imputation approach, we estimate these linear regression models on each imputed dataset and average the resulting coefficient estimates.
In Figure 1 (Panel A), each box plot describes a distribution of a discrepancy statistic averaged across the five imputed datasets. Given the nonlinear data-generating process, we would expect the imputation approaches without linearity assumptions (hot-deck imputation and random forest imputation) to perform better. This is indeed what we find: the discrepancy statistics from these two imputation approaches are, on average, closer to zero, suggesting that hot-deck imputation and random forest imputation produce better imputed data for the simulated data-generating process.
Summary of the 1,000 Monte Carlo simulations. Panel A: Box plots of the four discrepancy statistics comparing the weighted density of observed and imputed values. Panel B: Box plots of the bias in the (pooled) coefficient estimates of a linear model
 $y = x \cdot z + \epsilon $
. Each dataset was imputed five times using hot-deck imputation (Hotdeck), random forest imputation (RForest), predictive mean matching imputation (PMM), and normal model imputation (Norm). Some box plots are clipped to increase readability.

The differences between hot-deck imputation and random forest imputation are less pronounced. While the SMD from hot-deck imputation are closer to zero on average, we see fewer differences for the other three discrepancy statistics. However, the discrepancy statistics jointly suggest that hot-deck imputation produces better imputed data for the simulated data-generating process.Footnote 4
Figure 1 (Panel B) shows the distribution of the bias (truth minus estimate) in the (pooled) coefficient estimates for the four linear regression terms across the simulations. As expected, the coefficient estimates based on the better imputed data are, on average, less biased. When the data are imputed by hot-deck, there is, on average, no bias left in either the main effects or the interaction effect. When the data are imputed by random forest, there is no bias left for the main effects on average, but some bias remains in the interaction effect. For the normal model imputation and predictive mean matching imputation, the bias remains substantial in both the main effects and the interaction effect.
4 Imputing Real-World Survey Data
To illustrate the application of the suggested approach beyond simulated data, we use survey data from the 2008 edition of the American National Election Studies (
 $N=2,265$
). The dataset prepared by Kropko et al. (Reference Kropko, Goodrich, Gelman and Hill2014) includes 11 variables on different scales with various levels of missingness. Table 1 describes the variables and the number of missing values.
Summary of the 11 variables from the 2008 American National Election Studies.

We again impute the dataset using the four most popular imputation approaches for mixed-type datasets again: predictive mean matching imputation, hot-deck imputation, random forest imputation and multivariate normal model imputation. We rely on the Amelia package (Honaker, King, and Blackwell Reference Honaker, King and Blackwell2011) for multivariate normal imputation and on the MICE package for the other three approaches (Van Buuren and Groothuis-Oudshoorn Reference Van Buuren and Groothuis-Oudshoorn2011). To simplify the analysis, we consider “government support” as a continuous variable. We also log-transform the variable “response time” before imputation.
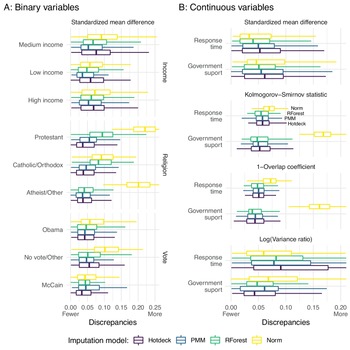
For each variable with at least 25 imputed values, we construct weights that balance all the other variables using the weighting scheme described previously. Figure 2 shows the density of the discrepancy statistics across the 100 imputed datasets. As the mean of a binary variable is a sufficient statistic, we only provide the SMD for all the binary variables.
Box plots of the discrepancy statistics comparing the weighted density of observed and imputed values across the 100 imputed datasets. Outliers are removed, and some upper whiskers are clipped to increase readability.

We observe the largest discrepancies in the SMD for the variable “religion.” The density of the SMD for multivariate normal imputation and random forest imputation are both bounded away from zero and the density of multivariate normal imputation is distinct from the other three. For multivariate normal imputation, we observe similar yet less pronounced differences for the variables “vote” and “government support.” For these two continuous variables, we observe a similar pattern for the OVL coefficient and KS statistic; multivariate normal imputation does much worse than the other three approaches. All four approaches are similar in terms of the variance ratio.
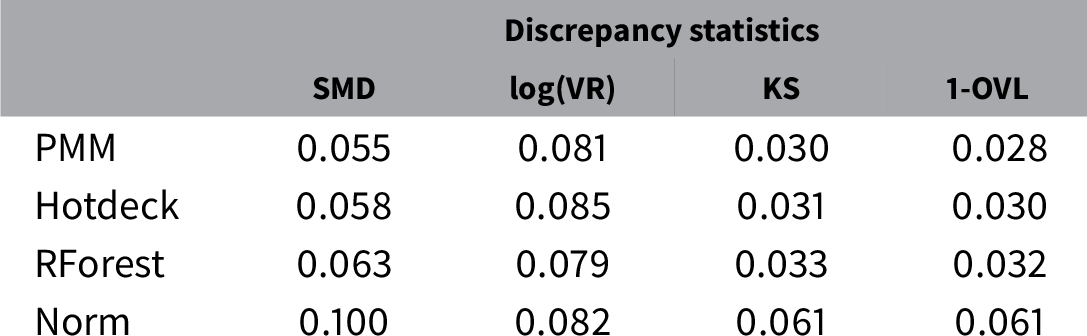
Table 2 shows that predictive mean matching imputation performs a little better in terms of the SMD than hot-deck imputation once we average across the imputed datasets and variables. Predictive mean matching imputation also outperforms the other three approaches when comparing the densities using the KS statistic and OVL coefficient. For the variance ratio, we observe that random forest imputation performs the best, followed by predictive mean matching. However, this is an artifact of the VR being defined only for the continuous variables (for which random forest does a little better). Based on these results, one may recommend using predictive mean matching imputation as it produces imputed values that are more consistent with the MAR assumption on average across all the variables. Alternatively, one may use the results to revise the imputation model. MICE relies on chained univariate imputation models, which means that it is easy to use different imputation approaches for different variables. Therefore, we could select predictive mean matching imputation for some variables and random forest imputation for others depending on their performance.
Average discrepancy statistics across variables and imputed datasets for predictive mean matching imputation (PMM), hot-deck imputation (Hotdeck), multivariate normal imputation (Norm) and random forest imputation (RForest). The four displayed discrepancy statistics include standardized mean difference (SMD), variance ratio (VR), Kolmogorov–Smirnov statistic statistic (KS) and overlap coefficient (OVL). The VR is only defined for the continuous variables.

The differential performance of the four imputation approaches cannot be explained by the differential performance of the constructed weights. In the Supplementary Figures A.1–A.6, we show that the constructed weights balance the first moment of the densities exactly (as expected). Some moderate imbalances are left for the higher moments of the continuous variables. In principle, these could be removed by adding, for example, squared and cubed functions of the variables to the weighting scheme. However, because these higher-moment imbalances are largely not different between the four imputation approaches, they cannot explain the differential performance.
One concern with the analysis might be that higher-order interactions are not explicitly balanced. For example, while the weights ensure that the proportions of Obama voters and of women among respondents with and without missing values on the variable religion are identical, they do not guarantee that the proportions of women voting for Obama are identical. To evaluate the sensitivity of the results to the inclusion of some higher-order interactions, we replicate the analysis to balance the interactions of the demographic variables (gender, age, and race) with all the other variables. The results, which appear in Supplementary Figure A.7, are largely identical to those in Figure 2.
Similar to the results in the previous section, we observe that the multivariate normal imputation model performs much worse relative to the other three approaches. However, and more importantly, the performance of the other three approaches differs. While predictive mean matching outperforms hot-deck imputation and random forest imputation with the American National Election Study data, it performs less well with the simulated data. This differential performance across datasets highlights the importance of comparing the performance of imputation approaches and choosing the one that performs the best on a particular dataset.
5 Conclusion
Incomplete data are a common challenge when analyzing real-world data. Another challenge is choosing from many available multiple imputation approaches to fill in the missing values. While some approaches are more popular than others, the literature offers little advice on how to choose among them for a given dataset. In the absence of such advice, list-wise deletion remains a popular default approach despite its known deficits. Further, even if multiple imputation is used in applied work, it is common practice to rely on the (currently) most popular approach in the literature (cf. Lall Reference Lall2016), which may or may not be optimal for a given dataset.
This letter provides a conceptually simple and practical approach to choosing between competing imputation models that impute data under MAR. The approach is flexible and does not have to be tailored to a particular imputation model; all it needs is the data with the missing values and the filled-in dataset. It builds on the same assumptions made by most multiple imputation models, in particular the MAR assumption. While more work is needed to understand how to choose between imputation models when the missingness mechanism is nonignorable and the data are missing not at random, we hope that this letter, in conjunction with the accompanying, easy-to-use software package missDiag for R, prompts users to make explicit comparisons between different imputation models for their dataset and to choose the one that imputes values most consistent with MAR.
We also hope that this contribution lowers the barriers faced by applied researchers trying to address missing data in their data analysis and therefore reduces the reliance on list-wise deletion, which always leads to inefficient estimates but typically also introduces bias. More generally, our approach highlights how weighting and imputation approaches, often seen as alternative strategies to handle missing data, can be combined in a productive manner. While we are not the first to combine both—for example, Seaman et al. (Reference Seaman, White, Copas and Li2012) combine multiple imputations with weighting to achieve double robustness—the combination of weighting and imputation appears to be a fruitful avenue for future research.
Acknowledgments
We would like to thank Achim Ahrens, the editor, and two anonymous reviewers for excellent comments.
Supplementary Material
For supplementary material accompanying this paper, please visit https://doi.org/10.1017/pan.2021.39.
Funding
This work was supported by the Swiss National Science Foundation [190557].
Data Availability Statement
The replication materials for this paper can be found at https://doi.org/10.7910/DVN/IIXGBM (Marbach Reference Marbach2021).