Introduction
Ammonoids, extinct, externally shelled (ectocochleate) cephalopods, have an extensive fossil record preserving their external coiled shells and complex interior shell walls (septa) (Daniel et al. Reference Daniel, Helmuth, Saunders and Ward1997; Kerr and Kelley Reference Kerr and Kelley2015; Lemanis et al. Reference Lemanis, Korn, Zachow, Rybacki and Hoffmann2016a; Peterman and Barton Reference Peterman and Barton2019). These septa created gas-filled chambers within the shell that were used to regulate buoyancy. While their distant, modern relatives, the nautilids, have simple, sinuous septa that create similar chambers, ammonoids evolved intricately folded septa unlike any modern cephalopod morphologies (Fig. 1). Although cuttlefish have corrugated structures within their internalized shells, they represent highly modified, tiny pillars supporting parallel septa (Checa et al. Reference Checa, Cartwright, Sanchez-Almazo, Andrade and Ruiz-Raya2015). Throughout their evolutionary history, ammonoids developed increasingly fractal complex septa (possessing scale-invariant geometry) before their extinction at the end of the Mesozoic (Boyajian and Lutz Reference Boyajian and Lutz1992; Landman et al. Reference Landman, Goolaerts, Jagt, Jagt-Yazykova, Machalski and Yacobucci2014, Reference Landman, Goolaerts, Jagt, Jagt-Yazykova, Machalski, Klug, Korn, Baets, Kruta and Mapes2015; Tajika et al. Reference Tajika, Nützel and Klug2018, Reference Tajika, Landman, Hoffmann, Lemanis, Morimoto, Ifrim and Klug2020; Peterman and Barton Reference Peterman and Barton2019). Because these complex morphologies do not exist in modern mollusk shells, the mystery of why ammonoids invested the biological resources to generate fractal geometries has plagued paleontologists for centuries (Buckland Reference Buckland1836). Previous investigators have suggested physiological relationships between septal complexity and respiration (Newell Reference Newell1949), gas production (Pia Reference Pia1923), liquid transport (Mutvei Reference Mutvei1967), muscle attachment (Ebel Reference Ebel1992), soft body attachment (Lewy Reference Lewy2003), and rapid growth (Klug et al. Reference Klug, Meyer, Richter and Korn2008). Others have hypothesized mechanical relationships between septal complexity and buoyancy (Teichert Reference Teichert, Teichert and Yochelson1967; Kulicki and Mutvei Reference Kulicki, Mutvei, Wiedmann and Killmann1988; Saunders Reference Saunders1995; Daniel et al. Reference Daniel, Helmuth, Saunders and Ward1997) or hydrostatic pressure (Buckland Reference Buckland1836; Hewitt and Westermann Reference Hewitt and Westermann1997; Hassan et al. Reference Hassan, Westermann, Hewitt and Dokainish2002). More recently, Lemanis and colleagues (Lemanis et al. Reference Lemanis, Zachow and Hoffmann2016b; Lemanis Reference Lemanis2020) used finite element analysis to study the effect of increasing septal complexity on shell strength. These studies demonstrated that increasing complexity did not create increased resistance to hydrostatic pressure from surrounding water (Lemanis et al. Reference Lemanis, Zachow and Hoffmann2016b; Lemanis Reference Lemanis2020); however, it did increase resistance to point loads like those imparted by shell-crushing predators (Lemanis et al. Reference Lemanis, Zachow and Hoffmann2016b; Lemanis Reference Lemanis2020). Others (Daniel et al. Reference Daniel, Helmuth, Saunders and Ward1997; Hassan et al. Reference Hassan, Westermann, Hewitt and Dokainish2002) have made similar suggestions that increased septal complexity had a defensive purpose (e.g., increased chamber refilling), although this has yet to be demonstrated by investigators using evidence from the fossil record (Kerr and Kelley Reference Kerr and Kelley2015). In contrast to functional interpretations of complex septa, some have postulated such shapes may have been generated by varying degrees of fabricational noise (for review, see Klug and Hoffmann Reference Klug, Hoffmann, Klug, Korn, Baets, Kruta and Mapes2015).
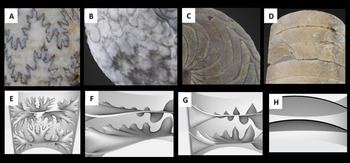
Fossil and model septa. Images showing cephalopod septa (inner chamber walls) and sutures (where septa meet the outer shell wall); complexity decreases from left to right. Top row: sutures visible on fossil cephalopods from the Paleontological Research Institution research collections: A, ammonite sutures on Cadoceras sublaeve (PRI 70580); B, ceratitic sutures on Gymnotoceras beachi (PRI 43629); C, goniatitic Imitoceras rotatorium (PRI 44566); D, nautiloid sutures on Actinoceras beloitense (PRI 70326). Bottom row: computer-generated models of cephalopod chambers, bisected to show cross section of septa. E, ammonitic septa of Diplomoceras; F, ceratitic septa of Otoceras; G, goniatitic septa of Schistoceras; H, nautiloid septa of Eifeloceras.

Both ammonoids and nautiloids are known to have fallen prey to shell-crushing predators including, fishes (hybodont sharks [Vullo Reference Vullo2011], ptychodontoid sharks [Romer Reference Romer1966], Heterodontidae [sharks], Batoidea [rays] [Vermeij Reference Vermeij1977], Pycnodontiformes, Semionotiformes, Macrosemiiformes, and Pholidophoriformes [Tintori Reference Tintori1998]), marine reptiles (placodonts [von Huene Reference von Huene1956], ichthyosaurs [Vermeij Reference Vermeij1977], mosasaurs [Kauffman and Kesling Reference Kauffman and Kesling1960]), and even other cephalopods (Mapes and Chaffin Reference Mapes, Chaffin, Kelley, Kowalewski, Michal and Thor2003; Vullo Reference Vullo2011; Kerr and Kelley Reference Kerr and Kelley2015; Takeda et al. Reference Takeda, Tanabe, Sasaki and Landman2016) (see also Richter Reference Richter2009; Keupp Reference Keupp2012). To further test the hypothesis that predation pressures from shell-crushing predators drove the evolution of increasingly complex septa, we created novel physical models of various septal shapes to analyze their strengths in compression.
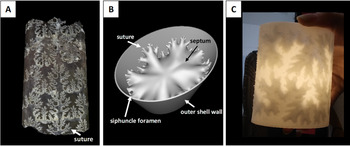
The processes of fossilization often render morphologies physically untestable (e.g., trapping remains in rocks, changing their composition, loss of organic components, diagenesis), presenting a major challenge to understanding the form and function of extinct organisms. Paleontologists have engineered many creative means to handle this problem, including physical and virtual experimentation on real and model specimens (e.g., Schulp Reference Schulp2005; Crofts and Summers Reference Crofts and Summers2014; Kolmann et al. Reference Kolmann, Crofts, Dean, Summers and Lovejoy2015; Lemanis and Zlotnikov Reference Lemanis and Zlotnikov2018; Johnson and Carter Reference Johnson and Carter2019; Peterman and Barton Reference Peterman and Barton2019). In this study, we used computer-aided design to create 3D printable ammonoid models, each of which isolated a single chamber bound by two septal walls (Figs. 1, 2). Here, we present empirical data investigating relationships between septal complexity and shell strength to test whether increasingly complex septa provided increased resistance to compression by shell-crushing predators.
Fossil, computer-generated, and 3D-printed ammonoids. Comparison of fossil and model ammonoids. A, Baculites sp. (PRI 70605). Fossil is infilled such that suture lines remain visible. B, 3D Baculites model with slightly laterally compressed shell generated in Blender 2.76. C, 3D-printed Diplomoceras model created in Blender, printed on Formlabs Form 2.

Materials and Methods
Experimental Design
To understand the effects of increasing septal complexity on shell strength, we tested septa from four morphological groups. The first three septal types: ammonitic, ceratitic, and goniatitic, are septal shapes found in ammonoid fossils (Fig. 1A–C,E–G). Ammonitic septa are the most complex within the ammonoids (exhibiting fractal scaling), and goniatitic septa are the least complex (Arkell et al. Reference Arkell, Furnish, Kummel, Miller, Moore, Schindewolf, Wright and Moore1957). The fourth septal morphology we tested represented nautiloid septa, which are simple and sinuous (these shapes are still seen in modern Nautilus) (Fig. 1D,H). We selected 12 genera representing these four septal types: Diplomoceras, Baculites, and Douvilleiceras (ammonitic); Otoceras, Pearylandites, and Xenaspis (ceratitic); Schistoceras, Manticoceras, and Diaboloceras (goniatitic); and Eifeloceras, Endoceras, and Orthoceras (nautiloid) (Table 1). We chose these genera due to their high disparity within each septal shape type. We quantified the complexity of these septa using the fractal box-counting method to generate scaling exponents (Peterman and Barton Reference Peterman and Barton2019; Table 1; see “Quantification of Sutural Complexity”).
Taxa used to make models. List of select septal types and representative genus and species whose sutures were used to create 3D models (Arkell et al. Reference Arkell, Furnish, Kummel, Miller, Moore, Schindewolf, Wright and Moore1957; Jones Reference Jones1963; Teichert et al. Reference Teichert, Moore and Nodine Zeller1964; Wright Reference Wright and Kaesler1996; Peterman and Barton Reference Peterman and Barton2019). Scaling exponents used to quantify complexity following Peterman and Barton (Reference Peterman and Barton2019).

Additionally, we created a hypothetical control model with completely straight septa. For consistency, we created all models using a laterally compressed cylindrical shell with no whorl overlap or shell taper (Fig. 2) to prevent these factors from contributing to stress distribution. Previous authors believed that whorl overlap contributes to shell strength in buttressing against compression by a predator; thus, we decided to isolate the influence of septal shape only (Hewitt and Westermann Reference Hewitt and Westermann1997). We 3D printed our shells using brittle materials to maintain consistent material properties and normalize for size and shell thickness to control biological complications such as differences in microstructure and the thickness of ammonoid and nautiloid septa (Saunders Reference Saunders1995).
Model Creation
Each of the 13 models consisted of a segment of a shell with a slightly laterally compressed whorl section (Fig. 2B). We constructed a single whorl section in the computer graphics software Blender 2.76 (Blender Online Community 2020) by creating a circle and scaling the transverse directions to yield a whorl height to whorl width ratio of 1.4. We extruded this whorl section in the longitudinal direction to create a thin mesh in 3D space. Next, we used the solidify modifier in Blender to extrude the model in the positive (outward) directions to define thickness. We held all thicknesses constant, because this property varies widely between different ectocochleates. We chose a thickness value of 1% whorl height based on baculitid septal measurements at 30 mm whorl height (Peterman et al. Reference Peterman, Ciampaglio, Shell and Yacobucci2019).
We scanned suture patterns of each specimen from their original sources (Arkell et al. Reference Arkell, Furnish, Kummel, Miller, Moore, Schindewolf, Wright and Moore1957; Jones Reference Jones1963; Teichert Reference Teichert, Teichert and Yochelson1967; Wright Reference Wright and Kaesler1996; Peterman and Barton Reference Peterman and Barton2019). We mirrored complete hemisutures with their internal (dorsal) elements to create complete suture patterns. We then imported these sutures into Blender to reduce them to a 1D corrugated line within 3D space. We wrapped this object around the whorl section using the curve modifier in Blender and scaled in the longitudinal directions to prevent aberration from the original shape. We joined this suture pattern in 3D at the edges to create a ring, which we then extruded inward to a single point at the center of the septum. Afterward, we refined this crude septum to add additional vertices to the mesh. We selected the entire mesh (excluding the suture line) and then iteratively smoothed it to approximate a minimum curvature surface. We extruded this curved, 2D surface to 1% of whorl height to yield a single 3D mesh of each septum. We chose to maintain uniform thickness and to isolate the influence of septal shape on shell strength without introducing variations in strength owing to localized shell thickening. We duplicated 3D septa and transformed them to create the final models with two septa spaced according to their real-world counterparts. We could not hold septal spacing constant, because this would create unrealistic gaps or self-intersections due to the variability in longitudinal extent between different sutures. We scaled the external shell longitudinally to accommodate the septa for each species and then unified it with the Boolean modifier to produce a single manifold mesh suitable for 3D printing.
We created siphuncular foramina by subtracting a cylinder (representing the siphuncle) from the septal models with the Boolean modifier in Blender. We spaced all ventral siphuncles (present in almost all ammonoids) to 1% of whorl height from the venter (0.75 mm). We chose to maintain a constant position of the siphuncle foramina to maintain an experimental system in which we only tested the influence of septal shape on shell strength. Relocating the siphuncle foramen (a hole) would result in changing the position of a stress concentrator. Because siphuncle size varies widely within each of the examined taxa, we set the siphuncle size at a constant 2.5 mm (3.33% of whorl height, as measured from the baculitid specimen in Peterman et al. Reference Peterman, Ciampaglio, Shell and Yacobucci2019).
3D Printing
We printed our models on a Formlabs Form 2 printer using Formlabs Rigid Resin at 50 μ resolution (Fig. 2C). We washed the models in a Form Wash with isopropanol for three successive intervals of 15 minutes each. In between washes, we drained excess isopropanol from the model chambers through the siphuncle foramen. Finally, we removed the models from the build platform using wire cutters and then cured them in Form Cure with UV light for 3 hours at 80°C.
Rigid resin does not behave in a brittle fashion if postprocessed following suggested Formlabs guidelines for curing. Therefore, we took extra steps to make sure our models had the appropriate material properties to model shell breakage accurately. We washed each model three times instead of once to ensure that as much excess resin was removed from the model's interior chambers as possible. Additionally, we tested several miniature models with the following curing times: 15 (Formlabs recommended), 30, 45, 60, 120, and 180 minutes. We found that the samples became brittle at 120 and 180 minutes of curing (see Supplementary Fig. S1). Thus, we used a 180 minute cure time in our final experiments to ensure brittle behavior.
Experiments
We conducted compression experiments using an Instron Universal Testing Machine with a 2 kN load cell. We used two flat plates to mimic a vertebrate predator's theoretical flat crushing teeth (Fig. 3). This methodology is similar to that of Kolmann et al. (Reference Kolmann, Crofts, Dean, Summers and Lovejoy2015); those authors used curved aluminum plates to simulate the jaws of a durophagous predator. Using flat plates is the most general way to test prey strength in bulk compression without introducing numerous assumptions about the placement of point loads from specific predator dentitions. Shell strength varies based upon loading location (Johnson Reference Johnson2021). As the current literature lacks physical testing that isolates septal morphologies and relative strength, the goal of this study was to develop a first-order approximation for these relationships in bulk compression.
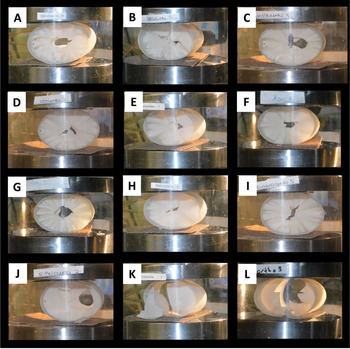
Models in compression. Sample images of models during compression tests in Instron Universal testing machine. Instron plates are lined with sandpaper. Top row: ammonitic models A, Diplomoceras; B, Baculites; C, Douvilleiceras. Second row: ceratitic models D, Otoceras; E, Pearylandites; F, Xenaspis. Third row: goniatitic models G, Schistoceras; H, Manticoceras; I, Diaboloceras. Bottom row: nautiloid models J, Eifeloceras; K, Endoceras; L, Orthoceras.

We lined the crushing plates with sandpaper to prevent the models from rolling and oriented the models so that both the shortest axis of the outer shell and the septa were perpendicular to the plates. This was a biologically realistic choice, because predators are generally most likely to crush prey over their smallest axis (Stein et al. Reference Stein, Goodman and Marschall1984). We then surrounded the experimental setup with a protective shield and lowered the top plate at 3 mm per minute, creating a quasistatic loading regime. A computer continuously recorded the force of the model pushing back on the top plate. We confirmed brittle behavior in the load-displacement curves, because the shell models demonstrated largely linear elastic behavior with only small regions of plasticity during initial loading and immediately before reaching peak load. Upon reaching peak load, shells shattered and came out of contact with the top plate, causing a drastic drop in load read by the machine. For each genus, we conducted five trials (except in the cases of Douvilleiceras, Otoceras, Diaboloceras, and Eifeloceras, where we had six trials because an extra print was available for each). We conducted statistics for peak load comparisons, including the Shapiro-Wilks normality test, Kruskal Wallis test, and Dunn post hoc tests, in R (R Core Team 2020).
Quantification of Sutural Complexity
We quantified the complexity of each suture pattern using the fractal box-counting method (see Peterman and Barton Reference Peterman and Barton2019; Supplementary Fig. S2). We used the software Benoit 1.3 to compute the scaling exponent of each hemisuture of the chosen specimens. This metric quantifies the degree to which a pattern fills space and scales as a function of size. Fractal box-counting involves superimposing a grid over a pattern and measuring the number of boxes occupied by that pattern at various scales (box sizes). As box size decreases, the number of occupied boxes increases. The rate at which these occupied boxes increase at smaller scales is equal to the scaling exponent (i.e., the slope of a power function fit through the sampled data points). We remediated directional bias by rotating the grid every 5° and counting the minimum number of occupied boxes at each step size. We excluded data points below 10 pixels, the approximate width of each digital hemisuture, from each analysis.
It should be noted that the fractal box-counting method is most appropriate for fractal objects or those approximating fractal scaling and self-similarity. The ceratitic, goniatitic, and nautiloid sutures do not exhibit self-similarity and are not true fractals. Nonetheless, their data points are well fit by power functions with low standard errors (Table 1). While such patterns cannot be interpreted as fractals sensu stricto, scaling exponents adequately approximate their complexity in terms of the relative amount of space filled by each hemisuture.
Statistical Analysis
We conducted all statistical analyses in R (2020). We first used the Shapiro-Wilks test (p < 0.05) to determine if our data had a normal distribution. It did not; we, therefore, used a Kruskal-Wallis test (p < 0.05) and post hoc Dunn test (p ≤ 0.025) in place of analysis of variance tests. We conducted five to six trials for each of the 13 model septal types.
Results
The 3D-printed models reflected an accurate first-order approximation for shell failure based upon their brittle behavior in compression, exhibiting dominantly linearly elastic behavior with only minor regions of plasticity upon initial loading and directly before failure (breakage) (Fig. 4B). This observation verified that the models’ peak loads were appropriate proxies for the relative strengths of different shell morphologies (Johnson Reference Johnson2020, Reference Johnson2021). Additionally, we used the shapes of the load-displacement curves to assess any differences in the mechanical behavior of various septal shapes upon loading.
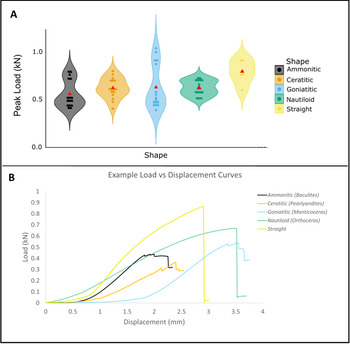
Septal shape and peak load sustained. A, Violin plot peak load (kN) sustained by models with different septal types decreasing in complexity from left to right: ammonitic, ceratitic, goniatitic, nautiloid, and straight (control). Width of spindles indicates distribution of data points. Means for each septal shape are represented by red triangles. Straight septa (representing controls) were stronger than ammonitic and goniatitic septa (p ≤ 0.025). There was no significant difference between models of real septal types (ammonitic, ceratitic, goniatitic, or nautiloid). B, Examples of load (kN) vs. displacement (mm) curves for each septal shape tested. Figure created in ggplot2 (Wickham Reference Wickham2016).

Peak Load
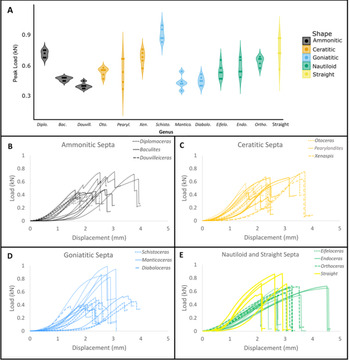
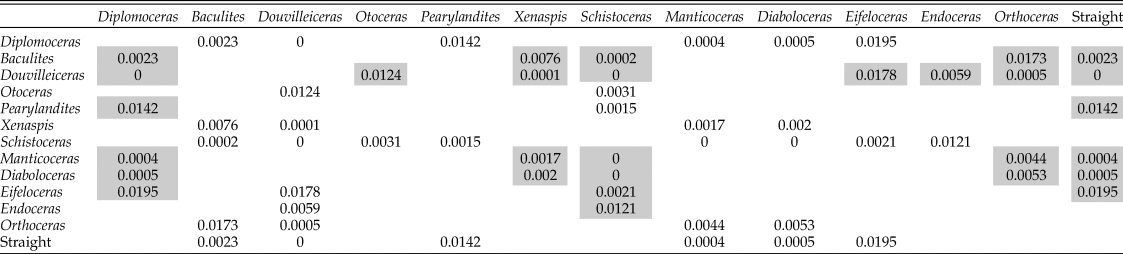
Comparisons of ammonitic, ceratitic, goniatitic, nautiloid, and straight septa yielded only two significant pairwise differences (Kruskal-Wallis p-value = 0.04567). These comparisons showed that straight septa models (representing controls) were significantly stronger than ammonitic septa (Dunn test p = 0.0019) and goniatitic septa (Dunn test p = 0.0070) (Fig. 4). The peak loads of models representing different genera also demonstrated significant differences summarized in Table 2 (Kruskal-Wallis p-value = 2.195e-07, significant Dunn test pairwise comparisons p ≤ 0.025) (Fig. 5A, Supplementary Fig. S3).
Peak loads of different septal morphologies. Peak loads sustained by models based on genera with different septal morphologies. A, Violin plot peak load (kN) sustained by models of different genera decreasing in septal complexity from left to right. Width of spindles indicated distribution of data points. Load (kN) versus displacement (mm) curves for B, ammonitic; C, ceratitic; D, goniatitic; E, nautiloid and straight septa. Diplo., Diplomoceras; Bac., Baculites; Douvill., Douvilleiceras; Oto., Otoceras; Pearyl., Pearylandites; Xen., Xenaspis; Schisto., Schistoceras; Mantico., Manticoceras; Diabolo., Diaboloceras; Eifelo., Eifeloceras; Endo., Endoceras; Ortho., Orthoceras.

Dunn test significant pairwise comparisons (p ≤ 0.025) of 3D-printed cephalopod models. Gray boxes show significant differences where the genus in the first row was stronger than the affiliated genus in the first column (e.g., Diplomoceras was significantly stronger than Baculites).

Loading Observations and Fracture Location
During the experimental trials, we observed cracks in some models before complete failure after peak load was reached (e.g., Diplomoceras, Douvilleiceras, Diaboloceras, and Manticoceras). These cracks are visible as small dips on the load versus displacement curve (Fig. 5B–E). Ammonitic, ceratitic, and goniatitic models (ammonoid morphologies) consistently showed crack propagation from the top and bottom of the model where the plates were in contact toward the center of each septum (Fig. 3A–I). Upon failure, the center of one or both septa frequently shattered. In the case of nautiloid septa (nautiloid morphologies) and straight septa (control morphology), we saw cracks in differing positions on the septa, some through the center of a septum, others toward the margins of a septum near the outer shell, and some that caused septa to break almost entirely free from the outer whorl wall (Fig. 3J,K). In all cases, cracks propagated through septa before the outer shell (cylindrical tube) began to crack.
Discussion
Using brittle 3D-printed materials allows for the relative comparison of the strength provided by different septal shapes (3D-printed models should not be used to infer the absolute magnitude of shell strength in life). While computational modeling methods (e.g., finite element analysis) have also proven useful to test extinct morphologies, it becomes increasingly difficult to accurately model the fracture and failure of shapes as the extinct morphologies increase in complexity. Thus, digital models typically yield stress distributions rather than modeling failure itself (Lemanis et al. Reference Lemanis, Zachow and Hoffmann2016b). By using physical models, we tested failure without these restrictions. These 3D-printed materials exhibit brittle behavior consistent with mechanical tests conducted on mollusk shells in previous studies (e.g., Kolmann et al. Reference Kolmann, Crofts, Dean, Summers and Lovejoy2015). While this study represents an idealized experimental setting with theoretical predators and prey, the compression tests performed here provide the best first-order approximation of septal shape and shell strength relationships so far provided by empirical testing.
Peak Load
Straight septa (representing controls) were stronger than ammonitic and goniatitic septa. However, there was no significant difference between models of real septal types (ammonitic, ceratitic, goniatitic, or nautiloid) (Fig. 4). In other words, ammonoid septa were not more resistant to crushing than nautiloid septa, and more complex ammonoid septa (those with higher scaling exponents) were not more resistant than less complex ammonoid septa (those with lower scaling exponents) (Table 1). Therefore, our results do not support the hypothesis that increased septal complexity increased resistance to shell-crushing predators. When comparing peak loads sustained by different models, we observed that strength varied among models of both the same septal type (e.g., ceratitic) and different septal types (e.g., ceratitic vs. goniatitic) (Fig. 5A, Supplementary Fig. S3). While some models were consistently more resistant to crushing than others of the same septal type (e.g., Diplomoceras and Schistoceras), others were consistently less resistant (e.g., Douvilleiceras) than other models of the same septal type. This indicates that specific morphology had a greater influence on shell strength than the relative complexity of each septa when categorized by septal shape type. We obtained our results from models with standard laterally compressed cylindrical shell shapes. We note results might change significantly if future researchers model the same septa in coiled shells with differing degrees of whorl overlap that could buttress the shell against compressive forces (Hewitt and Westermann Reference Hewitt and Westermann1997). Our study stands as a basis for this future work.
Loading Curve Shapes
The load-displacement curves were generally the same shape across different models. However, some models with ammonoid septal types (e.g., Diplomoceras, Douvilleiceras, Diaboloceras, and Manticoceras) exhibited small dips in load before peak load was reached, demonstrating precursor cracking in the model in the lead-up to failure (Fig. 5B–E). In contrast, nautiloid and straight septa models’ loading curves were almost entirely monotonically increasing before peak load was reached. These observed cracks before complete failure in ammonoid septal shapes may demonstrate that the more complex shape of ammonoid septa could accommodate small cracks before shattering entirely, possibly creating more potential to escape a predator before the shell was completely compromised. Similar failure behaviors are observed in composite materials with many length scales, as having many length scales may change the mode of failure of the overall shape (Li et al. Reference Li, Ortiz and Boyce2012). Additionally, the repetitious nature of fractal morphologies may allow for noncatastrophic failure to dissipate energy (Celli et al. Reference Celli, Tucci, Esposito and Palmonari2003).
This study serves as a useful approximation for understanding the role of shape in isolation; however, the shell's microstructure, which we did not test here, undoubtedly also contributed to crack propagation. Previous authors have indicated that a predator would benefit more from attacking the body chamber of the shell (Klompmaker et al. Reference Klompmaker, Waljaard and Fraaije2009; Landman et al. Reference Landman, Cobban and Larson2012), where most of the soft tissue was located, rather than the phragmocone, where septa were located (although in some coiled taxa the body chamber wraps around much of the phragmocone). Predators likely would have preferentially attacked the body chamber of the shell if possible; however, it is also possible that large predators like marine reptiles would have encompassed the entirety of the shell in their jaws without differentiating the location of the body chamber due to the difference between the size of the shell and their jaws. In instances such as these, the ability to dissipate energy by sustaining small cracks without completely shattering might give the ammonoid a better chance of escape. However, further testing would be required to analyze whether the fractal nature of ammonoid septa could have permitted small cracks before shattering or if even small cracks could have resulted in a fatal decrease in buoyancy.
Septal Morphology
Throughout all tests, we observed cracks forming in septa before any cracking was seen in the outer shell (cylindrical tube). During experimental trials, we observed that cracks in ammonoid septa (ammonitic, ceratitic, and goniatitic) generally propagated from the lateral sides of the septum, where contact was made between the plate and the outer shell wall, toward the center of the septum before the center of the septum shattered (Fig 3A–I). By comparison, breaks in nautiloid walls occurred in many different locations, including the center of the septum, and there were many breaks toward the outer shell wall to the left or right of the septum center (Fig. 3J,K). In some cases, the septum shattered almost completely, very close to the outer wall. It is important to recall that to isolate the effects of septal shape, the siphuncle foramen location was kept the same in all models—toward the edge of the septum near the outer wall of the shell. This morphology is consistent with siphuncle foramen placement in ammonoids; however, in Nautilus shells, the siphuncle foramen is in the septal center. It is notable that nautiloids, the geologically older taxon, more commonly had this foramen placement, while ammonoids with complex septa appeared in the fossil record immediately with the siphuncle foramen located toward the outer wall of the shell (venter). As holes can behave as stress concentrators (Zirka et al. Reference Zirka, Malezhik and Chernyshenko2004), our results raise the possibility that the location of the siphuncle foramen in ammonoids may differ from that in nautiloids, because the center of the septum was the weakest part of the septum, although further testing is needed. Thus, locating a stress concentrator in an already weak portion of the shell may have been problematic. Moreover, the observation that fossil ammonoids show thickening of the center of the septum and thinning toward the outer walls is consistent with our findings that show that shattering frequently occurred in the center of a septum (Hewitt and Westermann Reference Hewitt and Westermann1997; Klug and Hoffmann Reference Klug, Hoffmann, Klug, Korn, Baets, Kruta and Mapes2015). Our models were generated using uniform thicknesses for extrusion to negate differences across taxa. Thickening of the center of the septum in life likely achieved reinforcement of this otherwise weak portion of the septum, as shell thickening increases shell strength (Lakowitz et al. Reference Lakowitz, Brönmark and Nyström2008; Crofts and Summers Reference Crofts and Summers2014).
Limitations and Interpretation
The fossilization process has rendered the functional morphology of ammonoid septa physically untestable without modeling and re-creation. While physical models are highly informative, condensing complex biological systems into testable units requires many constraints and assumptions. The results of the theoretical tests conducted for this study represent first-order approximations of natural systems. Here, we used brittle materials to approximate the failure of theoretical morphologies, rendered using computer-automated design programs. There was no whorl overlap considered in this model, because differing degrees of whorl overlap in different taxa would likely influence shell strength. Instead, we isolated septal shape without the complication of whorl overlap using a laterally compressed cylinder similar to an orthoconic shell (although without tapering). Designing the models in this way, we performed fundamental mechanical tests to understand complex natural morphologies. Therefore, the results of this experiment are to be interpreted as a theoretical test case to approximate the contribution of septal shape to shell strength when all other morphological characteristics are equal. We also maintained constant septal thickness to remove complicating variations between different taxa. These results serve as a stepping-stone for future experiments that may model more complex morphological variations, including whorl overlap, shell coiling, and changes in septal thickness.
While the resin we used does not possess the microstructure of real molluscan shells, which is known to mitigate crack propagation (Salinas and Kisailus Reference Salinas and Kisailus2013; Kulicki et al. Reference Kulicki, Tanabe, Landman, Kaim, Klug, Korn, Baets, Kruta and Mapes2015), the foremost breakage observed showed brittle behavior as expected in real shells. Moreover, the dominant direction of crack propagation was through 3D-printed layers, rather than along them, as seen in real shells. The appropriate behavior of the model materials allowed for relative comparisons to be made between shapes. The results of this study, and others using 3D-printed models (e.g., bivalves; Johnson Reference Johnson2020), are intended to demonstrate the relative strength imparted by different septal morphologies in otherwise identical shells; however, they are not intended to replicate the exact forces needed to break shells in life. Finally, this experiment also used flat plates to mimic flat crushing dentitions. Therefore, the results do not assess puncture or the interaction of multiple teeth applying point loads across the phragmocone. A quasistatic loading regime, without momentum, was used as a standardized mechanical test, which draws no conclusions about the ability of these models or complex septa to withstand impact. We highlight our assumptions and experimental limitations here, because these factors are especially important when designing models as a proxy to study the functional morphology of extinct organisms.
Conclusions
Paleontologists have long sought to understand what adaptive advantage might have driven increasing complexity in ammonoid septa. While past investigators have proposed many hypotheses to explain the functionality of these unique morphologies, these ideas have remained challenging to test, because there are no comparably complex modern shell morphologies. Here, we have developed an experiment using 3D printing to test the hypothesis that increasingly complex septa are more resistant to crushing predation. Using 3D-printed models, we were able to conduct destructive tests without damaging specimens or encountering the challenges of the fossilization process, which renders fossils untestable for various reasons (taphonomy, lithification, etc.). Our study represents the first physical test conducted to examine the strength of ammonoid septa in compression. We obtained three main findings through our selected samples: (1) Septal complexity does not correlate with overall strength measured by peak load in compression. Thus, this study does not support the hypothesis that predation drove the increased complexity of ammonoid septa when experimentally tested using flat crushing plates. (2) In some cases, we found preliminary evidence that ammonoid septal shapes (ammonitic, ceratitic, and goniatitic) may display small cracks before the shell's ultimate failure. This may indicate that these septa's fractal morphologies allow small cracks to dissipate energy before ultimate failure. If further testing shows that this is a repeated occurrence, the self-similarity of more complex septa may permit more ductile behavior in compression by sustaining small breaks before catastrophic failure. (3) The location of crack propagation and ultimate breakage in ammonoid septa (repeatably in the center of a septum) and nautiloid septa (more variable, some centered, some toward the outer edge of the shell) raises an interesting evolutionary proposition for the placement of the siphuncle foramen in these taxa. Because holes can act as stress concentrators, this suggests that the center of a septum may have been a detrimental placement for a siphuncle foramen in an ammonoid should it be compressed—concentrating stress at the weak center of a septum. Thus, the mechanics of shell compression may have had a selective influence on the placement of this morphology in ammonoids. The experimental observation of relatively weak septal centers also gives a mechanical understanding of the variation in septal thickness in ammonoid fossils. The center of the septum is thicker than the outer edges, likely reinforcing a weak area. Our results indicate that shell-crushing predation was unlikely to have driven the evolution of increasingly complex septa. However, these findings raise the question of whether septal thickness and the placement of the siphuncle foramen were likely constrained for biomechanical reasons. Much work remains to understand how these unique shapes imparted shell strength and what additional factors may have driven their increasing complexity (buoyancy, liquid transport, etc.). This study demonstrates the usefulness of empirical testing enabled by rapidly developing technology, which will surely create exciting and novel opportunities to increase our understanding of the evolution of form and function in many taxa.
Acknowledgments
We thank P. Dodson, D. Jerolmack, and H. Pfefferkorn for helpful comments and discussions. We also thank D. Vann and S. Szewczyk for assistance with lab equipment. This research was in part supported by funding through the National Science Foundation Graduate Research Fellowship Program (DGE-1845298). Additionally, internal funding was provided by the Greg and Susan J. Walker Foundation and the Summer Research Stipend in Paleontology (Department of Earth and Environmental Science at the University of Pennsylvania). Delaware Valley Paleontological Society also supported this project through the Paul Bond Scholarship fund. The authors declare no competing interests.
Data Availability Statement
Data available from the Dryad Digital Repository: https://doi.org/10.5061/dryad.pvmcvdnk6.
Supplementary Figure S1. Materials test of rigid resin.
Supplementary Figure S2. Generalized depiction of the box method of fractal analysis modified from Peterman and Barton (Reference Peterman and Barton2019).
Supplementary Figure S3. Septal shape and shell strength with genera grouped by shape.