The buffalo (Bubalus bubalis) has an important contribution to the production of milk, meat, power, fuel and leather in numerous developing countries. Buffalo has intrinsic ability to provide milk with high milk fat contents varying from 6 to 8·5 per cent. Buffalo milk is held superior over cow milk due to its higher milk fat contents (Sarwar et al. Reference Sarwar, Khan, Nisa, Bhatti and Shahzad2009). The buffalo is a native animal of Iran, with over 80 per cent of its population concentrated in the north and north-west (Azerbaijan province) and 18 per cent in the south of the country (Borghese, Reference Borghese2005).
The energy balance is defined as the difference between energy consumed and energy used for maintenance and production (Goff & Horst, Reference Goff and Horst1997). Typically, fresh cows are not able to consume enough energy to meet their physiological energy requirements and, consequently, they enter into a negative energy balance status (Doepel et al. Reference Doepel, Lapierre and Kennelly2002; Bauman & Griinari, Reference Bauman and Griinari2003). Cows in an extreme state of negative energy balance in early lactation are metabolically stressed and show greater incidence of diseases such as mastitis, lameness, and metabolic disorders including ketosis (Goff & Horst, Reference Goff and Horst1997; Collard et al. Reference Collard, Boettcher, Dekkers, Petitclerc and Schaeffer2000). Moreover, fertility is impaired (Veerkamp et al. Reference Veerkamp, Oldenbroek, van der Gaast and van der Werf2000; Wathes et al. Reference Wathes, Fenwick, Cheng, Bourne, Llewellyn, Morris, Kenny, Murphy and Fitzpatrick2007). Enhancing nutrient intake seems, therefore, imperative to maximise health and reproduction of periparturient cows (Ghavi Hossein-Zadeh, Reference Ghavi Hossein-Zadeh2013). Milk components can be used as a diagnostic and monitoring tool in nutritional evaluation. Milk fat and protein concentrations follow the inverse of the lactation curve, mainly due to the dilution effect (Eicher, Reference Eicher2004). These variations should be considered when attempting to use milk components as a nutritional assessment tool (Podpečan et al. Reference Podpečan, Mrkum and Zrimšek2008). Several studies have shown a correlation between energy levels and milk composition using different traits such as fat to protein ratio (FPR), fat-lactose-quotient, milk yield and milk protein concentrations (Reist et al. Reference Reist, Erdin, Von Euw, Tschuemperlin, Leuenberger, Chilliard, Hammon, Morel, Philipona, Zbinden, Kuenzi and Blum2002). Increased fat mobilisation in a period of negative energy balance and a decrease in dry matter and energy intake are shown in higher milk fat concentration and lower milk protein concentration in postpartum period (Eicher, Reference Eicher2004; Čejna & Chladek, Reference Čejna and Chládek2005). FPR is mostly used as a diagnostic tool to estimate nutritional disbalance, negative energy balance and some metabolic disorders such as subclinical or clinical ketosis and abomasal displacement (Heuer et al. Reference Heuer, Schukken and Dobbelaar1999; Eicher, Reference Eicher2004). Thus, changes in FPR in milk could be an indication of the ability of a cow to adapt to the demands of milk production and reproduction efficiency in postpartum period (Loeffler et al. Reference Loeffler, de Vries and Schukken1999).
The lactation curve gives a graphic description of the relationship between milk yield and lactation time beginning at calving (Papajcsik & Bodero, Reference Papajcsik and Bodero1988). Mathematical equations of the lactation curve provide an important tool for basic research studies focused on extending the scientific information of complex physiological processes which underlie the mechanism of milk production and secretion (Dimauro et al. Reference Dimauro, Cappio-Borlino, Macciotta and Pulina2007). The lactation curves and their features for milk yield and its components (milk fat and protein percentage) for the first three lactations of Iranian buffaloes were reported in previous study (Ghavi Hossein-Zadeh, Reference Ghavi Hossein-Zadeh2016), but studies on the lactation curve for FPR in buffaloes are scarce in the literature. Therefore, the objective of the current study was to evaluate seven empirical non-linear mixed functions (Brody, Wood, Dhanoa, Sikka, Nelder, Rook and Dijkstra) to examine their efficiency in describing the lactation curve for FPR in the first three lactations of Iranian buffaloes.
Materials and methods
Data
Initial data set were 43,818 test-day records for milk fat to protein ratio (FPR) from the first three lactations of Iranian buffaloes. Data were recorded on 523 dairy herds in the period from 1996 to 2012 by the Animal Breeding Center of Iran. Outliers and out of range records were deleted from the analyses. Records from days in milk (DIM) <5 and >305 d were eliminated. Records were also eliminated if no registration number was present for a given buffalo. Analyses were applied to only the first three lactations and, therefore, data from later lactations were also discarded. After editing, 24 723 test-day records of FPR were used in the statistical analysis. First lactation cows represented 37·4%, whereas second- and third lactations accounted for 32·2 and 30·4% of the total test-day records, respectively.
Lactation curve models
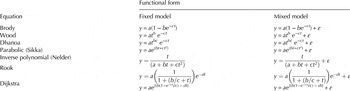
The non-linear equations used to characterise the lactation curves for FPR are shown in Table 1. A first effort to describe the temporal variation of milk yield with a functional relationship was suggested by Brody et al. (Reference Brody, Ragsdale and Turner1923) which used an exponential function to indicate the declining phase of lactation in dairy cattle. The incomplete gamma function proposed by Wood (Reference Wood1967) has been applied extensively to study lactation curves, in which scaling factor a represents yield at the start of lactation, b is the inclining slope parameter up to peak yield, and c is the declining slope parameter (Silvestre et al. Reference Silvestre, Petim-Batista and Colaço2006). Dhanoa (Reference Dhanoa1981) proposed a model which is similar to the Wood (Reference Wood1967) model. This model provided a lower correlation between parameters b and c, than was the case between these parameters in the original Wood model. The parabolic exponential function introduced by Sikka (Reference Sikka1950) to model milk yield resulted in a bell shaped truncated curve that, as a result of the curve symmetry around peak yield, only fitted milk yield reasonably during first lactation (Gahlot et al. Reference Gahlot, Gahlot and Jairath1988). Nelder model is a derivation of the Sikka model proposed by Nelder (Reference Nelder1966) using an inverse exponential parabolic model. Inverse polynomials are generally non-negative, bounded, and have a second-order form which has no built-in symmetry. The inverse polynomial overcomes the objections of ordinary polynomials (Nelder, Reference Nelder1966). Dijkstra model derived from mechanistic models of the mammary gland by Dijkstra et al. (Reference Dijkstra, France, Dhanoa, Maas, Hanigan, Rook and Beever1997). Rook et al. (Reference Rook, France and Dhanoa1993) and Dijkstra et al. (Reference Dijkstra, France, Dhanoa, Maas, Hanigan, Rook and Beever1997) proposed modified forms of mechanistic models, based on a set of differential equations representing cell proliferation, and cell death, in the mammary gland, which resulted in a 4-parameter equation.
Models used to describe the lactation curve for fat to protein ratio of Iranian buffaloes

y = Fat to protein ratio; a, b, c and d are parameters that define the scale and shape of the lactation curve; t = Time from parturition; ε = Random residual effect.
Statistical analyses
Each lactation model was fitted to monthly FPR records of dairy buffaloes using the NLIN and NLMIXED procedures in SAS (SAS Institute, 2002) and the parameters were estimated. The NLMIXED procedure fits non-linear mixed models, that is, models in which both fixed and random effects enter non-linearly. This procedure fits non-linear mixed models by maximising an approximation to the likelihood integrated over the random effects. The residual and random effects in a mixed model were assumed to be independent and normally distributed with zero mean and constant variance. Initial values for each parameter were obtained from the results of fixed effect models which were run by using NLIN procedure in SAS, and then the NLMIXED procedure used an iterative approach based on these initial values to generate a solution that properly account for individual animal effect on repeated FPR records. The mixed models were tested for goodness of fit (quality of prediction) using Akaike's information criterion (AIC), Bayesian information criterion (BIC) and log maximum likelihood (−2 Log L).
AIC was calculated as using the equation (Burnham & Anderson, Reference Burnham and Anderson2002):
 $${\rm AIC} = n \times \ln \left( {{\rm RSS}} \right) + 2p$$
A smaller numerical value of AIC indicates a better fit when comparing models. BIC combines maximum likelihood (data fitting) and choice of model by penalising the (log) maximum likelihood with a term related to model complexity as follows:
 $${\rm BIC} = n\ln \left( {\displaystyle{{{\rm RSS}} \over n}} \right) + p\ln \left( n \right)$$
A smaller numerical value of BIC indicates a better fit when comparing models. Also, a model with lower −2 Log L provides the best fit when compares with other models.
Results
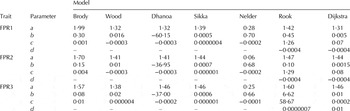
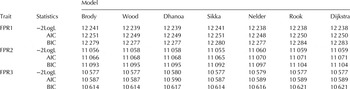
Estimated parameters of non-linear mixed models for the first-, second- and third-parity dairy buffaloes are presented in Table 2. Also, goodness of fit statistics for the seven equations fitted to average standard curves of FPR according to parity class are shown in Table 3. The Nelder and Sikka mixed models provided the best fit of lactation curve for FPR in the first and second parities of Iranian buffaloes because of the lower values of AIC, respectively. However, Wood, Dhanoa and Sikka mixed models provided the best fit of lactation curve for FPR in the third parity buffaloes. The goodness of fit statistics for Wood and Dhanoa models were similar or very close in this study.
Parameter estimates obtained from mixed models for the different lactation equations of the first three parities of dairy buffaloes

a, b, c and d are parameters that define the scale and shape of the lactation curve; FPR1: First lactation fat to protein ratio; FPR2: Second lactation fat to protein ratio; FPR3: Third lactation fat to protein ratio.
Comparing goodness of fit for average standard curves of fat to protein ratio according to lactation class, for Brody, Wood, Dhanoa, Sikka, Nelder, Rook and Dijkstra mixed models

AIC, Akaike information criteria; BIC, Bayesian information criterion; −2LogL: log maximum likelihood; FPR1: First lactation fat to protein ratio; FPR2: Second lactation fat to protein ratio; FPR3: Third lactation fat to protein ratio.
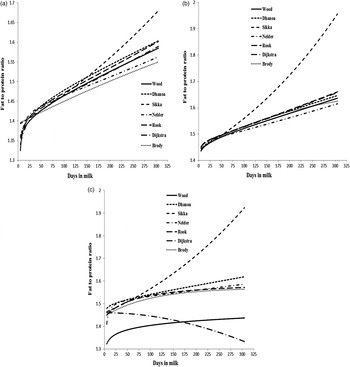
For the first parity, the average FPR decreased from 1·32 at 5 DIM to the minimum value of 1·09 on 7 DIM and subsequently reached to 1·26 on 305 DIM. For the second parity, the average FPR decreased from 1·52 at 5 DIM to the minimum value of 1·25 on 58 DIM and finally reached to 1·69 on 305 DIM. For the third parity, the average FPR decreased from 1·62 at 5 DIM to the minimum value of 1·27 on 220 DIM and subsequently reached to 1·70 on 305 DIM (Table 4). Minimum FPR (MY) and test time at which daily FPR was minimum (MT) predicted by the seven non-linear functions are shown in Table 4. Evaluation of first, second and third lactations features showed that all equations, except for Dijkstra model in the third lactation, under-predicted MT. On the other hand, MY was over-predicted by all models. Predicted FPR lactation curves by Brody, Wood, Dhanoa, Sikka, Nelder, Rook and Dijkstra equations are depicted in Fig. 1. For the first and second lactations, the lowest value of FPR was observed in early lactation, which was followed by a consistent increase as the lactation progressed toward the end of the lactation period. For the third lactation, trend of FPR was similar to the corresponding trend in the first two lactations for predicted charts obtained by Brody, Wood, Dhanoa, Sikka, Nelder and Rook models, but the greatest FPR obtained by the Dijkstra equation was observed in early lactation and then a consistent decrease toward the end of the lactation period was occurred (Fig. 1).
Predicted fat to protein ratio obtained with different non-linear models in lactations 1 (a), 2 (b) and 3 (c).

MT and MY for average standard lactations of fat to protein ratio according to lactation class, predicted by Brody, Wood, Dhanoa, Sikka, Nelder, Rook and Dijkstra models

FPR1: First lactation fat to protein ratio; FPR2: Second lactation fat to protein ratio; FPR3: Third lactation fat to protein ratio; MY: Minimum value for fat to protein ratio; MT = Test time at which daily FPR was minimum.
Discussion
This study is the first to compare non-linear models for describing the lactation curve for FPR in buffaloes. Identification of a mathematical function with the ability to describe suitably the lactation curve pattern for FPR in buffaloes could provide the possibility of direct selection on the level of the lactation curve and development of an optimal method to obtain an appropriate lactation shape through modifying the lactation model parameters. The similarity of Wood and Dhanoa models for modelling lactation curve of FPR could be expected because Dhanoa model is the reparameterised form of the Wood equation (Ghavi Hossein-Zadeh, Reference Ghavi Hossein-Zadeh2014). Buttchereit et al. (Reference Buttchereit, Stamer, Junge and Thaller2010) compared five models of lactation curve for FPR (Ali & Schaeffer, Guo & Swalve, Wilmink, Legendre polynomials of third and fourth degree) and selected Ali & Schaeffer as the best model for fitting lactation curve of FPR in German Holsteins. Differences between the characteristics of the lactation curves in primiparous and multiparous cows are probably to be responsible for the substantial difference between goodness of fit of the models for the different lactations. The variation in the fit of non-linear models may have arisen from the differences in mathematical functions of the models, differences of test day yield, the amount of data, the number of test day records and the intervals between tests (Ghavi Hossein-Zadeh, Reference Ghavi Hossein-Zadeh2014). A combination of genetic and environmental factors would affect on lactation curves properties (Pérochon et al. Reference Pérochon, Coulon and Lescourret1996). It is important to consider the characteristics as well as biological and physiological basis of mathematical models to interpret the outputs obtained from fitting these equations.
In most studies on dairy cattle, lactation curves reported for FPR indicated relatively greater values in early lactation (Čejna & Chládek, Reference Čejna and Chládek2005; Buttchereit et al. Reference Buttchereit, Stamer, Junge and Thaller2010; Jamrozik & Schaeffer, Reference Jamrozik and Schaeffer2012) followed by a decline or stabilisation toward the middle or end of lactation. Contrary to the variation of FPR in early lactation in Holstein cows, the lowest values of FPR observed in early lactation and a consistent increasing trend existed toward the end of lactation. The FPR peak in early lactation could be related to the negative energy balance and the consequent tissue mobilisation associated with stresses of calving and peak milk production (Buttchereit et al. Reference Buttchereit, Stamer, Junge and Thaller2010; Toni et al. Reference Toni, Vincenti, Grigoletto, Ricci and Schukken2011; Jamrozik & Schaeffer, Reference Jamrozik and Schaeffer2012). In this period, an energy deficit leads to an increased fat synthesis in the udder, and inadequate intake of carbohydrates can cause an insufficient protein synthesis by ruminal bacteria resulting in a decrease in milk protein content (Gürtler & Schweiger, Reference Gürtler, Schweiger, von Engelhard and Breves2005; Buttchereit et al. Reference Buttchereit, Stamer, Junge and Thaller2010). The lack of FPR peak in early lactation of buffaloes could be related to the absence of negative energy balance in this critical period of lactation. This could partly due to the lower milk production of dairy buffaloes compared with high producing breeds of dairy cows such as Holsteins. Therefore, FPR may be an easy tool to differentiate between cows that can or cannot cope with the challenges of an early lactation (Jamrozik & Schaeffer, Reference Jamrozik and Schaeffer2012). Increasing trend of FPR toward the end of lactation could also be due to increased energy requirements by heavily pregnant cows to support milk production and advanced foetal growth (Negussie et al. Reference Negussie, Strandén and Mäntysaari2013). Buttchereit et al. (Reference Buttchereit, Stamer, Junge and Thaller2010) observed a slight increase in FPR toward the end of the lactation in German Holsteins. Negative energy balance which occurs toward the end of lactation and before calving, when dry matter intake decreases was also reported in transition cows (Grummer, Reference Grummer1995; Leslie, Reference Leslie2000). During this period, increased energy demand in late gestation and a decrease in dry matter intake before calving, makes dairy buffaloes susceptible to a variety of health problems (Miksa et al. Reference Miksa, Buckley and Poppenga2004). An increase in FPR in a significant proportion of early-lactation cows indicates a transition problem that should be dealt with at the herd or group level with cows in the early dry period and transition period (Grummer et al. Reference Grummer, Mashek and Hayirli2004; Mulligan et al. Reference Mulligan, O'Grady, Rice and Doherty2006; Toni et al. Reference Toni, Vincenti, Grigoletto, Ricci and Schukken2011).
The change in FPR over the lactation might be an appropriate selection criterion in order to improve the energy status. It should be noted that the FPR is a trait with an intermediate optimum which makes the inclusion into breeding programs a complicated task. Selection on a low FPR may be beneficial for cow robustness, but, on the other hand, a very low fat to protein ratio is known to be an indicator for acidosis (Seggewiß, Reference Seggewiß2004). However, acidosis incidence is largely dependent on feeding management. In early lactation, dry matter intake is limited and dairy herd managers often try to compensate by increasing the energy density of the diet. Replacement of forage with a more concentrated food containing less effective fiber allows the cow to consume more energy but also leads to decreased rumination, decreased buffering of the rumen, decreased rumen pH and eventually to acidosis.
Conclusion
Of the seven mathematical functions investigated in this study, Nelder and Sikka models provided the best fit of lactation curve for FPR in the first and second lactations of Iranian buffaloes because of the lower values of AIC, respectively. However, Wood, Dhanoa and Sikka models provided the best fit of lactation curve for FPR in the third lactation buffaloes. Evaluation of first, second and third lactation features showed that all equations, except for Dijkstra model in the third lactation, under-predicted MT. On the other hand, MY was over-predicted by all models.
Author wishes to acknowledge the Animal Breeding Center of Iran for providing the data used in this study.