Introduction
Primates use saccadic eye movements to shift their gaze to interesting objects. By doing this, the object is projected on the fovea, the part of the retina with the highest visual acuity. If the inspected object is moving, it can be stabilized on the retina by means of smooth pursuit eye movements. This essentially prevents blurring by retinal motion. Both the maximization of visual acuity and the minimization of retinal motion are clearly beneficial for the recognition of the tracked object.
Besides these retinal consequences of saccades and smooth pursuit, there are also nonretinal influences on visual perception. Since the early work of Holt (Reference Holt1903), it is known that saccades affect visual sensitivity. More recently, it has been shown that luminance sensitivity for low spatial frequencies is selectively suppressed, while color sensitivity and luminance sensitivity for high spatial frequencies are unaffected (Burr et al., Reference Burr, Morrone and Ross1994). It is also known that the suppression is caused actively by an efference copy or corollary discharge (Sperry, Reference Sperry1950; von Holst & Mittelstaedt, Reference von Holst and Mittelstaedt1950; Diamond et al., Reference Diamond, Ross and Morrone2000; Wurtz, Reference Wurtz2008). Recently, we showed that not only saccadic but also smooth pursuit eye movements affect visual sensitivity: during smooth pursuit, the sensitivity for colored stimuli and luminance stimuli containing high spatial frequencies is enhanced (Schütz et al., Reference Schütz, Braun, Kerzel and Gegenfurtner2008). This enhancement precedes the onset of smooth pursuit by approximately 50 ms and scales positively with smooth pursuit velocity.
One can imagine several ways to accomplish such an enhancement of contrast sensitivity. First, it might be that the amount of temporal (Watson, Reference Watson, Boff, Kaufman and Thomas1986) or spatial (Olzak & Thomas, Reference Olzak, Thomas, Boff, Kaufman and Thomas1986) summation is increased. For instance, it has been shown that the amount of temporal and spatial summation is modulated by the intensity of the background (Barlow, Reference Barlow1958). Increasing the temporal or spatial summation leads to an improvement of sensitivity at lower temporal and spatial frequencies but also to a reduction of sensitivity at higher temporal and spatial frequencies. Hence, an increase of summation is not very probable because we previously found an improvement of sensitivity during pursuit for red–green flicker of high temporal frequency as well as for high–spatial frequency luminance stimuli. On the other hand, the spatial and temporal summation might be decreased. This would result in an improvement at high temporal and spatial frequencies but also in an impairment at low temporal and spatial frequencies. This hypothesis would be consistent with our findings of an enhancement at high temporal and spatial frequencies. Both the decrease and the increase of summation would change the contrast sensitivity function mainly at the extreme ends of the visible frequency axis. However, the integral of the contrast sensitivity function would not change, which means that the overall sensitivity is not changed. Finally, a general increase in sensitivity might also be accomplished by an increased contrast gain of a neural subpopulation. For instance, recent experiments show that attention can modulate neural activity as early as in the lateral geniculate nucleus (LGN) (O’Connor et al., Reference O’Connor, Fukui, Pinsk and Kastner2002; McAlonan et al., Reference McAlonan, Cavanaugh and Wurtz2008). In the present study, we investigated the temporal and spatial characteristics of the sensitivity enhancement during smooth pursuit. By doing so, we strived to gain insight into the underlying mechanism of the enhancement.
Experiment 1: Temporal impulse response functions for color
Since we found an improvement for red–green flicker at 16 Hz as well as for briefly flashed stimuli, we argued that the sensitivity improvement is not accomplished by an increased temporal summation (Schütz et al., Reference Schütz, Braun, Kerzel and Gegenfurtner2008). In sharp contrast to temporal summation, it has been suggested that the chromatic temporal resolution is increased during smooth pursuit (Terao et al., Reference Terao, Watanabe, Yagi and Nishida2008). An increase of temporal resolution, however, might be a result of two different mechanisms: First, it might be that the temporal impulse response function (TIRF) becomes faster, which would mean that sensitivity is improved only for high temporal frequencies. Second, it might be that the overall contrast sensitivity is increased, which would among other things increase the temporal resolution. In Experiment 1, we wanted to clarify whether the enhancement of chromatic contrast sensitivity during pursuit is indeed caused by a shift of the TIRF or if there is an overall increase of chromatic sensitivity. To this end, we compared TIRF for color during fixation and smooth pursuit.
A lot of studies investigated TIRF, both psychophysically and physiologically, and several differences between the TIRF for color and luminance have been observed. Psychophysically, it has been shown that the TIRF for luminance is biphasic with a strong suppression (Ikeda, Reference Ikeda1965; Rashbass, Reference Rashbass1970), whereas the TIRF for color is monophasic (Uchikawa & Ikeda, Reference Uchikawa and Ikeda1986; Burr & Morrone, Reference Burr and Morrone1993) or only slightly biphasic (Eskew et al., Reference Eskew, Stromeyer and Kronauer1994). Physiology showed that the TIRF of “color-blind” magnocellular neurons speeds up with increasing stimulus contrast, whereas color-opponent parvocellular neurons do not change their impulse response (Lee et al., Reference Lee, Pokorny, Smith and Kremers1994; Benardete & Kaplan, Reference Benardete and Kaplan1999).
For luminance processing, there is some evidence that the TIRF shows a higher natural temporal frequency during smooth pursuit (Bedell et al., Reference Bedell, Ramamurthy, Patel and Vu-Yu2003; Tong et al., Reference Tong, Patel and Bedell2006). Consistent with that finding, we observed a trend for a shift of the temporal contrast sensitivity function (TCSF) for luminance to higher temporal frequencies during smooth pursuit and a significant reduction of the sensitivity at all temporal frequencies (Schütz et al., Reference Schütz, Delipetkos, Braun, Kerzel and Gegenfurtner2007). During saccades, the TIRF is also accelerated for luminance but not for color (Burr & Morrone, Reference Burr and Morrone1996).
Materials and methods
Design
We estimated TIRF by measuring contrast sensitivity for pairs of stimuli that were successively presented. Stimulus pairs have been used for a long time to estimate the temporal properties of the visual system during fixation (Ikeda, Reference Ikeda1965; Rashbass, Reference Rashbass1970; Burr & Morrone, Reference Burr and Morrone1993) and have also been applied during eye movements (Burr & Morrone, Reference Burr and Morrone1996; Bedell et al., Reference Bedell, Ramamurthy, Patel, Subramaniam, Vu-Yu and Tong2008). We tested 10 different stimulus onset asynchronies (SOAs) between stimulus pairs: 0, 10, 20, 30, 40, 60, 80, 120, 150, and 200 ms. The stimulus pair was either in phase (IN), meaning that both stimuli had the same contrast modulation, or out of phase (OUT), meaning that they had opposite contrast modulations. Each condition (SOA plus contrast modulation) was tested during fixation and smooth pursuit. This resulted in a 10 (SOA) × 2 (contrast modulation) × 2 (eye movement condition) design matrix. Subjects performed the experiment in several sessions; in each session, one SOA was tested in all other conditions.
Subjects
One of the authors (A.C.S.) and one naïve subject (HO) participated in the experiments. The naïve subject was a male student of the Justus-Liebig-University who was paid for his participation. Both subjects had normal or corrected to normal vision.
Equipment
Subjects were seated in a dimly lit room facing a 21-inch CRT monitor (ELO Touchsystems, Fremont, CA) driven by a Nvidea Quadro NVS 285 graphics board with a refresh rate of 100 Hz noninterlaced. The gamma nonlinearity of the monitor was measured with a Laser 2000 Model 370 Photometer (UDT Instruments, Baltimore, MD) and corrected using a lookup table. At a viewing distance of 47 cm, the active screen area subtended 45 deg in the horizontal direction and 36 deg vertical on the subject’s retina. With a spatial resolution of 1280 × 1024 pixels, this results in 28 pixels/deg. The subject’s head was fixed in place using a chin rest.
Eye movement recording and analysis
Eye position signals were recorded with a head-mounted video-based eye tracker (EyeLink II; SR Research Ltd., Osgoode, Ontario, Canada) and were sampled at 250 Hz. Subjects viewed the display binocularly. Stimulus display and data collection were controlled by a PC. We obtained eye velocity signals by digital differentiation of eye position signals over time. The eye position and velocity signals were filtered by a Butterworth filter with cutoff frequencies of 30 and 20 Hz, respectively. To determine smooth pursuit gain, we divided the eye velocity by the pursuit target velocity in a 150-ms interval, 1250 ms after pursuit target motion onset. To detect saccades, we used a cutoff criterion (75,000 deg/s3) on the third derivative of eye position (Wyatt, Reference Wyatt1998). Trials containing saccades in an interval of 100 ms centered on stimulus presentation (7% for subject A.C.S. and 4% for HO), and trials with a pursuit gain lower than 0.7 (1% for both subjects) were discarded and then repeated.
Visual stimuli
We used a black bull’s-eye with an outer radius of 0.3 deg and an inner radius of 0.15 deg as pursuit respective fixation target. To measure contrast sensitivity, we used horizontal lines. The lines spanned the whole screen width and were vertically modulated by a Gaussian distribution with an s.d. of 0.15 deg. Each line was flashed for one refresh cycle of the monitor. At a refresh rate of 100 Hz, this gives a nominal stimulus duration of 10 ms. Due to the decay of phosphors, the actual stimulus duration was shorter. Using a stimulus that was parallel to stimulus motion and by flashing it just for a brief period of time, we wanted to make sure that no retinal image motion was induced by the eye movements. The lines were modulated in contrast along the L–M axis of the DKL color space (Derrington et al., Reference Derrington, Krauskopf and Lennie1984). The same stimuli have been used in our previous studies on chromatic contrast sensitivity (Schütz et al., Reference Schütz, Braun, Kerzel and Gegenfurtner2008, Reference Schütz, Braun and Gegenfurtner2009). The contrast type of the first line was determined randomly (L or M). The contrast of the second line resulted from the contrast of the first line and the phase condition.
Experimental procedure
At the beginning of each trial, a black bull’s-eye with an outer radius of 0.3 deg and an inner radius of 0.075 deg appeared at the screen center. The subjects had to fixate the bull’s-eye and press an assigned button to start the trial. This triggered the EyeLink II System to perform a drift correction to correct errors of headband slippage or other factors. If the drift correction succeeded, the initial bull’s-eye disappeared and was replaced by the eye movement target. In fixation trials, we presented the bull’s-eye for 1500 ms at the center of the screen, where observers had to keep fixation. One thousand milliseconds after the beginning of the trial, we flashed the first stimulus for 10 ms, 2 deg above or below the bull’s-eye. The second stimulus was flashed at the respective SOA. In pursuit trials, we presented the bull’s-eye at 13 deg left or right of the center of the screen. After 250 ms, the bull’s-eye moved toward the screen center at a velocity of 10.6 deg/s, and observers were instructed to track it as accurately as possible. When the bull’s-eye reached the screen center, we flashed the first stimulus and the second stimulus with the respective SOA. Motion continued for another 500 ms. Subjects had to indicate if the pair of lines appeared above or below the bull’s-eye at the end of the trial.
Psychophysical data analysis
We adjusted the contrast of the stimulus pair according to a staircase procedure (Levitt, Reference Levitt1971) and obtained thresholds by fitting the percentage of correct answers for the different contrast levels with a cumulative Gaussian function. We used the Psignifit toolbox in Matlab to fit the psychometric function (Wichmann & Hill, Reference Wichmann and Hill2001). Different functions have been used previously to fit TIRF (Burr & Morrone, Reference Burr and Morrone1993; Bedell et al., Reference Bedell, Ramamurthy, Patel, Subramaniam, Vu-Yu and Tong2008). We fitted both functions to our data and finally chose the function used by Bedell et al., 2008 because it provided a similar quality of fits with a smaller number of free parameters. This function describes a second-order linear system by three free parameters: the response amplitude, A; the natural temporal frequency, W (in radians/s); and the damping ratio, D. For convenience, all values of the natural temporal frequency W are given in Hertz.

The response for a pair of stimuli is given by eqn. (2). The sign depends on the phase condition. The responses are subtracted for out-of-phase stimuli and added for in-phase stimuli.

Finally, the contrast sensitivity is obtained by summing the responses (Watson, Reference Watson1979) in 1000-ms interval (eqn. 3).

We determined the three free parameters by means of minimization of the sum of the squared errors (RSS).
To figure out how the impulse response functions differ between fixation and pursuit, we fitted different types of models and compared their ability to explain the data. These models could not be compared solely on the basis of the RSS because they differed in respect to the number of free parameters. Hence, we calculated the Akaike information criterion (AIC) (Akaike, Reference Akaike1974) according to eqn. (4) and the Bayesian information criterion (BIC) (Schwarz, Reference Schwarz1978) according to eqn. (5) to compare the quality of the different models. n gives the number of fitted data points; k, the number of free parameters in the model (plus one to include the residual sum of squares, which also belongs to the estimated parameters); and RSS, the residual sum of squares.


We calculated for both indices the difference between the individual values and the lowest value according to eqn. (6) (Burnham & Anderson, Reference Burnham and Anderson2002) because absolute values of AIC and BIC are not meaningful.

Finally, we calculated the relative weights for each model as in eqn. (7) (Burnham & Anderson, Reference Burnham and Anderson2002). This probability estimates which model is most likely the “true” model.

We tested eight different models: In the two extreme models, either all parameters were allowed to be different between fixation and pursuit (none) or all parameters had to be identical for fixation and pursuit (A&W&D). In the intermediate models, either one (A, W, or D) or two (A&W, A&D, or W&D) of the parameters had to be identical for fixation and pursuit. Each model is named after the parameters that are fixed to equal values during fixation and pursuit.
Results
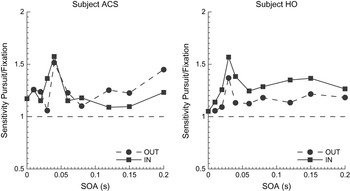
Here, we measured chromatic sensitivity for two-pulse stimuli at 2-deg eccentricity. As we were primarily interested in sensitivity differences between fixation and pursuit, we first analyzed the sensitivity ratios between fixation and pursuit (Fig. 1). Sensitivity during pursuit was higher than during fixation for all experimental conditions. This result by itself is not compatible with the assumption of a shift of the TIRF for color during smooth pursuit. In this case, sensitivities during pursuit should only be higher for some SOAs but also lower for other SOAs. On average, the sensitivity ratio amounted to 1.24 (s.d. 0.14) for subject A.C.S. and 1.23 (s.d. 0.13) for subject HO. The maximum sensitivity ratio of 1.57 was reached at SOAs of 40 (A.C.S.) respective 30 (HO) ms.
Experiment 1: Color sensitivity ratio between fixation and pursuit. The dotted lines and circles represent out-of-phase stimulation, and the continuous line and squares represent in-phase stimulation. Markers represent measured sensitivity ratios; the lines are obtained by linear interpolation. The dashed horizontal line indicates points with equal sensitivity during fixation and pursuit.

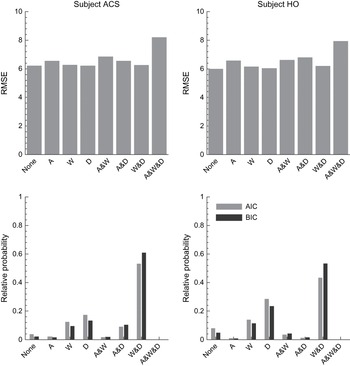
To do a more thorough analysis, we fitted different TIRFs to the data. The models differed in respect to the constraints on parameter differences between fixation and pursuit. Fig. 2 shows the root mean square error (RMSE) and the relative probability of AIC and BIC for all models. All models provided a good fit to the data, indicated by the small RMSE, except for the model that did not allow any differences between fixation and pursuit (A&W&D).
Experiment 1: Quality of model fit. The two columns show the data for two subjects. The upper row shows the RMSE for the seven different models. The lower row shows the relative probability of the AIC in gray and the BIC (Schwarz, Reference Schwarz1978) in black for the different models. Superior models are indicated by a lower RMSE and higher relative probability. Each model name contains the parameters that are fixed to equal values during fixation and pursuit.

As the models differed in the number of free parameters, we determined the best model on the basis of the AIC and BIC (Fig. 2). For both subjects, the relative probability of the AIC and BIC was highest for the model with a fixed temporal frequency and a fixed damping ratio (W&D). For this model, the relative probability of the AIC reached 0.53 for subject A.C.S. and 0.43 for subject HO. The relative probability of the BIC reached even higher values, 0.61 and 0.53 for A.C.S. and HO, respectively. Hence, the W&D model accounted best for the data. This indicates that the differences between pursuit and fixation were mostly governed by different response amplitudes. The comparison between the models with one fixed parameter (A, W, or D) pointed in the same direction: As all these models had the same number of free parameters, the AIC and BIC depended solely on the RSS. The relative probability for the model with a fixed response amplitude (A) was lower by at least 0.1 for the AIC and 0.07 for the BIC when compared to the models with a fixed temporal frequency (W) or with a fixed damping ratio (D). This also indicates that different response amplitudes were the major source of the sensitivity differences between pursuit and fixation.
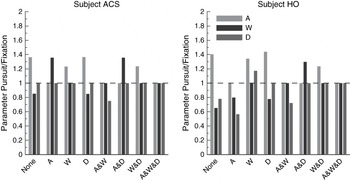
In the next step, we compared the fitted parameter values during pursuit and fixation (Fig. 3; Supplemental Table 1). Higher response amplitudes during pursuit were observed consistently in all models that allowed differences in that parameter (none, W, D, or W&D). This further supports that pursuit and fixation differed in respect to the response amplitude. For the natural temporal frequency, the difference is not as consistent. For subject A.C.S., the temporal frequency was lower during pursuit for two models (none and D) and higher for two other models (A and A&D). For subject HO, the temporal frequency was lower during pursuit for three models (none, A, and D) and higher only for one model (A&D). Please note that especially the models with a higher temporal frequency during pursuit showed a very low relative probability of AIC and BIC. Hence, if there were any changes in the temporal frequency of the TIRF, it was lowered during pursuit. The damping ratio was lower during pursuit or identical except for one case (subject HO and model W).
Experiment 1: Parameters ratios between fixation and pursuit. The two columns show the data for two subjects. The light gray bars indicate parameter A, the black bars indicate parameter W, and the medium gray bars indicate parameter D. The dashed horizontal line indicates points where parameters are equal during smooth pursuit and fixation.

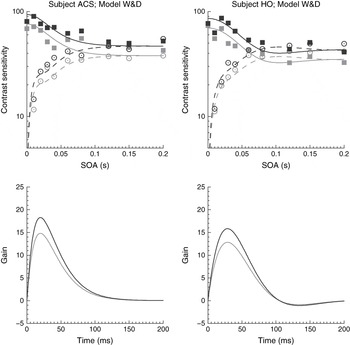
Fig. 4 shows the measured contrast sensitivity, the fits for the best model (W&D), and the resulting TIRF. For both subjects, the TIRF is nearly monophasic, which would result in a low-pass shape of the TCSF. This is in line with previous reports of the low-pass characteristics of the chromatic TCSF (Kelly, Reference Kelly1975, Reference Kelly1983). The monophasic character of the TIRF holds true for all fitted models indicated by the large damping values.
Experiment 1: Color contrast sensitivity and the fitted model. The two columns show the data for two subjects. The upper row shows the measured contrast sensitivity and the model fit during pursuit (black) and fixation (gray) for in-phase stimulation (filled squares and continuous line) and out-of-phase stimulation (open circles and dashed line). The lower row shows the impulse response functions on which the model is based. For both subjects, model W&D has been used to fit the data.

Discussion
In Experiment 1, we measured chromatic contrast sensitivity for two-pulse stimuli with different SOAs. We showed that the sensitivity improvement by smooth pursuit occurred for all SOA conditions. Furthermore, we fitted TIRF to the data and compared several models that allowed differences between fixation and smooth pursuit on different model dimensions. We could show that a model with equal natural temporal frequency and equal damping ratio during fixation and pursuit fitted the data better than any other model. Hence, the chromatic TIRF seemed not to be shifted along the time axis during smooth pursuit and fixation. Instead, the major difference between smooth pursuit and fixation could be expressed as a multiplicative scaling of chromatic sensitivity. As we previously showed that the sensitivity enhancement is not accomplished by an increased spatial integration (Schütz et al., Reference Schütz, Braun, Kerzel and Gegenfurtner2008), it is most likely that the sensitivity enhancement is accomplished by an increased contrast gain. This is a physiologically plausible hypothesis as it has been shown that the contrast gain can be increased by feedback connections: cooling of V1 and thereby reducing feedback to LGN reduces the contrast gain in both magnocellular and parvocellular neurons (Przybyszewski et al., Reference Przybyszewski, Gaska, Foote and Pollen2000). Attention is another example of a feedback-based neuronal modulation, which can occur as early as in the LGN (O’Connor et al., Reference O’Connor, Fukui, Pinsk and Kastner2002; McAlonan et al., Reference McAlonan, Cavanaugh and Wurtz2008).
Recently, it has been reported that the visual system integrates color along a motion trajectory, which can lead to color mixing (Nishida et al., Reference Nishida, Watanabe, Kuriki and Tokimoto2007) or to an increase of chromatic flicker fusion frequency (Watanabe & Nishida, Reference Watanabe and Nishida2007). This mechanism probably helps to reduce motion blur (Burr, Reference Burr1980). Furthermore, it has been shown that the execution of smooth pursuit additionally increases the flicker fusion frequency (Terao et al., Reference Terao, Watanabe, Yagi and Nishida2008). Previous results (Schütz et al., Reference Schütz, Braun, Kerzel and Gegenfurtner2008) and the results of this experiment suggest that the temporal resolution is increased by an increased contrast gain at all temporal frequencies and not by a speeding up of the TIRF.
Several studies investigated the effects of smooth pursuit on luminance processing. It has been shown that the natural temporal frequency is higher during pursuit than during fixation (Bedell et al., Reference Bedell, Ramamurthy, Patel and Vu-Yu2003; Tong et al., Reference Tong, Patel and Bedell2006). Interestingly, the natural temporal frequency seems to be even higher for motion against pursuit direction. In a previous study, we measured temporal contrast sensitivity for luminance stimuli (Schütz et al., Reference Schütz, Delipetkos, Braun, Kerzel and Gegenfurtner2007). Although the major finding was an overall reduction of sensitivity during smooth pursuit and an additional reduction for motion opposite to pursuit, there was also a nonsignificant trend for a shift to higher temporal frequencies during pursuit. Another effect, which might be related to the temporal changes of luminance processing, is the selectively reduced extent of perceived motion smear during smooth pursuit for motion in the opposite direction (Bedell & Lott, Reference Bedell and Lott1996; Tong et al., Reference Tong, Patel and Bedell2005, Reference Tong, Aydin and Bedell2007). As such, a suppression of motion smear also occurs during passive eye movements, and it has been concluded that the effect is at least partially caused by proprioceptive signals (Tong et al., Reference Tong, Stevenson and Bedell2008). Interestingly, such a proprioceptive feedback signal has been found recently in the somatosensory cortex (Wang et al., Reference Wang, Zhang, Cohen and Goldberg2007).
During saccadic eye movements, sensitivity for low–spatial frequency luminance stimuli is suppressed, whereas sensitivity for color and high–spatial frequency luminance stimuli is unaffected (Ross et al., Reference Ross, Burr and Morrone1996, Reference Ross, Morrone, Goldberg and Burr2001). This suppression scales with the amplitude of saccades (Mitrani et al., Reference Mitrani, Yakimoff and Mateeff1970; Stevenson et al., Reference Stevenson, Volkmann, Kelly and Riggs1986; Ridder & Tomlinson, Reference Ridder and Tomlinson1997) and is triggered by an extraretinal signal (Diamond et al., Reference Diamond, Ross and Morrone2000) and has been associated with a selective suppression of the magnocellular pathway (Burr et al., Reference Burr, Morrone and Ross1994; Uchikawa & Sato, Reference Uchikawa and Sato1995). The suppression is further accompanied by an acceleration of the TIRF for luminance stimuli but not for chromatic stimuli (Burr & Morrone, Reference Burr and Morrone1996). Burr and Morrone Reference Burr and Morrone1996 explained the speeding up of the TIRF by a reduced contrast gain in magnocellular neurons. It has been shown that a reduction of contrast gain is strongest at low temporal frequencies for magnocellular neurons (Benardete et al., Reference Benardete, Kaplan and Knight1992), which might result in a speeding up of the TIRF. Consistent with that explanation, the impulse response of magnocellular neurons speeds up during saccades, albeit the response magnitude was only weakly suppressed (Reppas et al., Reference Reppas, Usrey and Reid2002).
Experiment 2: Spatial contrast sensitivity function for luminance
As noted above, there are several reports that luminance processing is affected by smooth pursuit eye movements. Bedell et al. showed that the extent of perceived motion smear is reduced during smooth pursuit for all motion with a directional component opposite to pursuit (Bedell & Lott, Reference Bedell and Lott1996; Tong et al., Reference Tong, Patel and Bedell2005, Reference Tong, Aydin and Bedell2007). They also reported that the TIRF is speeded up during smooth pursuit (Bedell et al., Reference Bedell, Ramamurthy, Patel and Vu-Yu2003) and that this effect is stronger for stimuli moving against the pursuit direction (Tong et al., Reference Tong, Patel and Bedell2006). In line with these asymmetries, we found a reduction of temporal contrast sensitivity for motion against pursuit (Schütz et al., Reference Schütz, Delipetkos, Braun, Kerzel and Gegenfurtner2007). Moreover, we found a slight suppression of luminance sensitivity in the periphery for 1 cpd Gabor stimuli (Schütz et al., Reference Schütz, Delipetkos, Braun, Kerzel and Gegenfurtner2007) and for a line stimulus, consisting of low spatial frequencies (Schütz et al., Reference Schütz, Braun, Kerzel and Gegenfurtner2008). Interestingly, sensitivity can also be improved by smooth pursuit not only for color stimuli but also for high–spatial frequency luminance stimuli (Schütz et al., Reference Schütz, Braun, Kerzel and Gegenfurtner2008). In all these experiments, luminance sensitivity was only measured at single spatial frequencies. To get a more complete picture about the sensitivity changes during smooth pursuit, we measured the spatial contrast sensitivity function (SCSF) for luminance over a wide range of spatial frequencies. We did not measure the SCSF for color because color sensitivity is strongly affected by chromatic aberration at medium and high spatial frequencies (Flitcroft, Reference Flitcroft1989; Marimont & Wandell, Reference Marimont and Wandell1994).
Materials and methods
If not otherwise stated, methods are the same as in Experiment 1.
Design
We estimated the SCSF for two different types of stimuli: Gabors with a fixed aperture size (FSG) and Gabors with a fixed number of sinusoid cycles (FCG). Both types are standard psychophysical stimuli, included in the ModelFest data set (Watson & Ahumada, Reference Watson and Ahumada2005). For the FSG, we measured contrast sensitivity for 12 spatial frequencies: 0.2, 0.3, 0.5, 0.7, 1.0, 1.5, 2.0, 3.0, 4.0, 5.0, 6.0, and 7.0 cpd. For the FCG, we measured contrast sensitivity for eight spatial frequencies: 0.7, 1.0, 1.5, 2.0, 3.0, 4.0, 5.0, and 6.0 cpd. Like in Experiment 1, we compared sensitivity during fixation and smooth pursuit. Subjects performed the experiment in several sessions. In each session, sensitivity for one spatial frequency and one Gabor type was measured interleaved during fixation and pursuit.
Subjects
One of the authors (A.C.S.) completed the experiment for both the FSG and the FCG. The naïve subject from Experiment 1 (HO) participated in the FSG experimental condition, and one new naïve subject (AE) participated in the FCG experimental condition. The new naïve subject was a female student of the Justus-Liebig University who was paid for her participation.
Visual stimuli
We used Gabor patches as detection targets. For the FSG, the Gaussian s.d. was set to 1 deg. For the FCG, the Gaussian s.d. was set to 4/spatial frequency. Hence, both types of stimuli were identical for a spatial frequency of 4 cpd. The phase of the Gabor was randomized in each trial. In general, it was not possible to create patches with spatial frequencies above 7 cpd because too few pixels would have been available to create a sinusoidal modulation, so that the pattern would have approximated a square wave pattern. With the FSG, it was also not possible to test spatial frequencies below 0.2 because otherwise only a very small part of one sinusoid cycle would have been present within the aperture. With the FCG Gabor, it was not possible to test spatial frequencies below 0.7 cpd due to limitations of our setup. To avoid any retinal image motion of the stimulus, we aligned the sinusoid of the Gabor horizontally and flashed the Gabor for one refresh cycle of the monitor.
Experimental procedure
We used a 2IFC procedure to measure contrast thresholds. We used the same bull’s-eye as fixation respective pursuit target as in Experiment 1. Each interval followed the same eye movement protocol as in Experiment 1. Hence, a fixation interval lasted 1500 ms, and the Gabor was presented after 1000 ms. A pursuit interval lasted 2000 ms, and the Gabor was presented 1500 ms after interval onset when the pursuit target reached the screen center. The two intervals were always exactly the same except that a Gabor was presented only in one interval. Each interval had to be started via button press of the subject, which activated the drift correction of the eye tracker. As we wanted to measure foveal sensitivity, we presented the Gabor patches at the screen center superimposed by the pursuit respective fixation target. After two intervals, subjects had to indicate which interval contained a Gabor patch.
Psychophysical data analysis
We estimated contrast thresholds like in Experiment 1. To fit the SCSF, we used nine different functions that have been used previously (Watson & Ahumada, Reference Watson and Ahumada2005). We used again the relative probabilities of the AIC and BIC to determine which function fits the data best (eqn. 4).
Results
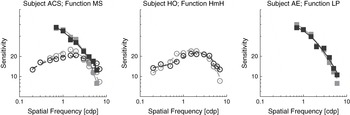
In this experiment, we measured luminance sensitivity for Gabor stimuli flashed at the fovea. In the first step, we fitted different contrast sensitivity functions to our data (Watson & Ahumada, Reference Watson and Ahumada2005). In the FSG condition, all functions but HPmG could fit the data reasonably well, as indicated by RMSEs below 2. In the FCG condition, DoG, HmG, and HmH showed larger errors than the other functions. We used again the relative probability of the AIC and BIC to select the best fitting function (Supplemental Figures 1 and 2; Supplemental Tables 2 and 3) to account for the different number of free parameters of the functions. For subject A.C.S., function MS had the highest relative probability in the FSG condition (AIC: 0.34; BIC: 0.30) and in the FCG condition (AIC and BIC: 0.61). For subject HO, function HmH fitted the data best in terms of the relative probability of AIC (0.30) and BIC (0.27). Function LP fitted the data best for subject AE (AIC and BIC: 0.84). All the superior functions had four free parameters.
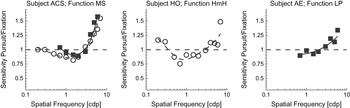
As can be seen from Fig. 5, there was a strong difference between the FSG and the FCG conditions. Whereas the FSG function shows a bandpass characteristic, the FCG data follow a low-pass characteristic. The low-pass shape of the FCG is consistent with previous reports of SCSF for brief flashes (Kelly, Reference Kelly1977). The attenuation at low spatial frequencies in the FSG function is probably caused by the reduced number of visible cycles of the sinusoid (Hoekstra et al., Reference Hoekstra, van der Goot, van den Brink and Bilsen1974; Savoy & McCann, Reference Savoy and McCann1975; Howell, Reference Howell1978). Despite these large differences between the Gabor types, the pursuit-induced sensitivity modulations were quite similar for both types of Gabors, as can be seen from Fig. 6.
Experiment 2: Luminance contrast sensitivity and the fitted functions. The three columns show the data for three subjects. Data for fixation are plotted in gray; data for pursuit are plotted in black. Open circles and dashed lines show data for FSG; filled squares and continuous lines show data for FCG. Markers denote measured sensitivities; the lines represent the fitted function MS for subject A.C.S., function HmH for subject HO, and function LP for subject AE.

Experiment 2: Luminance sensitivity ratio between fixation and pursuit. The three columns show the data for three subjects. Open circles and dashed lines show data for FSG; filled squares and continuous lines show data for FCG. Markers represent measured sensitivity ratios. The lines represent the fitted sensitivity ratio based on the function MS for subject A.C.S., function HmH for subject HO, and function LP for subject AE. The dashed horizontal line indicates points with equal sensitivity during fixation and pursuit.

Next, we looked at the sensitivity differences between pursuit and fixation (Fig. 6). For subject A.C.S., sensitivity was higher during smooth pursuit for spatial frequencies above 3 cpd for both the FSG and the FCG conditions. Below 3 cpd, sensitivity was lower during pursuit and also consistent in both conditions. However, sensitivities were equal for spatial frequencies below 0.5 cpd in the FSG condition and below 1 cpd in the FCG condition. For subject HO, in the FSG condition, the picture was similar except that sensitivity during pursuit was higher than during fixation for spatial frequencies below 0.5 cpd. Subject AE, in the FCG condition, showed a higher sensitivity during pursuit for spatial frequencies above 2 cpd and a lower sensitivity for spatial frequencies below 2 cpd. The maximal increase of sensitivity during pursuit was observable at the highest measured spatial frequency of 7 cpd for all subjects. The maximum decrease of sensitivity was measured at 1.5 cpd for subject A.C.S. in the FSG condition and at 2 cpd in the FCG condition. For subject HO, the peak decrease occurred at 0.7 cpd and for subject AE at 1.5 cpd.
Discussion
We measured the SCSF for luminance during pursuit and fixation. During pursuit, contrast sensitivity was consistently improved for spatial frequencies above 3 cpd and reduced for intermediate spatial frequencies for all subjects and for both the FSG and the FCG conditions. For low spatial frequencies, there was no consistent pattern across subjects and conditions. For subject A.C.S., there was no sensitivity difference between fixation and pursuit for low spatial frequencies. Subject HO, in the FSG condition, showed a higher sensitivity during pursuit at low spatial frequencies, whereas subject AE showed in the FCG condition a lower sensitivity during pursuit at low spatial frequencies. Hence, there seems to be no clear-cut influence of smooth pursuit on low spatial frequencies.
Previously, we found a suppression of luminance sensitivity for low spatial frequencies only in the periphery but not in the fovea (Schütz et al., Reference Schütz, Delipetkos, Braun, Kerzel and Gegenfurtner2007, Reference Schütz, Braun, Kerzel and Gegenfurtner2008). In these previous experiments, we used a horizontal line that was modulated vertically by a Gaussian distribution with an s.d. of 0.5 deg. In the frequency domain, this stimulus is a Gaussian with an s.d. of 1.06 cpd. Hence, most of the energy of this stimulus was in a frequency range for which we did not find a clear suppression in the current study. Therefore, the previous finding that low–spatial frequency luminance sensitivity in the fovea is not suppressed during pursuit is consistent with the findings of the present experiment. Several factors might explain why the same stimulus presented in the periphery is slightly suppressed during pursuit: (i) retinal inhomogeneities, (ii) surround suppression in the periphery, and (iii) spatial attention shifts. One of the most important properties of the human visual system is inhomogeneity across the visual field. It is known that the sampling density of photoreceptors and retinal ganglion cells drops with distance to the fovea. This influences the limits of visual acuity (Merigan & Katz, Reference Merigan and Katz1990) and the SCSF (Kelly, Reference Kelly1984), which shifts to lower spatial frequencies at the periphery. It might be possible that the cutoff frequency for suppression versus enhancement during pursuit also changes across the retina. Foveal and peripheral processing also differs in respect to surround suppression effects. These effects are strongest for magnocellular neurons (Solomon et al., Reference Solomon, White and Martin2002) and are much weaker at the fovea (Xing & Heeger, Reference Xing and Heeger2000). Although we used uniform gray backgrounds in our experiments, the screen border moved on the retina during smooth pursuit, which might suppress peripheral luminance sensitivity. Another qualitative difference between foveal and peripheral processing is related to spatial attention. The premotor theory of attention (Rizzolatti et al., Reference Rizzolatti, Riggio, Dascola and Umilta1987) assumes that there is an obligatory link between covert and overt attention shifts. In that way, attention should be bounded to the foveal pursuit target during the execution of smooth pursuit. Indeed, several studies reported interference between pursuit and spatial attention shifts for steady-state pursuit (Khurana & Kowler, Reference Khurana and Kowler1987; Hutton & Tegally, Reference Hutton and Tegally2005; Kerzel & Ziegler, Reference Kerzel and Ziegler2005; Kerzel et al., Reference Kerzel, Souto and Ziegler2008). Hence, the binding of spatial attention to the pursuit target might reduce peripheral contrast sensitivity.
There is good evidence that the TIRF for luminance is speeded up during smooth pursuit (Bedell et al., Reference Bedell, Ramamurthy, Patel and Vu-Yu2003; Tong et al., Reference Tong, Patel and Bedell2006). One may ask if the observed changes of the SCSF are related to the faster temporal impulse response during smooth pursuit. As spatial and temporal contrast sensitivities are only separable for high temporal or spatial frequencies (Koenderink & Doorn, Reference Koenderink and Doorn1979), one has to assume that any change in spatial contrast sensitivity affects temporal contrast sensitivity and vice versa. To disentangle these two factors, one would have to measure the whole 2D spatio-temporal surface during fixation and pursuit.
It is known that the human SCSF is the envelope of multiple spatial frequency channels (Campbell & Robson, Reference Campbell and Robson1968; De Valois & De Valois, Reference De Valois and De Valois1988). Independent spatial frequency channels have been observed even for second-order stimuli (Landy & Oruc, Reference Landy and Oruc2002). An open question is still how the SCSF for luminance reflects the sensitivity of the parvo- and magnocellular pathways. Several studies tried to identify at which spatial frequencies one pathway dominates the other. These studies used different methods and ended up with different estimations of the transition. By comparing contrast sensitivity for flicker and pattern detection, the transition between sustained and transient channels has been inferred between 3 and 5 cpd (King-Smith & Kulikowski, Reference King-Smith and Kulikowski1975). Legge (Reference Legge1978) observed quantitative differences of pattern masking below and above 1.5 cpd and interpreted this also in terms of sustained and transient channels. A similar transition between 1 and 2 cpd was obtained by Burbeck and Kelly (Reference Burbeck and Kelly1981). Using a discrimination task in pulsed- and steady-pedestal paradigms, a transition between inferred parvo- and magnocellular pathways has been determined at 4 cpd (Leonova et al., Reference Leonova, Pokorny and Smith2003). Besides psychophysical measurements, attempts have been made to associate magno- and parvocellular activity with differential electroencephalography (EEG) activity (Baseler & Sutter, Reference Baseler and Sutter1997; Arakawa et al., Reference Arakawa, Tobimatsu, Tomoda, Kira and Kato1999; Ellemberg et al., Reference Ellemberg, Hammarrenger, Lepore, Roy and Guillemot2001). Measurements of the contrast dependency of visual evoked potentials at different spatial frequencies suggest that the magno- and parvo parvocellular pathways both contribute at intermediate spatial frequencies (Ellemberg et al., Reference Ellemberg, Hammarrenger, Lepore, Roy and Guillemot2001).
Physiological studies showed that parvocellular lesions impair sensitivity for high spatial and low temporal frequencies (Merigan & Eskin, Reference Merigan and Eskin1986; Merigan, Reference Merigan1989; Merigan et al., Reference Merigan, Katz and Maunsell1991), whereas magnocellular lesions cause mainly deficits for high temporal frequencies (Merigan & Maunsell, Reference Merigan and Maunsell1990; Merigan et al., Reference Merigan, Katz and Maunsell1991). However, single-cell recordings of magno- and parvocellular neurons showed that the spatial and temporal resolution of individual neurons can be much higher than the perceptual resolution (Derrington & Lennie, Reference Derrington and Lennie1984).
To conclude, sensitivity at high spatial frequencies seems to depend on parvocellular activity and at low spatial frequencies on magnocellular activity, and both pathways are probably involved at medium spatial frequencies. Hence, our finding of an increased sensitivity during pursuit for spatial frequencies above 3 cpd would be compatible with increased parvocellular sensitivity during pursuit. The suppression at intermediate spatial frequencies might result from the noise introduced by an enhanced parvocellular activity, which is not optimal for these spatial frequencies.
General discussion
In two experiments, we investigated the temporal and spatial characteristics of the sensitivity enhancement observed during smooth pursuit. In Experiment 1, we showed that the chromatic TIRF differs between fixation and pursuit mostly in respect to the gain but hardly in respect to the natural temporal frequency. Thus, the sensitivity enhancement for color is present at all temporal frequencies. In Experiment 2, we showed that luminance sensitivity is enhanced for spatial frequencies above 2–3 cpd and suppressed for intermediate spatial frequencies between 0.5 and 3 cpd. Below 0.5 cpd, no consistent pattern was observed.
During saccades, sensitivity is selectively reduced for low–spatial frequency luminance stimuli (Burr et al., Reference Burr, Holt, Johnstone and Ross1982, Reference Burr, Morrone and Ross1994). Depending on the illuminance level, spatial frequencies below 1.5 cpd or below 0.2 cpd are suppressed. Based on the psychophysical results, it has been concluded that saccadic suppression most probably takes place at the magnocellular neurons in the LGN (Burr et al., Reference Burr, Morrone and Ross1994). However, physiological studies found strong suppression of neural activity only in extrastriate areas MT and MST (Thiele et al., Reference Thiele, Henning, Kubischik and Hoffmann2002; Ibbotson et al., Reference Ibbotson, Price, Crowder, Ono and Mustari2007) and in superficial layers of the SC (Robinson & Wurtz, Reference Robinson and Wurtz1976), whereas suppression in LGN (Reppas et al., Reference Reppas, Usrey and Reid2002; Royal et al., Reference Royal, Sary, Schall and Casagrande2006) or V1 (Wurtz, Reference Wurtz1969a,Reference Wurtzb) was not present or rather weak. Hence, it might be that the sensitivity loss during saccades does not take place in the retino-geniculate-cortical pathway but rather in the SC-pulvinar-cortical pathway (see Wurtz, Reference Wurtz2008, for a review). This example shows that psychophysical results have to be interpreted cautiously in respect to the underlying neural mechanisms. However, if one assumes that the observed changes of chromatic sensitivity and luminance sensitivity for high spatial frequencies are mediated by the same neural structure, it is quite unlikely that the SC-pulvinar-cortical pathway is involved because neurons in the superficial layers of the SC do not receive inputs from color-opponent cells (Schiller & Malpeli, Reference Schiller and Malpeli1977; Schiller et al., Reference Schiller, Malpeli and Schein1979) and do not respond to isoluminant stimuli (Marrocco & Li, Reference Marrocco and Li1977). However recently color-related activity has been found for neurons in the intermediate layers of the SC (White et al., Reference White, Boehnke, Marino, Itti and Munoz2008).
If one assumes that the visual system actively changes neuronal properties to achieve the observed sensitivity changes, the aim of these changes is still unclear. Several properties and consequences of smooth pursuit might give the reasons for the sensitivity modulations: First, they might be related to the recognition of the tracked object. An increase of sensitivity for color and high spatial frequencies should facilitate the recognition of the tracked object. Second, the sensitivity modulations might aim at a facilitation of the perception of the stationary background. During smooth pursuit, all stationary objects move on the retina, which increases the temporal frequency of these objects and hampers perception by introducing motion blur (Burr, Reference Burr1980). However, a clear perception of the stationary context is important during smooth pursuit because pursuit can be executed for a relatively long time. It is known that the TCSF has a low-pass shape for color and high–spatial frequency luminance patterns (if the pattern is presented for longer durations). Hence, the sensitivity for these types of stimuli would suffer in particular from the retinal motion. The reported sensitivity enhancement might counteract these detrimental effects of retinal motion. This view is supported by the finding that chromatic sensitivity is also enhanced during optokinetic nystagmus (OKN) but not during visually enhanced active vestibulo-ocular reflex (Schütz et al., Reference Schütz, Braun and Gegenfurtner2009). Although both types of eye movements can result in the same eye-in-head motion as pursuit, only OKN causes a similar retinal motion. Third, the sensitivity modulations might reflect a modification of motion processing to the needs during pursuit. Smooth pursuit essentially stabilizes the tracked object on the retina so that only small residual retinal velocities are present. To improve the tracking performance, it might be beneficial to increase sensitivity for small velocities. Psychophysical and physiological evidence suggests that there are at least two motion mechanisms: one mechanism that encodes primarily color contrasts and slow velocities and another mechanism that encodes primarily luminance contrasts and fast velocities (Gegenfurtner & Hawken, Reference Gegenfurtner and Hawken1995, Reference Gegenfurtner and Hawken1996). It is known that the perceived speed is underestimated for isoluminant colored targets (Cavanagh et al., Reference Cavanagh, Tyler and Favreau1984). Interestingly, we found that this underestimation happens only during fixation but not during steady-state pursuit (Braun et al., Reference Braun, Mennie, Rasche, Schutz, Hawken and Gegenfurtner2008). In this view, the improved sensitivity for color and fine spatial details would be a side effect of a stronger weighting of the slow color motion mechanism during smooth pursuit.
Acknowledgments
This work was supported by the DFG Forschergruppe FOR 560 “Perception and Action.” We thank Harold Bedell for helpful discussion, Kurt Debono for help with improving the English, Elisabeth Baumgartner for help with data collection, and subjects HO and AE for participation in the lengthy experiments.