Introduction
The ixiolite group is one of the oxide groups affiliated to the columbite supergroup with a general MO2 stoichiometry. Its crystal structure is based on hexagonal close-packed anions, a six-fold coordination of M-type cations, and zig-zag chains of edge-sharing M-centred polyhedra (Chukanov et al., Reference Chukanov, Pasero, Aksenov, Britvin, Zubkova, Yike and Witzke2023b). Ixiolite group members are characterised by a Pbcn space-group symmetry with the complete disorder of cations and unit-cell parameters a, b, c in the ranges 4.1–5.0 Å, 5.0–5.8 Å, and 4.5–5.5 Å, respectively. This distinguishes them from the wolframite-group minerals. The latter are monoclinic, pseudo-orthorhombic (space groups P2/c or P2/b), with almost identical unit-cell parameters, and cations ordered at two M sites. Members of other mineral groups belonging to the columbite supergroup (columbite, wodginite, and an ungrouped species: lithiotantite) are characterised by different schemes of cation ordering and several times larger unit-cell parameters than those of ixiolite.
Currently, the ixiolite group includes the following mineral species: ixiolite-(Fe2+) – ideally (Ta0.67Fe2+0.33)O2 (Nickel et al., Reference Nickel, Rowland and McAdam1963), ixiolite-(Mn2+) – (Ta0.67Mn2+0.33)O2 (Grice et al., Reference Grice, Ferguson and Hawthorne1976), srilankite – TiO2 (Willgallis et al., Reference Willgallis, Siegmann and Hettiaratchi1983), scrutinyite – α-PbO2 (Taggart et al., Reference Taggart, Foord, Rosenzweig and Hanson1988), seifertite – SiO2 (El Gorsey et al., Reference El Goresy, Dera, Sharp and Hemley2008), nioboixiolite-(Mn2+) – (Nb0.67Mn2+0.33)O2 (Chukanov et al., Reference Chukanov, Pekov, Zubkova, Yapaskurt, Shelukhina, Britvin and Pushcharovsky2023a), nioboixiolite-(□) – (Nb0.80□0.20)O2 (Li et al., Reference Li, Ke, Wang, Peng, Zhao, Li, Chen, Li, Yu, Zhang, Guo and Gao2025), nioboixiolite-(Fe3+) – (Nb0.50Fe3+0.50)O2 (Chukanov et al., Reference Chukanov, Zubkova, Pekov, Kasatkin, Agakhanov, Virus, Vigasina, Ternes, Schüller and Britvin2025), ixiolite-(Sc) – (Ta050Sc0.50)O2 (Taddei et al., Reference Taddei, Holtstam, Kristiansen and Bindi2026), and nioboixiolite-(Fe2+) – (Nb0.67Fe2+0.33)O2 (Zelek-Pogudz et al., Reference Zelek-Pogudz, Gołębiowska, Rutkowski, Nejbert, Stadnicka and Pieczka2025). Nioboixiolite-(Fe2+), together with its name and symbol (Nbix-Fe2+), were approved by the IMA Commission on New Minerals, Nomenclature and Classification in 2025 (under proposal 2025-016).
The holotype and co-type (specimens J126 and J124) are stored at the Mineralogical Museum of the University of Wrocław under catalogue numbers MMUWr IV8117 and MMUWr IV8119 (University of Wrocław, Faculty of Earth Sciences and Environmental Management, Institute of Geological Sciences, Mineralogical Museum, 50-205 Wrocław, Cybulskiego 30, Poland). According to the classification by Strunz and Nickel (Reference Strunz and Nickel2001), nioboixiolite-(Fe2+) belongs to Class 04.DB, which includes oxides with a metal-to-oxygen ratio of 1:2 and similar compositions, with medium-sized cations arranged in chains of edge-sharing octahedra. According to Dana’s classification (Gaines et al., Reference Gaines, Skinner, Foord, Mason and Rosenzweig1997), nioboixiolite-(Fe2+) belongs to class 08: Multiple Oxides with Nb, Ta, and Ti, specifically 08.01.10 Ixiolite.
All results presented herein are based exclusively on analyses performed on the holotype specimen. The cotype specimen was not examined in detail and was recognized solely from chemical-composition data.
Occurrence
Nioboixiolite-(Fe2+) was found in granite pegmatite rock, in a sample collected in 2022 by one of the authors (A.P.), which had been intruded into rodingitized calc-silicate and serpentinite rocks exposed in a quarry located ∼1 km west of the village of Jordanów Śląski, 30 km to the south of Wrocław, Lower Silesia, SW Poland (50.87111°N, 16.83833°E), in the eastern part of the Gogołów–Jordanów Serpentinite Massif. This massif is an ultramafic part of the Variscan Ślęża Ophiolite in the northeastern periphery of the Bohemian Massif in the European Variscides. The Ślęża Ophiolite is part of the ∼400 Ma assemblage of Central Sudetic ophiolites, formed in a supra-subduction setting during the amalgamation of Pangea (e.g. Dubińska et al., Reference Dubińska, Bylina, Kozłowski, Dörr, Nejbert, Schastok and Kulicki2004; Kryza and Pin, Reference Kryza and Pin2010; Awdankiewicz et al., Reference Awdankiewicz, Kryza, Turniak, Ovtcharova and Schaltegger2021; Wojtulek et al., Reference Wojtulek, Schulz, Klemd, Gil, Dajek and Delura2021). These serpentinites, together with the mafic members of the Ślęża Ophiolite exposed in the north and northwest, underwent regional metamorphism in greenschist to lower amphibolite facies.
In the quarry, serpentinite contains two steeply dipping bodies of calc-silicate rocks running approximately northeast-southwest, with widths of ∼20–25 m and ∼5 m, traditionally called ‘leucocratic zones’. These bodies are surrounded by discontinuous and tectonically disrupted blackwall schists with a thickness ranging from a few centimetres to about one metre, locally grading into nephritic rocks (Dubińska and Wiewióra, Reference Dubińska and Wiewióra1988; Dubińska and Szafranek, Reference Dubińska and Szafranek1990; Gil, Reference Gil2013; Gil et al., Reference Gil, Barnes, Boschi, Gunia, Szakmány, Bendõ, Raczynski and Péterdi2015, Reference Gil, Bagiński, Gunia, Madej, Sachanbiński, Jokubauskas and Belka2020). The rodingite bodies contain strongly metasomatized leucogranite, dated to ∼340 Ma (Kryza, Reference Kryza2011), as well as subordinate aplite–pegmatite of undetermined age, occurring as irregular segregations and veins, usually several centimetres thick, in fine-grained aplitic rocks (Waleńczak, Reference Waleńczak1969; Lis and Sylwestrzak, Reference Lis and Sylwestrzak1981). Locally, all of the rocks forming leucocratic zones and the adjacent serpentinites underwent mylonitization and/or brecciation and were then cemented by hydrothermal quartz (Dubińska, Reference Dubińska1995; Kryza, Reference Kryza2011).
The quarry had been inactive for over 40 years however, in 2022, serpentinite aggregate production resumed here. A substantial granite pegmatite vein was exposed along the outcrop of the albite–quartz–zoisite rock, several dozen metres long and up to several metres thick. In the vicinity of this rock, smaller pegmatite bodies, up to several metres long, were also found as tectonic inclusions in the adjacent serpentinite. In the past, this quarry was best-known for the first documented occurrence of nephrite in Europe (Traube, Reference Traube1885a, Reference Traube1885b). In recent years, scandium-bearing minerals have been discovered at the contact between pegmatite and serpentinite (Sc-bearing actinolite, Sc-bearing diopside, jervisite, cascandite, scandio-winchite, heflikite, dubińskaite, bazzite, kristiansenite and kolbeckite), as well as some other rare minerals, e.g. allanite-(Y), allanite-(Nd) and allanite-(Sm) (Pieczka et al., Reference Pieczka, Stachowicz, Zelek-Pogudz, Gołębiowska, Sęk, Nejbert, Kotowski, Marciniak-Maliszewska, Szuszkiewicz, Szełęg, Stadnicka and Woźniak2024a, Pieczka et al., Reference Pieczka, Kristiansen, Stachowicz, Dumańska-Słowik, Gołębiowska, Sęk, Nejbert, Kotowski, Marciniak-Maliszewska, Szuszkiewicz, Szełęg and Woźniak2024b, Pieczka et al., Reference Pieczka, Stachowicz, Zelek-Pogudz, Gołębiowska, Sęk, Nejbert, Kotowski, Marciniak-Maliszewska, Szuszkiewicz, Szełęg, Stadnicka and Woźniak2024c, Pieczka et al., Reference Pieczka, Gołębiowska, Włodek, Stachowicz, Jokubauskas, Kotowski, Nejbert, Szuszkiewicz and Woźniak2025; Stachowicz et al., Reference Stachowicz, Kotowski, Nejbert, Szuszkiewicz, Woźniak and Pieczka2024). This mineralisation makes the Jordanów Śląski quarry one of the most important occurrences of scandium minerals in the world, and the only one associated with a supra-subduction zone.
Appearance and physical properties
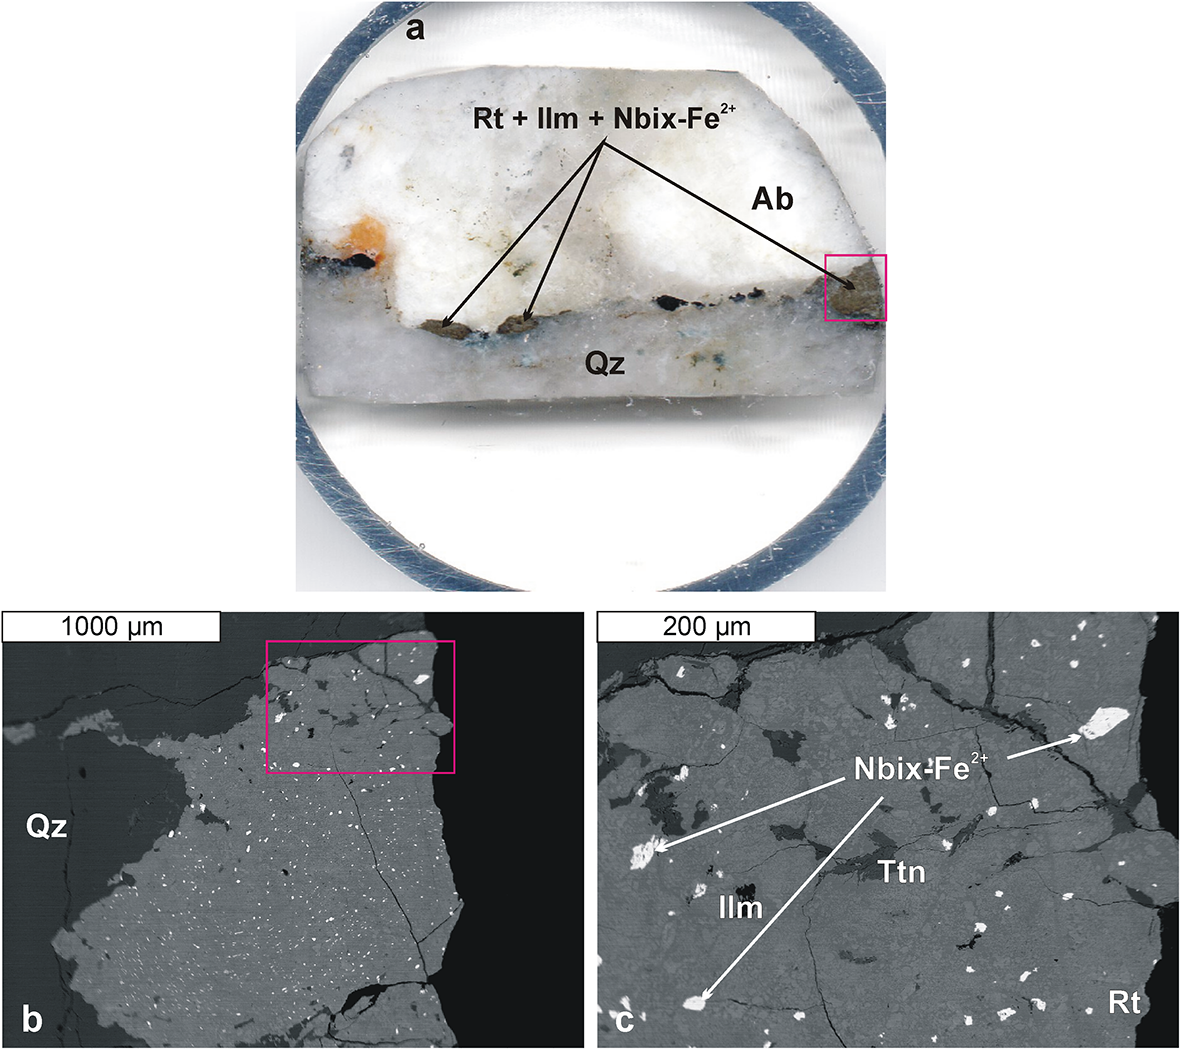
Nioboixiolite-(Fe2+) forms euhedral, prismatic crystals up to 50 μm in size, scattered in an aggregate of Ti,Nb-bearing mineralisation (Nb-bearing rutile, ilmenite, titanite, Ca,Pb-bearing hydropyrochlore) between quartz and albite, over a distance of ∼4 cm (Fig. 1). The mineral is opaque and not fluorescent, with a black streak, submetallic lustre, and an estimated Mohs hardness of ∼5, similar to other minerals in the ixiolite group. It is brittle, has uneven to conchoidal fracture surfaces, and shows no visible cleavage or partings. The density, calculated from the empirical formula and refined unit-cell volume, is 5.374 g·cm–3. In reflected light, nioboixiolite-(Fe2+) is grey, slightly darker than the adjacent Nb,Ta-bearing rutile. No pleochroism is observed. The reflectance is 16.8(5)–18.4(5)% and bireflectance is very weak (ΔR = 0.5–0.6%; 589 nm). The mineral shows weak anisotropy and no internal reflections.
(a) Rutile–ilmenite–titanite aggregates containing nioboixiolite-(Fe2+) in the holotype sample J126; the red rectangle marks the fragment shown in (b). (b) Back-scatter electron (BSE) image of the rutile–ilmenite–titanite–nioboixiolite-(Fe2+) aggregate; the red rectangle indicates the area enlarged in (c). (c) BSE image illustrating the mode of occurrence of nioboixiolite-(Fe2+) within the rutile–ilmenite–titanite aggregates. Symbols: Ab – albite, Ilm – ilmenite, Qz – quartz, Rt – rutile, Ttn – titanite (Warr, Reference Warr2021), Nbix-Fe2+ – nioboixiolite-(Fe2+).

Chemical composition
Determination of iron oxidation state
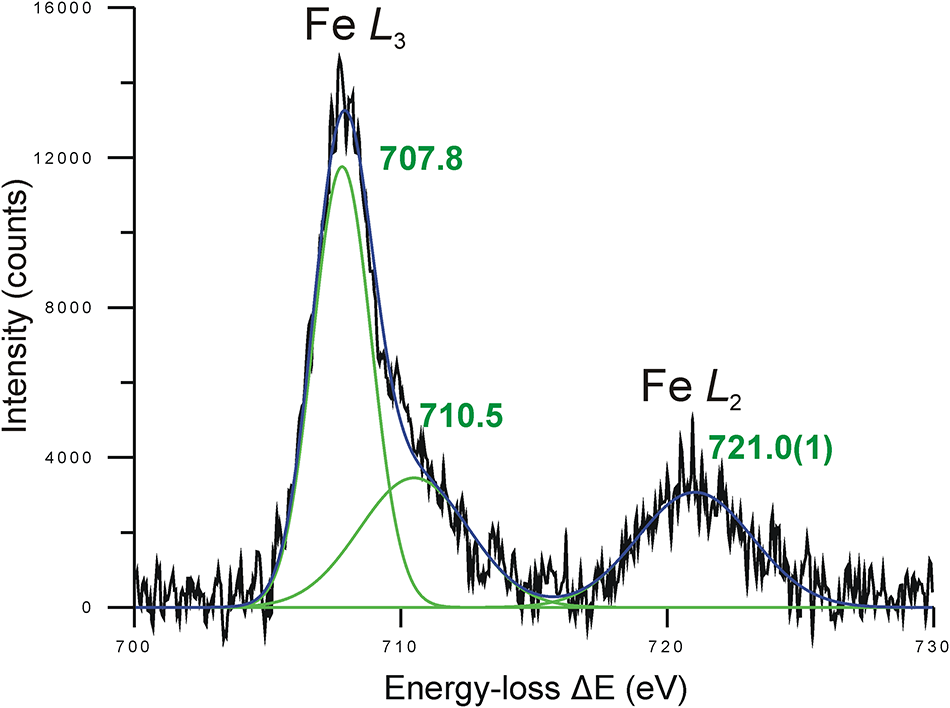
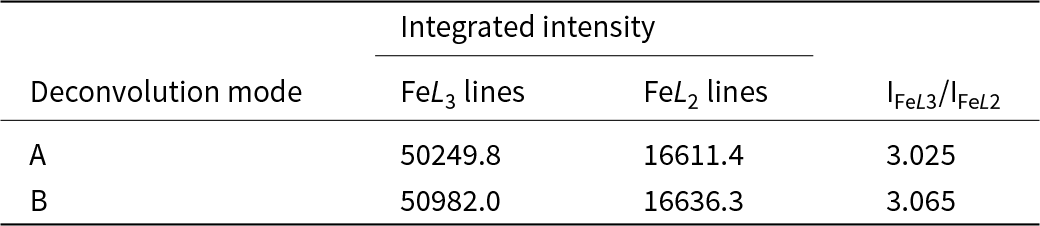
Among the many signals generated during interaction of the electron beam with the sample, the inelastically scattered electrons are used for Electron Energy-Loss Spectroscopy (EELS) (Egerton Reference Egerton2011). This signal is generated when high-energy incident electrons from the transmission electron microscope (TEM) transfer part of their energy to the atoms of the sample being investigated by knocking the inner shell electrons out, generating ionization edges. That kinetic energy loss, generated by the interaction with the sample, is unique for each element and can be measured, providing crucial information about the binding energy of the electrons. By investigating the shape of the ionization edges, an insight into the oxidation state of the elements present in the sample is gained. The degree of iron oxidation (Fe3+/Fetotal) in nioboixiolite-(Fe2+) was determined at the Faculty of Metals Engineering and Industrial Computer Science, AGH University of Krakow, with a Titan3 TEM (FEI) in scanning-transmission electron microscopy (STEM) mode, equipped with an imaging filter (Gatan). An acceleration voltage of 300 kV and a beam current of ∼150 pA were used. The EELS signal in the range of 650 to 752 eV was collected with an energy resolution of 0.8 eV. The acquisition area of a few um2 prevented overheating and irradiation damage of the sample. The integrated intensities of the Fe-L 2,3 lines were determined by deconvoluting this spectrum in the range of 700–730 eV using FITYK-1.3.1 software (Wojdyr, Reference Wojdyr2010) after subtracting the linear background. The spectrum was deconvoluted twice (cases A and B) with different constraints. In case A (Fig. 2), the FeL 3 line was deconvoluted into two components with centres set at 707.8 eV and 710.5 eV, corresponding to the Fe2+ ion. The height and half-widths at half maximum (HWHM) were not set. The relatively symmetrical FeL 2 line was fitted using free parameters. In case B, no restrictions were imposed on the position, height, and HWHM, so all these parameters were fitted freely. The fitted component lines in this case have spectral positions of 707.73(2) eV, 709.4(1) eV, and 721.04(5) eV. The first of the component lines corresponds almost perfectly to the sharp white Fe2+ L 3 line at ∼707.8 eV (van Aken et al., Reference van Aken, Liebscher and Styria1998), the second corresponds to the more intense Fe3+ L 3 edge line, while the third is intermediate between the FeL 2 edge line of 720.4 eV for Fe2+ and 722.6 eV for Fe3+ (Liao, Reference Liao2006), although closer to the Fe2+ position. Less intense lines at ∼710.5 eV (Fe2+) and 708.0 eV (Fe3+) at the FeL 3 edge (van Aken et al., Reference van Aken, Liebscher and Styria1998) are invisible, hidden under the main lines indicated above. The total intensities of the FeL 3 and FeL 2 edge lines are shown in Table 1. The calculated ratio I(FeL 3)/I(FeL 2) is almost identical in both versions of spectrum deconvolution: 3.025 for case A and 3.065 for case B. Therefore, we used the average value of I(FeL 3)/I(FeL 2) = 3.045 to determine the Fe3+/Fetotal ratio. The Fe3+/Fetotal ratio estimated based on the universal curve by van Aken et al. (Reference van Aken, Liebscher and Styria1998), which describes the covariance of the total white line intensity ratio I(L 3)/I(L 2) with respect to the concentration of trivalent iron Fe3+/Fetotal, is 0.306 (Fig. 2). This value was used to determine the formula of the nioboixiolite-(Fe2+) holotype.
Representative deconvolution of the Fe L2,3 edge. Colours: black – experimental spectrum, green – component lines, dark blue – fitted spectrum. The Fe L 3-edge component lines were constrained based on the data of van Aken et al. (Reference van Aken, Liebscher and Styria1998) for the Fe2+ cation.

Integrated intensities of the Fe-L 2,3 lines in the EELS spectrum of iron in nioboixiolite-(Fe2+)

Table 1 Long description
Integrated EELS intensities are reported for the iron Fe L3 and Fe L2 lines under two deconvolution modes, along with the Fe L3 to Fe L2 intensity ratio. In mode A, the Fe L3 integrated intensity is 50249.8, and the Fe L2 integrated intensity is 16611.4, giving a ratio of 3.025. In mode B, the Fe L3 integrated intensity is 50982.0, and the Fe L2 integrated intensity is 16636.3, giving a ratio of 3.065. Both modes yield very similar Fe L2 intensities, while mode B shows a modest increase in Fe L3 intensity compared with mode A. The higher ratio in mode B indicates a slightly stronger Fe L3 contribution relative to Fe L2 under that deconvolution approach. Differences may reflect the chosen deconvolution method rather than a change in the underlying sample.
Electron-probe microanalysis (EPMA)
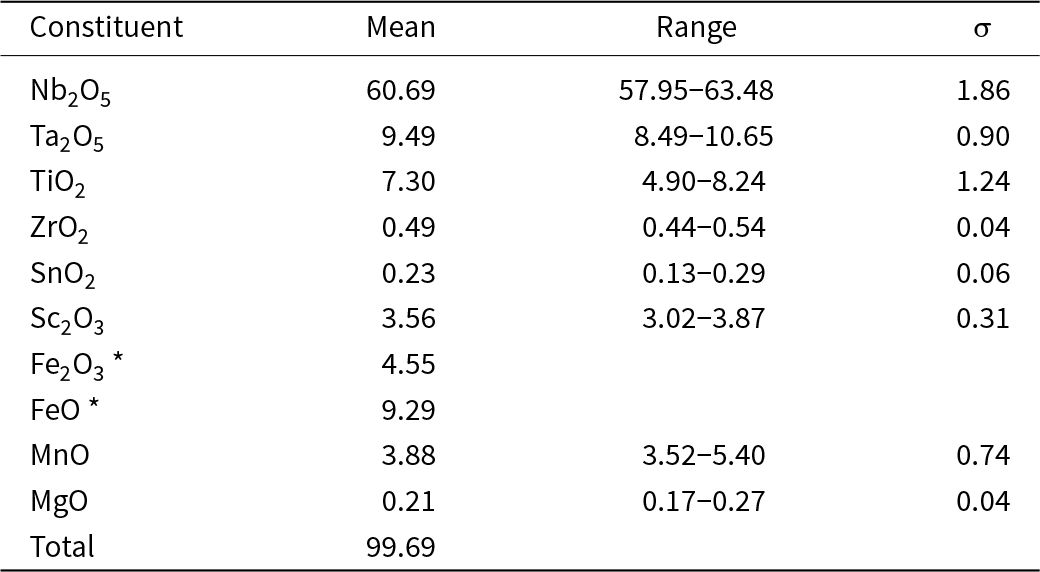
The samples were prepared as 1-inch disks containing small fragments of pegmatite with Ti-bearing mineralization from Jordanów Śląski, fixed in epoxy resin. Analyses were performed at the Inter-Institute Analytical Complex for Minerals and Synthetic Substances at the University of Warsaw, with a CAMECA SX 100 electron microprobe operating in wavelength-dispersive X-ray spectrometry mode at an accelerating voltage of 15 kV, a beam current of 20 nA, a beam size of 2 µm, and peak and background counting times of 20 and 10 s, respectively. Six-spot analyses were performed on three crystals larger than 20 μm, including one extracted for SCXRD. The following analytical reference materials, analytical lines, diffracting crystals, and mean detection limits (wt.% element) were used: diopside – Mg (Kα, TAP, 0.03); Sc pure – Sc (Kα, LPET, 0.03); rutile – Ti (Kα, LIF, 0.10); rhodonite – Mn (Kα, LIF, 0.12); hematite – Fe (Kα, LIF, 0.12); zircon – Zr (Lα, LPET, 0.04); LiNbO3 – Nb (Lα, LPET, 0.09); cassiterite – Sn (Lα, LPET, 0.08); LiTaO3 – Ta (Mα, TAP, 0.09); and scheelite – W (Mα, TAP, 0.12). The W amounts were below detection. The raw data were reduced with the PAP routine (Pouchou and Pichoir, Reference Pouchou, Pichoir, Heinrich and Newbury1991). Average analysis of nioboixiolite-(Fe2+) is presented in Table 2. The empirical structural formula of the nioboixiolite-(Fe2+) holotype, normalised to 2 O apfu and written in the form of cation groups of the same valence, is: [(Nb0.509Ta0.048)Σ0.557(Fe2+0.144Mn0.061Mg0.006)Σ0.211(Fe3+0.064Sc0.058)Σ0.121(Ti0.102Zr0.004Sn0.002)Σ0.108□0.003]Σ1.000O2.000. The formula is dominated by the end-member arrangement [(5+2/32+1/3)2–2] (63.3 mol.%), followed by the arrangements: [(5+1/23+1/2)2–2] (24.2 mol.%), [4+1/24+1/22–2] (10.8 mol.%), and [(5+4/50+1/5)2–2] (1.5 mol.%). The empirical formula suggests the simplified formula of nioboixiolite-(Fe2+) (Nb,Fe2+,Mn2+,Ti,Fe3+)O2 and an ideal end-member formula (Nb2/3Fe2+1/3)O2, which requires 78.72 wt.% Nb2O5 and 21.28 wt.% FeO (total 100 wt.%).
Chemical composition of nioboixiolite-(Fe2+)

Table 2 Long description
Chemical composition data are reported as mean values with ranges and standard deviations for major and minor oxide constituents in nioboixiolite-(Fe2+). Nb two O five is the largest component at a mean of 60.69 percent, ranging from 57.95 to 63.48, with a standard deviation of 1.86. Next highest measured means are Ta two O five at 9.49 percent (8.49 to 10.65; standard deviation 0.90) and TiO two at 7.30 percent (4.90 to 8.24; standard deviation 1.24). Iron is split into Fe two O three at 4.55 percent and FeO at 9.29 percent, and these iron values do not list ranges or standard deviations because they are derived from stoichiometry using an Fe three plus to total iron ratio from EELS. MnO averages 3.88 percent with the widest range among the listed oxides, from 3.52 to 5.40, and a standard deviation of 0.74. Minor constituents include Sc two O three at 3.56 percent (3.02 to 3.87), ZrO two at 0.49 percent, SnO two at 0.23 percent, and MgO at 0.21 percent, each with small variability. The reported total is 99.69 percent, indicating the analyses sum close to 100 percent.
Notes: * calculated from stoichiometry based on the Fe3+/Fetotal ratio from EELS.
Raman spectroscopy
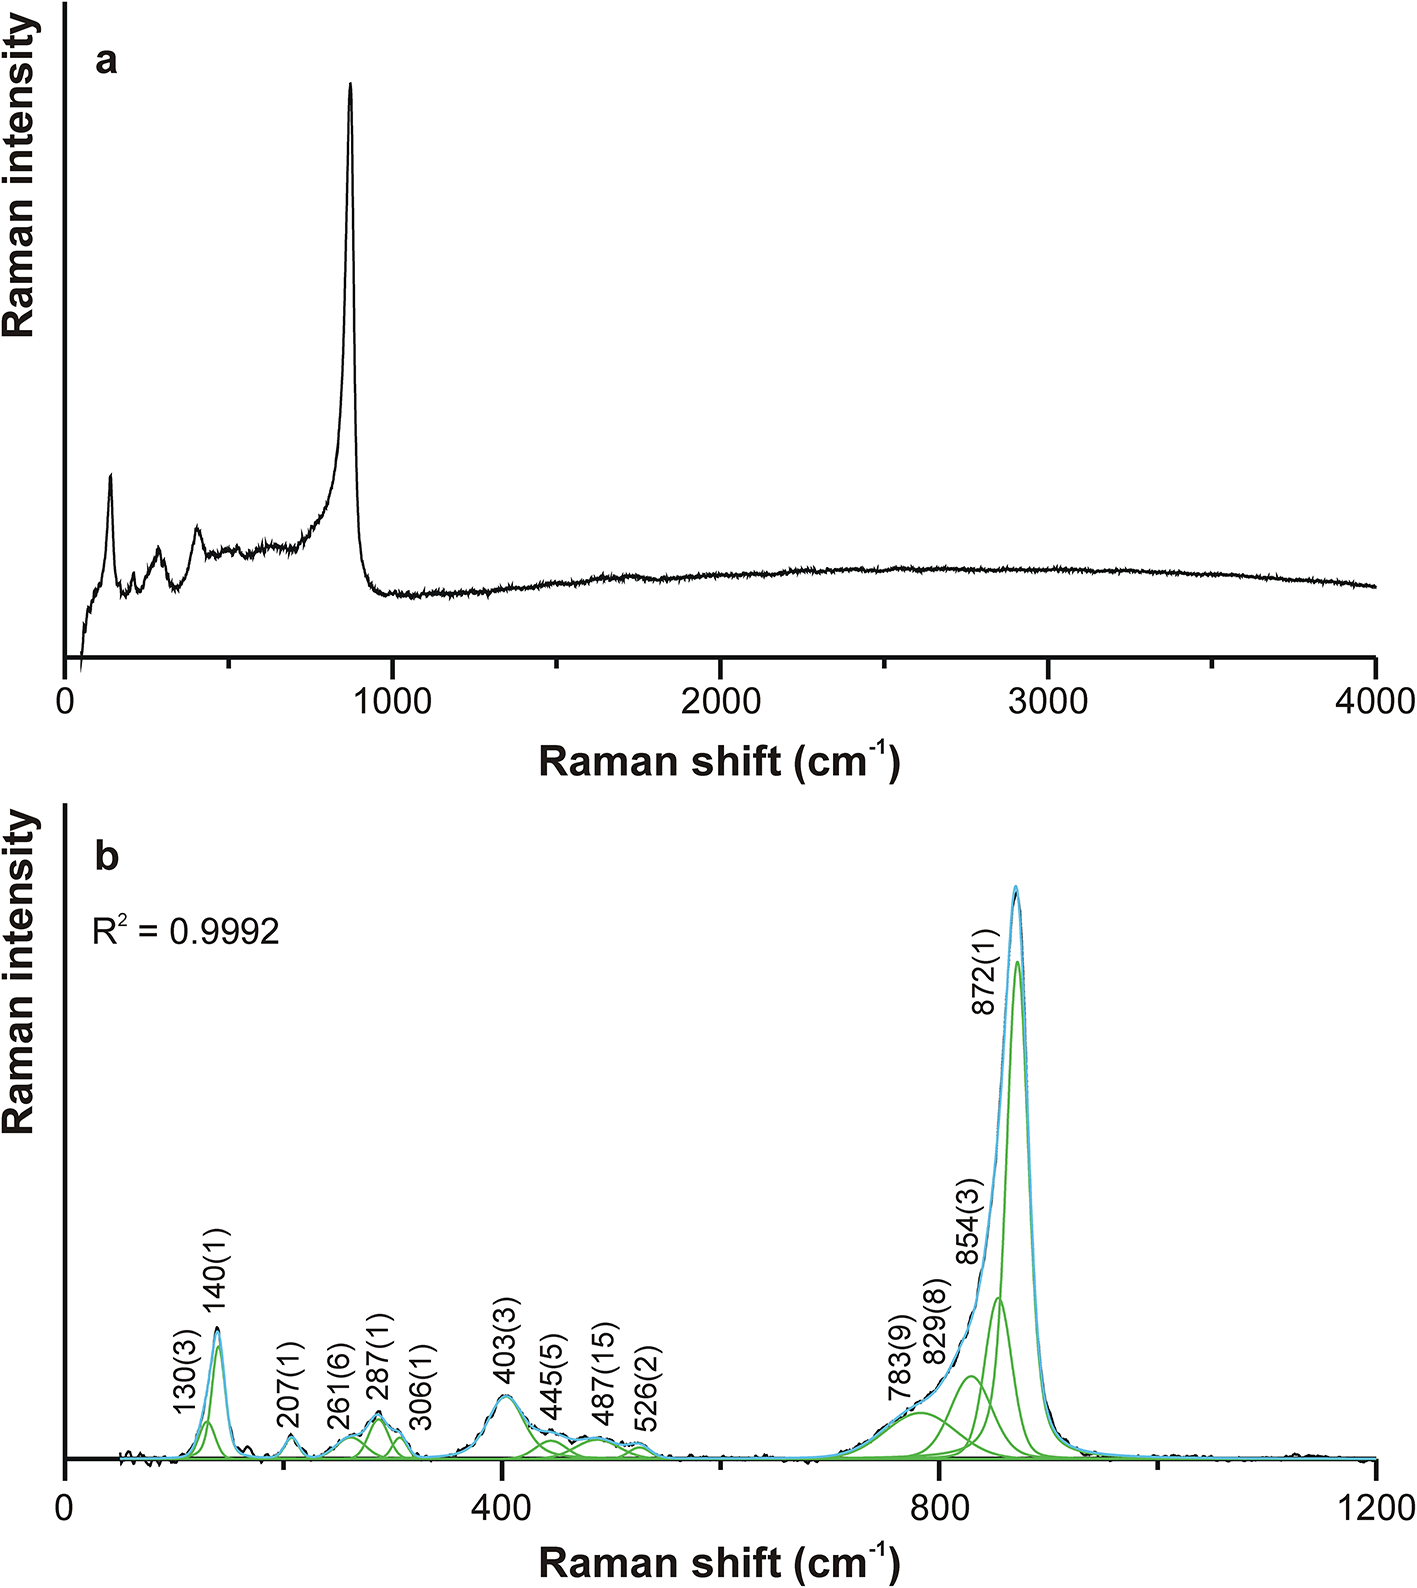
The Raman spectrum of nioboixiolite-(Fe2+) was collected at room temperature using back-scatter geometry via a Horiba Labram HR spectrometer, integrated with an Olympus BX 41 confocal microscope at the Faculty of Materials Science and Ceramics of the AGH University of Krakow. The system was calibrated using the Rayleigh line. The spectrum was recorded in the range 50–4000 cm–1 using a 532 nm Nd-YAG laser of 10 mW nominal power and an 1800 grating on a randomly orientated cross-section of a nioboixiolite-(Fe2+) crystal, which was present in the holotype sample J126. Raman measurements were performed by collecting three scans, each with an acquisition time of 600 s, at a microscope objective magnification of 100×, with a minimum lateral and depth resolution of ∼1 μm. Spectrum deconvolution was performed in the range 50–1200 cm–1 using FITYK-1.3.1 software (Wojdyr, Reference Wojdyr2010) after subtracting a linear background. The component bands were added to the fitting model using the auto-add-peak mode, in such a way as to minimise the difference between the empirical spectrum and the theoretical spectrum. The spectral position and intensity of the component bands were predicted based on the shape of the empirical spectrum (peak maxima, peak asymmetry, and peak shoulder inflections). The input model was fitted with the Gaussian function using the Levenberg-Marquardt fitting method.
The recorded raw spectrum of nioboixiolite-(Fe2+) in the Raman shift range of 50–4000 cm–1 and the deconvoluted spectrum in the range 50–1200 cm–1 are shown in Fig. 3a and 3b, respectively. The following bands have been distinguished for Raman shift values (cm–1; s – strong, m – medium, w – weak): 130(3) w, 140(1) m, 207(1) w, 261(6) w, 287(1) w, 306(1) w, 403(3) w, 445(5) w, 487(15) w, 526(2) w, 783(9), w, 829(8) m, 854(3) m, and 872(1) s. No bands were observed above 900 cm–1 that could indicate the presence of groups containing hydrogen, boron or carbon.
Raman spectrum of the nioboixiolite-(Fe2+) holotype: (a) raw spectrum in the Raman shift range of 50–4000 cm–1; (b) deconvolution of the spectrum in the 400–1200 cm–1 range. Line colours: black – experimental spectrum, green – component bands, blue – fitted spectrum.

Figure 3 Long description
Two stacked line plots labeled a and b. a. The y-axis label is Raman intensity. The x-axis label is Raman shift (cm superscript minus 1), ranging from 0 to 4000 with labeled ticks at 0, 1000, 2000, 3000 and 4000. The trace shows multiple small peaks between about 0 and 500, then a sharp tall peak just left of 1000. After that peak, the line drops and continues as a low, nearly flat trace from about 1000 to 4000. b. The y-axis label is Raman intensity. The x-axis label is Raman shift (cm superscript minus 1), ranging from 0 to 1200 with labeled ticks at 0, 400, 800 and 1200. Text near the upper left reads R superscript 2 equals 0.9992. A black spectrum line is overlaid with multiple narrow component peaks and a fitted curve. Labeled peak positions along the x-axis are 130, 140, 207, 261, 287, 306, 403, 445, 487, 526, 783, 829, 854 and 872. The tallest peak is at 872, with adjacent peaks at 854 and 829 and a smaller peak at 783. Smaller peaks appear at the labeled positions from 130 through 526.
Based on studies by Liao and Li (Reference Liao and Li2012), bands with Raman shifts below 250 cm−1 can be attributed to crystal lattice vibrations, mainly associated with cations. Bands in the range 250–450 cm–1 can be attributed to O–M–O bending vibrations, and bands with wavenumbers above 450 cm−1 can be attributed to several modes involving the M–O bond stretching. The strongest band, at 872(1) cm–1, probably originates from the stretching vibrations of the shortest Ti–O, Nb–O and Ta–O bonds, modified by vibrations of larger Fe3+–O, Fe2+–O and Mn2+–O bonds, which manifest themselves in corresponding component bands shifted towards lower energies and the clear asymmetry of the peak.
Crystallography
Single-crystal X-ray diffraction (SCXRD) and structure refinement
A small fragment of nioboixiolite-(Fe2+), measuring 46 × 24 × 14 μm, was extracted for SCXRD analysis at the Transmission Electron Microscopy Laboratory of the Academic Centre for Materials and Nanotechnology (AGH University of Krakow) using a Quanta 3D 200i scanning electron microscope (Thermo Fisher Scientific) equipped with a Ga+ ion gun, Pt precursor gas injection systems (GIS), and an Omniprobe micromanipulator (for in situ lift-out). An ion beam acceleration voltage of 30 kV and an ion current in the range of 60 nA – 1 nA were used. The sample was transferred to standard transmission electron microscopy (TEM) copper half-ring grids using a micromanipulator. Focused Ion Beam (FIB) deposition (from the Pt precursor) was used to attach the manipulator probe to the sample and the foil to the grid. The copper grid was then manually removed from the crystal, which was then transferred to a carbon fibre attached to a metal pin and placed on the goniometer base.
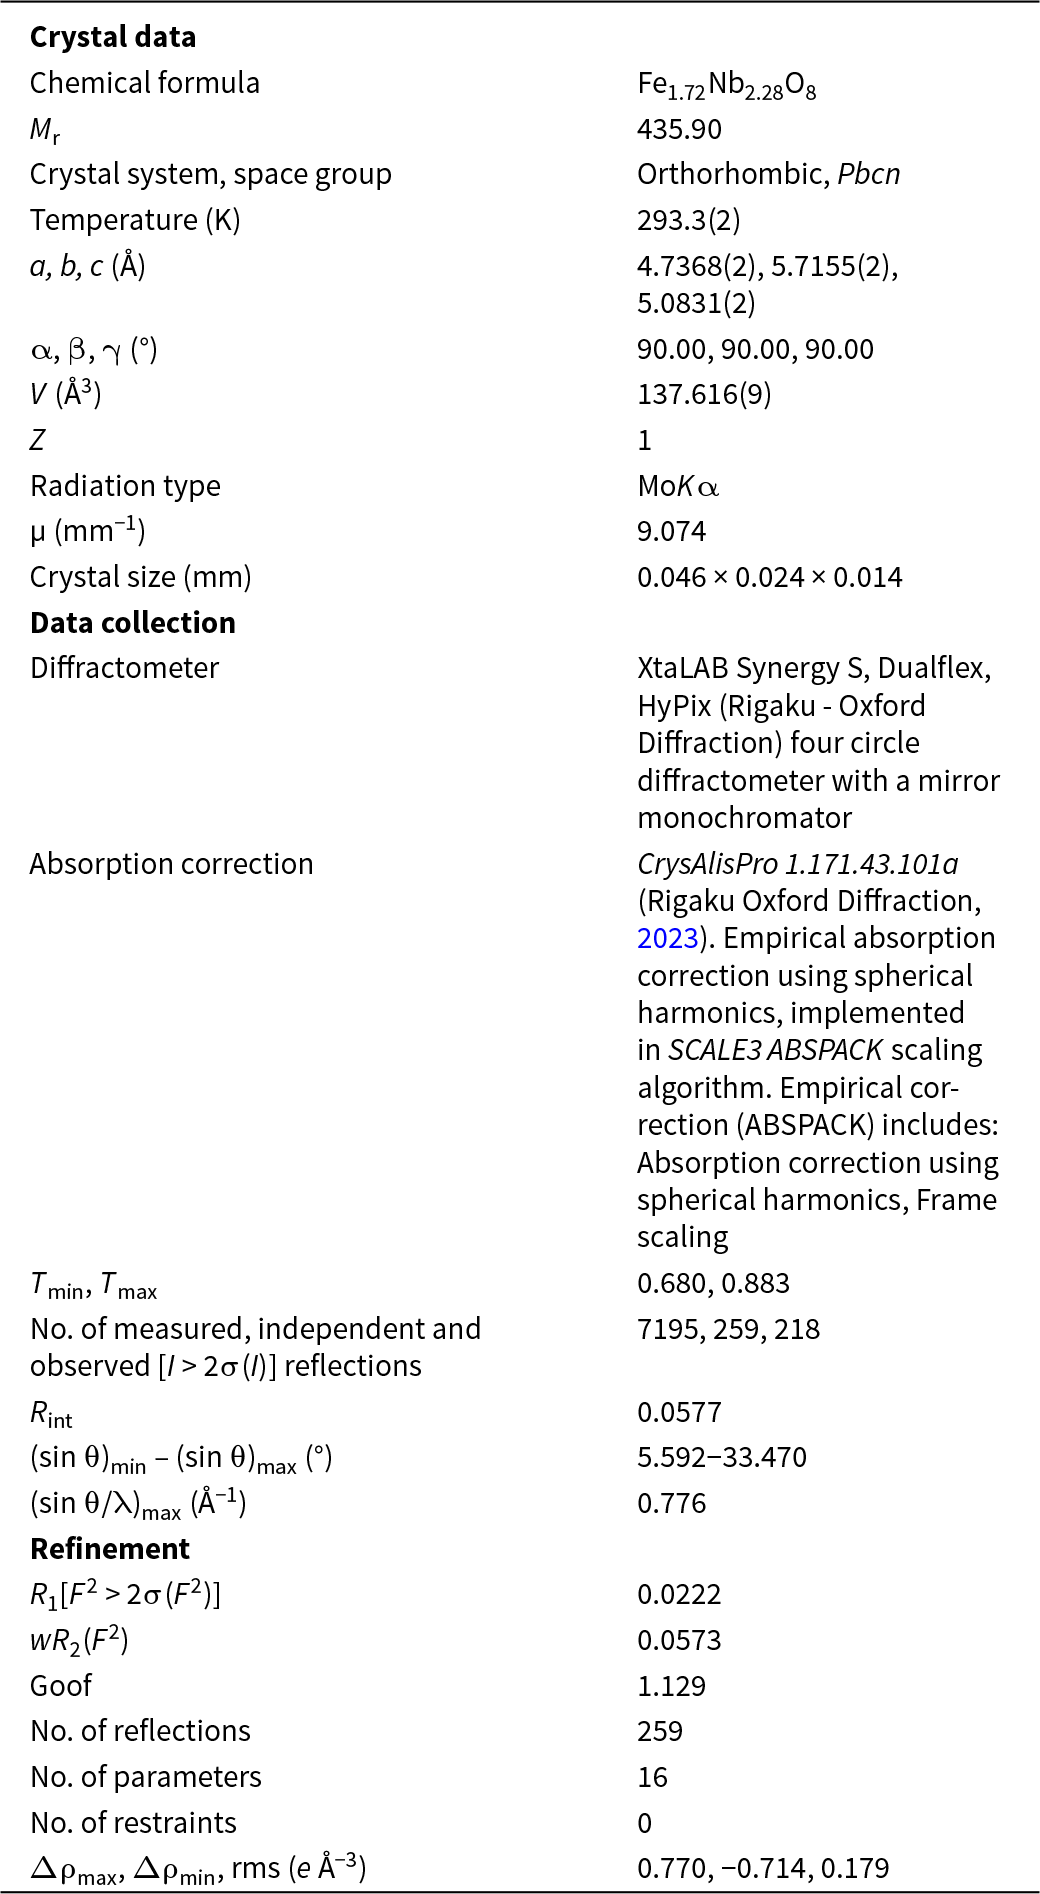
Single-crystal X-ray diffraction measurements were performed at the Laboratory of Single Crystal Diffraction at the Faculty of Chemistry, Jagiellonian University in Kraków. X-ray diffraction data were collected using a four-circle XtalLAB Synergy-S diffractometer (Rigaku Oxford Diffraction) with a mirror monochromator and microfocus source at a controlled temperature of 293.3(2) K using MoKα radiation (λ = 0.71073 Å), to a maximum θ value of 33.222°. The obtained data sets were processed using CrysAlisPro 1.171.43.101a software (Rigaku Oxford Diffraction, 2023).
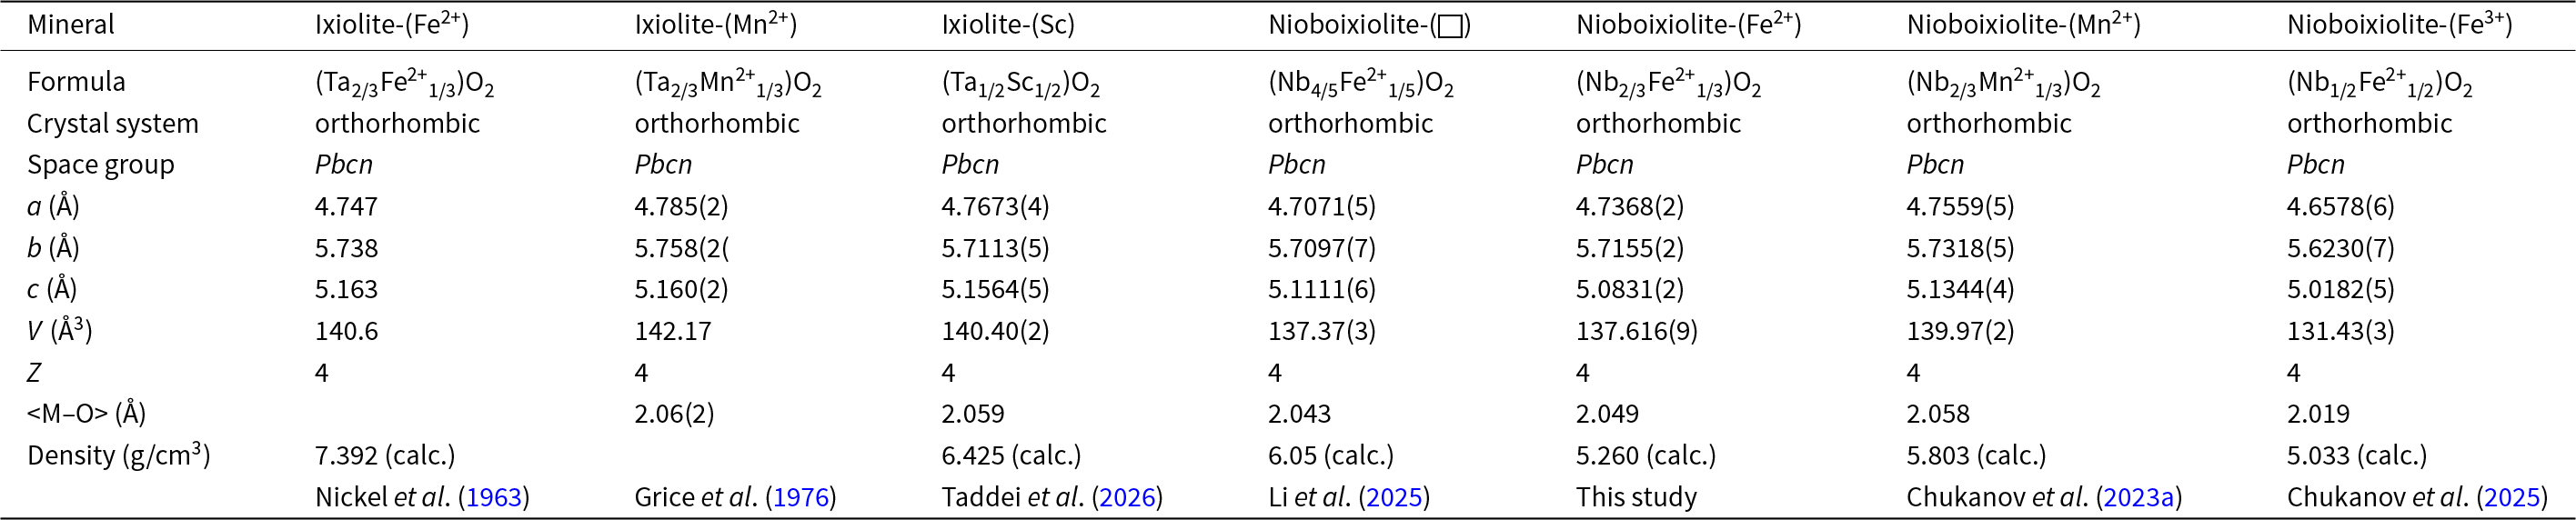
The structure was solved by the direct method using SHELXT-2014/5 (Sheldrick, Reference Sheldrick2015a). The parameters of the obtained structural model were refined using SHELXL-2019/3 (Sheldrick, Reference Sheldrick2015b). The occupancy of a single M site was refined as Nb vs. Fe. The refinement of 16 structural parameters (positional and anisotropic displacement parameters) in the Pbcn space-group symmetry yielded an R 1 index of 2.22% (R 1[all] = 2.57%), wR 2[all] = 5.72%, and a goodness of fit parameter S = 1.129. Details of the measurement and structural solution are given in Table 3. Refined atomic positions and equivalent isotropic and anisotropic displacement parameters are presented in Table 4. The crystallographic information file has been deposited with the Principal Editor of Mineralogical Magazine and is available as Supplementary material (see below). Table 5 provides a comparison of Ta- and Nb-dominant minerals of the ixiolite group, including their chemical compositions, unit-cell parameters, unit-cell volumes, calculated densities, crystal systems, and space-group symmetry (all orthorhombic, space group Pbcn), as well as mean metal–oxygen bond distances.
Details on data collection and structure refinement of nioboixiolite-(Fe2+)

Table 3 Long description
Crystal, data-collection, and refinement metrics are reported for nioboixiolite-(Fe2+) with composition Fe1.72Nb2.28O8 and formula mass 435.90. The structure is orthorhombic in space group Pbcn at 293.3 K, with unit-cell edges 4.7368, 5.7155, and 5.0831 angstroms, all angles 90 degrees, volume 137.616 cubic angstroms, and Z 1. Data were collected using molybdenum K alpha radiation on an XtaLAB Synergy S four-circle diffractometer; the crystal measured 0.046 by 0.024 by 0.014 millimeters and the absorption coefficient was 9.074 per millimeter. Absorption correction used an empirical spherical-harmonics approach; transmission factors ranged from 0.680 to 0.883. A total of 7195 reflections were measured, yielding 259 independent reflections and 218 observed above the stated intensity threshold, with an internal agreement value of 0.0577. The maximum resolution indicator reported as sine theta over wavelength reached 0.776 per angstrom. Refinement used 16 parameters and no restraints, giving R1 0.0222 for observed data, weighted R2 0.0573, and goodness of fit 1.129. Residual electron density ranged from 0.770 to minus 0.714 electrons per cubic angstrom, suggesting no major unmodeled features but still indicating small local misfits typical of heavy-atom oxides.
R int = Σ|F o2–F o2(mean)|/Σ[F o2]. Goof = {Σ[w(F o2–F c2)2]/(n–p+r)}1/2.
R 1 = Σ||F o|–|F c||/Σ|F o|. wR 2 = {Σ[w(F o2–F c2)2]/Σ[w(F o2)2]}1/2; w = 1/[σ2(F o2) + (aP)2 + bP], where a is 0.0288, b is 0.3235 and P is [2F c2 + F o2)]/3.
Atomic coordinates, occupancies, equivalent displacement parameters (Å2) for atoms in nioboixiolite-(Fe2+)

Table 4 Long description
Atomic site parameters list fractional coordinates, site occupancies, and equivalent and anisotropic displacement values for two sites. The M site is a mixed Nb and Fe position with occupancy Nb 0.57 and Fe 0.43, located at x 0.000000, y 0.32555, z 0.250000, and has Ueq 0.0134. Its principal displacement components are U11 0.0153, U22 0.0116, and U33 0.0133, with U23 and U12 reported as zero and a very small negative U13. The oxygen site at x 0.7297, y 0.1155, z 0.4177 has Ueq 0.0191, higher than the M site, indicating greater atomic displacement for oxygen in this model. For oxygen, U11 0.0197, U22 0.0173, and U33 0.0203 are all larger than the corresponding M-site values, and the off-diagonal terms are nonzero, including negative U23 and U13 and a small positive U12. Values in parentheses indicate reported uncertainties in the final digits, so small differences should be interpreted within those uncertainties.
Ixiolite-group minerals – a comparison

Table 5 Long description
Comparison of seven ixiolite-group minerals lists composition, crystallography, unit-cell dimensions, volume, Z value, average metal–oxygen distance, calculated density, and literature sources. All entries are orthorhombic with space group Pbcn and have Z equal to 4. Unit-cell parameter a spans roughly 4.66 to 4.79 angstroms, b about 5.62 to 5.76 angstroms, and c about 5.02 to 5.16 angstroms. Unit-cell volume varies from about 131.43 cubic angstroms for nioboixiolite with ferric iron to about 142.17 cubic angstroms for ixiolite with divalent manganese. Average metal–oxygen distance is reported for most minerals and ranges from about 2.019 angstroms (nioboixiolite with ferric iron) to about 2.06 angstroms (ixiolite with divalent manganese), with one ixiolite with divalent iron entry missing this value. Calculated density is highest for ixiolite with divalent iron at about 7.392 grams per cubic centimeter and lowest among reported values for nioboixiolite with ferric iron at about 5.033, with ixiolite with divalent manganese density not provided. Values include uncertainties in parentheses for several cell parameters, and some fields are blank, so comparisons should note missing data and mixed sources.
Crystal structure
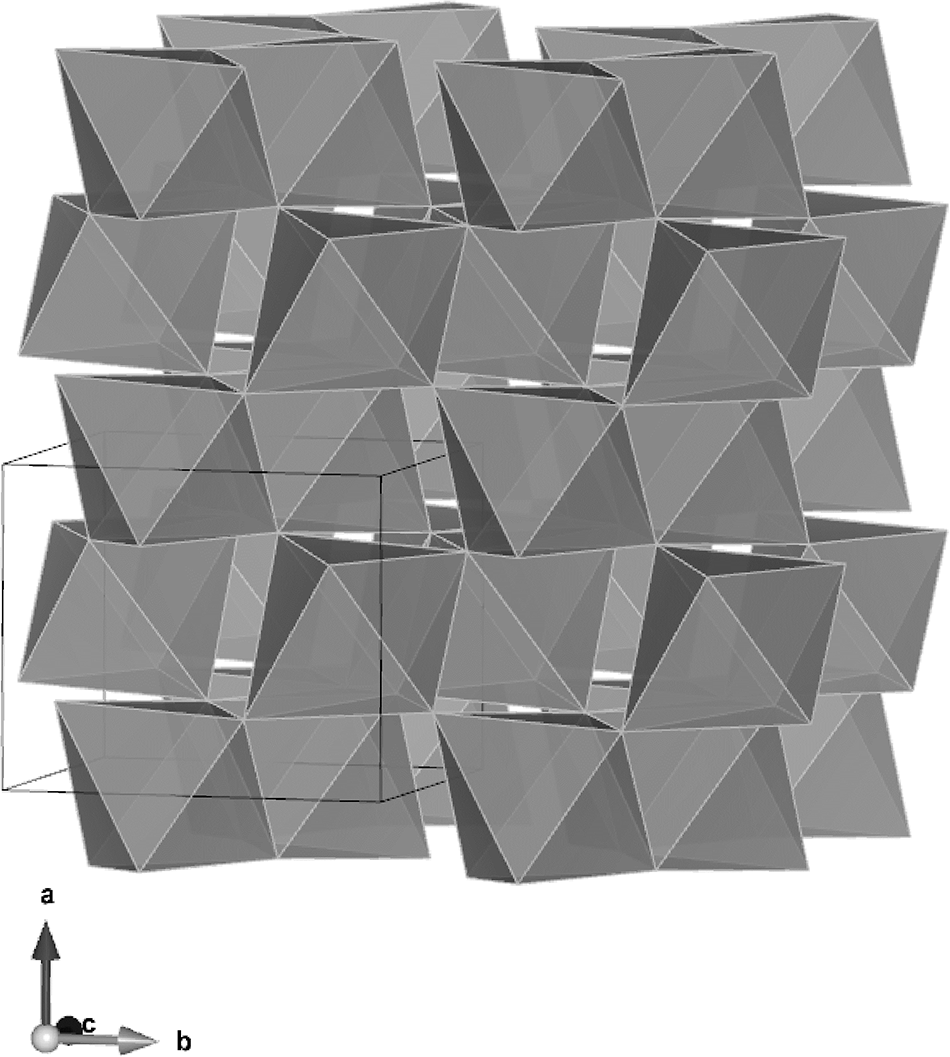
The crystal structure of nioboixiolite-(Fe2+) is identical to that of other minerals from the ixiolite group: the mineral crystallizes in the orthorhombic system, within the Pbcn space group, and exhibits an α-PbO2-type structure. All of the cations are surrounded octahedrally by oxygen atoms and are disordered at one site M. The MO6 octahedra share edges forming zig-zag-like chains along c and are connected by shared vertices along a (Fig. 4). The unit-cell parameters of the holotype crystal of nioboixiolite-(Fe2+) were refined as follows: a = 4.7368(2) Å, b = 5.7155(2) Å, c = 5.0831(2) Å, V = 137.616(9) Å3, and Z = 4, with axial ratios a: b: c = 0.8288: 1.0000: 0.8894.
Crystal structure of nioboixiolite-(Fe2+) viewed along the c axis (a single unit cell is outlined), visualized using VESTA 3 (Momma and Izumi, Reference Momma and Izumi2011).

Figure 4 Long description
The crystal structure of nioboixiolite-(Fe2+) is depicted with a view along the axis, showing a single unit cell outlined within the structure. The arrangement consists of octahedral units forming zig-zag-like chains along the c direction, connected by shared vertices along the a direction. The structure is visualized in an orthorhombic system, within the Pbcn space group, exhibiting an alpha-PbO2-type structure. All cations are surrounded octahedrally by oxygen atoms, with disorder at one site labeled M. The diagram includes an axis indicator at the bottom left, showing directions labeled a and b, with arrows indicating orientation.
The refined M site-scattering of 34.6(5) e – is very close to the number of electrons, 34.1 e –, calculated from the empirical formula (the difference being within one estimated standard deviation). The MO6 octahedron is highly distorted, with two short M–O bonds [1.951(2) Å], two medium bonds [2.037(2) Å], and two elongated bonds [2.158(2) Å], giving an averaged distance <M–O> = 2.049 Å. This value corresponds well to <M–O> = 2.034 Å, which was calculated from the empirical formula and experimental interatomic distances according to Hawthorne and Gagné (Reference Hawthorne and Gagné2024).
Powder X-ray diffraction data
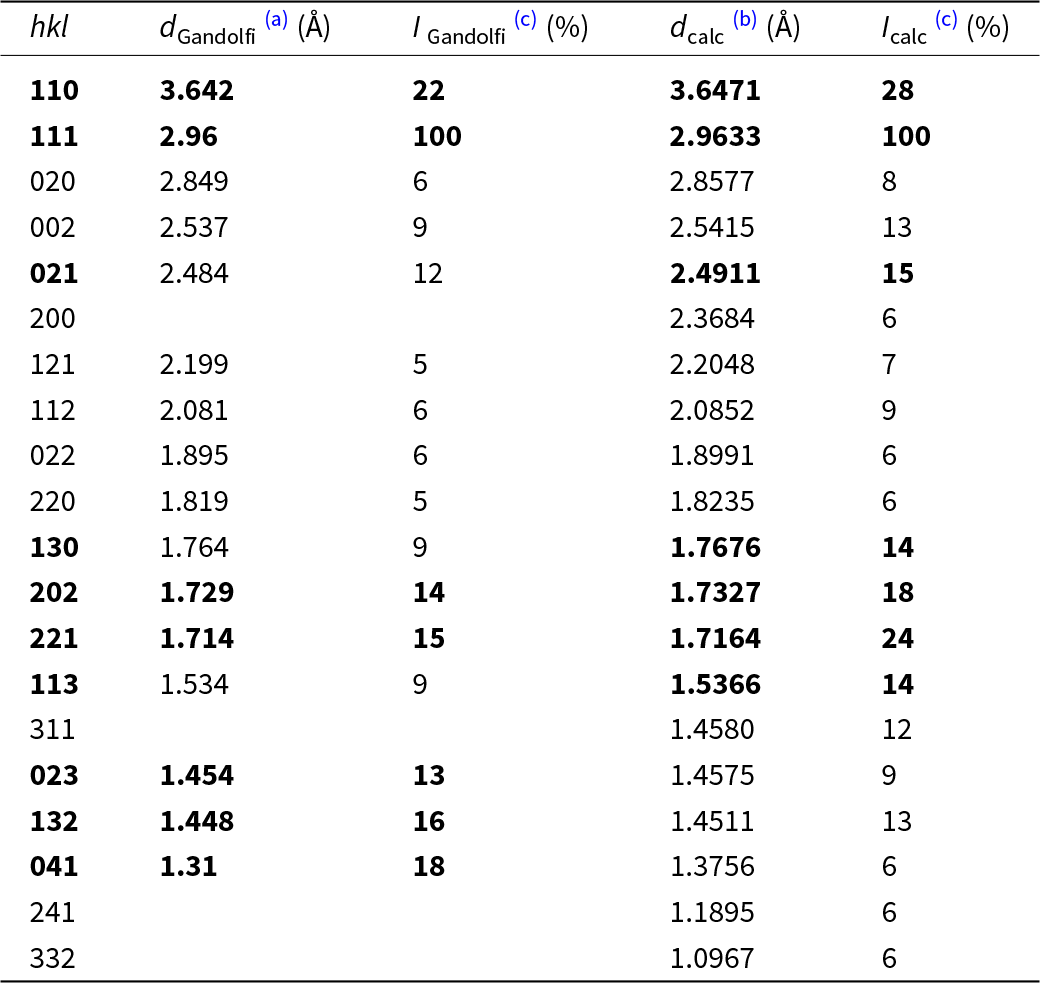
The acquisition of conventional powder X-ray diffraction data was precluded by the very limited amount of available holotype material. To overcome this limitation, diffraction data were collected from a FIB-extracted fragment using a Gandolfi data collection strategy on a single-crystal diffractometer and processed with CrysAlisPro 1.171.44.85 (Rigaku Oxford Diffraction, 2024). The experimentally derived diffraction pattern was compared with that calculated from the refined crystal-structure model. A complete comparison between the observed and calculated powder diffraction data is provided in Table 6, where the seven strongest reflections are indicated in bold type.
Powder X-ray diffraction data from a Gandolfi data collection strategy for single crystal and the powder pattern calculated from the refined single-crystal structure data for nioboixiolite-(Fe2+)

Table 6 Long description
Powder X-ray diffraction peak list for nioboixiolite-(Fe2+) compares measured Gandolfi d-spacings and relative intensities with values calculated from a refined single-crystal structure. The dominant reflection is hkl 111 at about 2.96 Å, with 100 percent intensity in both datasets. Next-strongest measured peaks include 110 at about 3.64 Å (22 percent), 041 at about 1.31 Å (18 percent), 132 at about 1.45 Å (16 percent), 221 at about 1.71 Å (15 percent), and 202 at about 1.73 Å (14 percent). Calculated intensities broadly track the measured pattern, for example 110 is 28 percent calculated and 221 is 24 percent calculated, while several mid-intensity peaks are slightly higher in the calculation (such as 130 at 14 percent calculated versus 9 percent measured). Several reflections appear only in the calculated list because no measured d-spacing or intensity is reported for them, including 200, 311, 241, and 332. Overall, measured and calculated d-spacings are very close for shared reflections, supporting consistency between the powder data and the refined structure, with minor intensity differences expected from experimental and preferred-orientation effects.
Notes: Powder X-ray diffraction data:
(a) from a Gandolfi data collection strategy for single crystal;
(b) calculated from single-crystal data based on the refined unit-cell parameters;
(c) only reflections with I calc ≥5 are given; The strongest reflections are marked in boldtype.
Genetic implications
Minerals of the ixiolite group constitute a very specific group of oxides within the columbite mineral supergroup. They are the only ones with a completely disordered structure, where all components occupy a single, octahedrally coordinated, M site. Mineral species from other groups (columbite, samarskite, wodginite and wolframite) have cations arranged at two to three structural sites, also octahedrally coordinated by oxygen atoms. Apart from species with an ideal formula that strictly correspond to the MO2 stoichiometry (srilankite, scrutinyite and seifertite), all other species with the root-name ixiolite are niobates–tantalates with stoichiometry charge-balanced by additional M0+, M2+, or M3+ cations. This is because the charge-balanced end-member formulas in this group cannot be written with a single cationic component (Chukanov et al., Reference Chukanov, Pasero, Aksenov, Britvin, Zubkova, Yike and Witzke2023b).
The nioboixiolite-(Fe2+) described contains M3+ and M4+ components in comparable amounts of 0.121 apfu and 0.108 apfu, while M2+ and M5+ components are deficient by ∼0.33–0.35 apfu, compared to the stoichiometry of columbite. This clearly indicates that the composition of this nioboixiolite-(Fe2+) is a derivative of columbite-(Fe2+) through the substitution: M3+ + M4+ → M2+ + M5+. Such substitution is responsible for the incorporation of Sc3+ and, to a lesser extent, Fe3+ into the columbite and ixiolite structures, with preference being given to the trivalent cations occupying the (Fe,Mn) site, while the tetravalent cations prefer the (Nb,Ta) site (Wise et al., Reference Wise, Cerny and Falster1998). The same substitution is significant in other ixiolite species. Nioboixiolite-(□) from the Bayan Obo mine (Baotou City, Inner Mongolia, China), found in a carbonatite composed of dolomite, calcite, magnetite, apatite, biotite, actinolite, zircon and columbite-(Fe), has the following empirical composition: [(Nb1.79Ta0.32)□0.46(Ti0.23Si0.14)U0.38(Ca0.25Sr0.06Pb0.02Mg0.02Ba0.02Mn0.01)(Fe0.25Ce0.02Nd0.01Ln*0.02)]Σ4O8 (Z = 1) (Li et al., Reference Li, Ke, Wang, Peng, Zhao, Li, Chen, Li, Yu, Zhang, Guo and Gao2025). This mineral can also be considered as a disordered analogue of a member from the columbite group, especially after the introduction of species from the former euxenite group [fersmite, euxenite-(Y), tanteuxenite-(Y) and uranopolycrase] into the newly created columbite group within the columbite supergroup classification (Chukanov et al., Reference Chukanov, Pasero, Aksenov, Britvin, Zubkova, Yike and Witzke2023b). Nioboixiolite-(Mn2+) found in the albite zone of the Sosedka granite pegmatite, in the Transbaikal region of Siberia (Russia), in association with albite, quartz, microcline, elbaite, beryl, bismuthinite, euxenite-(Y), zircon, rutile, cassiterite and secondary cannonite, has the following empirical composition (written in terms of valence groups of ions): [(Nb1.59Ta0.59)Σ2.18(Ti0.47Zr0.07Sn0.03U0.03)Σ0.60(Sc0.13Y0.06Fe3+0.01)Σ0.20Mn2+1.04]O8 (Z = 1) (Chukanov et al., Reference Chukanov, Pekov, Zubkova, Yapaskurt, Shelukhina, Britvin and Pushcharovsky2023a). In this case, the mineral can be considered a disordered Nb-analogue of titanowodginite, MnTiTa2O8 (Ercit et al., Reference Ercit, Černý and Hawthorne1992). Nioboixiolite-(Fe3+) from the Laach Lake volcano in the Eifel region, Germany, is found in nosean sanidinite, in association with sanidine, K-bearing albite, nosean, biotite, Nb-rich ilmenite, Ti-rich magnetite, hercynite, corundum, samarskite-(Y), ekebergite and columbite-(Fe). It has the empirical composition (Mg0.04Mn2+0.20)Σ0.24(Al0.03Cr0.04Fe3+1.01)Σ1.08(Ti1.11Zr0.02)Σ1.13Nb1.55O8 (Z = 1) (Chukanov et al., Reference Chukanov, Zubkova, Pekov, Kasatkin, Agakhanov, Virus, Vigasina, Ternes, Schüller and Britvin2025) and could be considered a disordered Fe3+,Ti-analogue of columbite-(Fe). In turn, ixiolite-(Sc) with the empirical formula: [(Ta0.33Nb0.13)Σ0.46(Sn0.08Zr0.02Ti0.02Si0.01)Σ0.13Sc0.27(Mn2+0.07Fe2+0.06)Σ0.13W0.01)Σ1.00O2, recently described in the Heftetjern pegmatite in Tordal (Telemark, Norway) (Taddei et al., Reference Taddei, Holtstam, Kristiansen and Bindi2026) can be considered a disordered analogue of heftetjernite, ScNbO4 (Kolitsch et al., Reference Kolitsch, Kristiansen, Raade and Tillmanns2010) but, in this case, resulting from the substitution M2+ + M4+ → 2M3+.
The ixiolite group species have very diverse chemical compositions, usually containing (in addition to Nb and Ta) other high-field-strength-elements, such as Fe3+, Sc, Ti, Zr and Sn. They all have a geochemical tendency to concentrate inside carbonate and alkaline silicate melts or in pegmatite-forming melts, especially those associated with the NYF (Nb-Y-F) petrogenetic family. The substitution M3+ + M4+ → M2+ + M5+ mainly relates to the replacement of (Nb,Ta)5+ by Ti4+ and (Mn,Fe)2+ by (Fe,Sc)3+. In both cases, this leads to the reduction of M–O distances, as indicated by comparisons of statistically determined bond lengths (Hawthorne and Gagné, Reference Hawthorne and Gagné2024): (Nb,Ta)5+–O = 1.99 Å versus Ti4+–O = 1.971 Å, and Mn2+–O = 2.199 Å and Fe2+–O = 2.147 Å versus Fe3+–O = 2.015 Å and Sc3+–O = 2.098 Å. This results in a gradual standardisation of M–O distances and the replacement of two or three structural sites in ordered structures, with a single site in a disordered structure being capable of accommodating all of the chemical components of such an oxide. Since these elements vary in their concentrations in geological environments, it is most probable that phases comprising the main chemical components, and with wide stability conditions, e.g. columbite-group minerals, wolframite, and wodginite-group minerals, should crystallise first. The residues of this primary crystallisation, containing sub-concentrated components that were only partially compatible with the crystallising oxides in the primary stage, appear to be the appropriate environment responsible for the crystallisation of ixiolites. For example, the nioboixiolite-(Fe2+) described at Jordanów Śląski occurs in mineralisation containing Nb-rich rutile, ilmenite, titanite and pyrochlore, indicating the primary crystallisation of Ti-bearing phases. This crystallisation, consuming titanium, led to the concentration of Fe, Sc, Mn2+ and Ca, and crystallisation of nioboixiolite-(Fe2+) and the associated Ca,Pb-bearing hydropyrochlore. In the case of the Bayan Obo nioboixiolite-(□), this mineral is associated with columbite-(Fe2+) (Li et al., Reference Li, Ke, Wang, Peng, Zhao, Li, Chen, Li, Yu, Zhang, Guo and Gao2025); the Sosedka nioboixiolite-(Mn2+) is associated with euxenite-(Y), zircon, rutile and cassiterite (Chukanov et al., Reference Chukanov, Pasero, Aksenov, Britvin, Zubkova, Yike and Witzke2023b), and the Laach Lake nioboixiolite-(Fe3+) is associated with samarskite-(Y) and columbite-(Fe) (Chukanov et al., Reference Chukanov, Zubkova, Pekov, Kasatkin, Agakhanov, Virus, Vigasina, Ternes, Schüller and Britvin2025). In all these cases, the earlier crystallisation of columbite-(Fe), ilmenite, rutile or euxenite-(Y) favoured the slightly later crystallisation of mineral species from the ixiolite group.
Supplementary material
The supplementary material for this article can be found at https://doi.org/10.1180/mgm.2026.10244
Acknowledgements
We thank two anonymous reviewers as well as editorial handling by Oleg Siidra that greatly improved the quality of the manuscript. This research was funded in whole by the National Science Centre, Poland grant 2024/55/B/ST10/00207 to A.P.
Competing interests
The authors declare none.