INTRODUCTION
Owing to the rising global food demand, the World Bank estimates that cereal production needs to increase by 50%, and meat production by 85%, by 2030 compared to the year 2000 (World Bank 2008). During the last 40 years, European meat consumption has increased by 63% (R. K. Pachauri, personal communication 2014). Pork has been the dominant type of meat (67%) produced in Germany over recent years (Destatis 2013). Although pork has tended to have less environmental impact compared to an equivalent unit of beef or lamb (Kleanthous Reference Kleanthous2009), the high consumption level has demonstrated that the environmental impacts arising from its production need to be assessed. Several previous European life-cycle assessments (LCA) have calculated an average global warming potential (GWP) of 3·3 kg CO2-eq/kg pork (Dalgaard et al. Reference Dalgaard, Halberg and Hermansen2007; Stephenson Reference Stephenson2010; Nguyen et al. Reference Nguyen, Hermansen and Mogensen2011; Reckmann et al. Reference Reckmann, Traulsen and Krieter2013). Since there are only a few studies to date assessing the environmental impacts of pork, impacts split from the different stages of the pork supply chain still need to be investigated further.
According to Schils et al. (Reference Schils, Olesen, del Prado and Soussane2007b ), a holistic approach is essential to reveal relevant interactions between farm components. Also Vergé et al. (Reference Vergé, Dyer, Desjardins and Worth2009) mentioned that management practices affect various types of emissions at the same time. Therefore, if the influence of different management strategies on the environmental impacts is to be assessed, it is important to account for the interactions and dependencies of different farm components. This means, when changing one management parameter, all the parameters influenced by this change should be regarded simultaneously. In the case of pork production, recent studies have identified the farrowing and the finishing stages as having the most environmental impact within the pig housing stage (Kingston et al. Reference Kingston, Meyhoff Fry and Aumonier2009; Reckmann et al. Reference Reckmann, Traulsen and Krieter2013), within which the number of piglets born alive per litter, piglet losses, the feed conversion ratio and daily weight gain are known as the most important parameters in terms of economic relevance. When selecting for an increased number of piglets born alive, other aspects such as animal health, animal welfare or environmental impacts should also be considered simultaneously. Hence, it could be relevant to include environmental aspects in future breeding goals. But although Knap (Reference Knap and Meyers2012) and Shirali et al. (Reference Shirali, Doeschl-Wilson, Knap, Duthie, Kanis, van Arendonk and Roehe2012) highlighted that pig breeding has contributed considerably to reduced N emissions from pigs, these aspects have not yet been incorporated into formal breeding goals. Therefore, the aim of the current study was to determine the potential of different production practices at farm level to influence the environmental impacts of pork. In this way, further knowledge should be gained to identify parameters which could potentially be included in future breeding goals. For this reason, various performance parameters in the pig housing stages were examined. All parameters regarded in the current study were calculated separately for piglet production and finishing stage. Furthermore, a pig farm model was implemented whose aim was to account for the afore-mentioned interactions between farm components.
MATERIALS AND METHODS
Pork production in Northern Germany: a system description
One step of an LCA deals with the inventory of input/output data, including resources used and substances emitted throughout the entire life cycle of the product under study (ISO 2006a , b ). The life-cycle inventory of pork production in Northern Germany is presented in the following sections. A more detailed description of the system is given in the Supporting Information (go to http://journals.cambridge.org/AGS) as well as in Reckmann et al. (Reference Reckmann, Traulsen and Krieter2013).
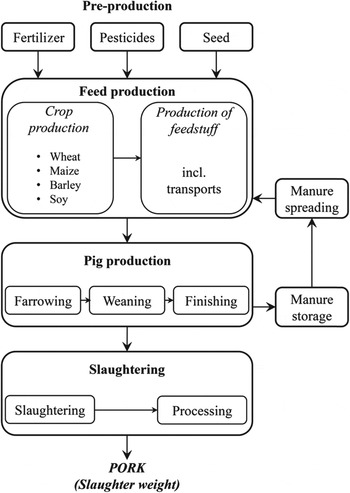
The system under study was the production of pork in the north of Germany in 2010/11. The production process within the system boundaries is illustrated in Fig. 1. The assessment encompassed the production of pre-products, the cultivation of feed crops and the production of feedstuffs as well as the housing of the pigs, and ended with the slaughtering of pigs and processing to pork. Packaging of meat, food retailing and the consumption of meat were excluded. A report from the UK (Kingston et al. Reference Kingston, Meyhoff Fry and Aumonier2009) stated that the inclusion of these stages would raise the carbon footprint of UK pork by 4·2%. In accordance with guidelines published by the British Standards Institution (British Standard Institution 2008), production units that played a minor role in the production process, such as chemicals and buildings, were not regarded in the current study. The calculation of environmental impacts included primary and secondary sources. Primary sources were on-farm sources, e.g. through feed production, animals and manure management. Secondary sources occurred off-farm, e.g. during the production of fertilizers, pesticides, diesel or feedstuffs produced outside the farm (Rotz et al. Reference Rotz, Montes and Chianese2010).
Simplified scheme of the pork supply chain within system boundaries chosen.

The inventory started with the production of crops and feed. In this context, six different feed compositions were used: feed for lactating and gestating sows, piglet feed and three finisher feeds. Detailed information is given in the Supporting Information: ingredients and components of the feed mixtures are listed in Table S1 (go to http://journals.cambridge.org/AGS). The ingredients were mainly produced in Germany (e.g. wheat, barley); soy was imported from Brazil (FAO 2011). A partial inventory of feed is given in Table S3 of the Supporting Information, which provides a data inventory per live weight at farm gate.
The next step was to reflect the average pig production in the marketing year of 2010/11: average farm data from an extension service was used (SSBSH 2011). The main performance parameters are summarized in Table S2 of the Supporting Information. The pig housing encompassed all life stages of the pigs and was differentiated into piglet production, weaning and finishing. The inventory for pig housing included the amount of feed needed to raise the pigs, the consumption of electricity, heat and water as well as gases emitted. These data together with transport distances of the feed, animals, carcasses and manure are highlighted in Table S3 (go to http://journals.cambridge.org/AGS). Manure was produced by the animals during all stages of pig housing and details of the manure management are described in the Supporting Information. A scheme of the manure management factors included in the current study is illustrated in Fig. S1. It was shown that the application of manure to the field could potentially be a substitute for synthetic fertilizers. The actual study mainly used IPCC guidelines (IPCC Reference Eggleston, Buendia, Miwa, Ngara and Tanabe2006) to calculate impacts related to manure management (see Reckmann et al. Reference Reckmann, Traulsen and Krieter2013).
Pigs were transported by lorry to the slaughterhouse at the end of the fattening period. The final product was pork as slaughter weight. Pigs were slaughtered at a live weight of 120 kg, resulting in a slaughter weight of about 95 kg. A data inventory of the slaughtering process is shown in Table S4 of the Supporting Information.
Secondary data were included in databases of the software used, i.e. SimaPro 7.3.3 (Pré Consultants 2009), mainly from the Ecoinvent database v 2.2 (Ecoinvent 2009).
Calculation of the life-cycle assessment for pork production
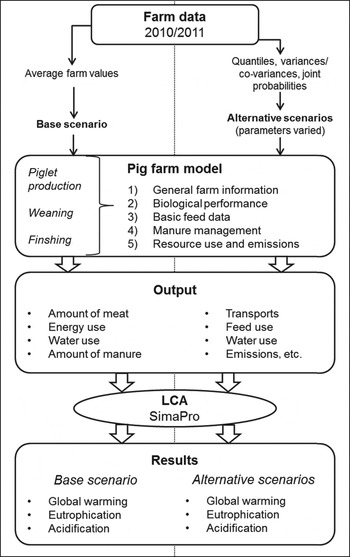
To calculate the environmental impacts due to different pork production scenarios, a specific calculation procedure was developed. This is illustrated schematically in Fig. 2, separated into the ‘base scenario’ on the left and ‘alternative scenarios’ on the right. The approach is described further in the following sections.
Calculation approach for the LCA of the base and the alternative scenarios for pork production in Germany.

Base scenario
As illustrated in Fig. 2, the calculation procedure started with the collection of farm data, as described before. Average farm values were used to represent the average pork production in Germany in 2010/11, indicated as the ‘base scenario’ in the following.
Variation of performance parameters
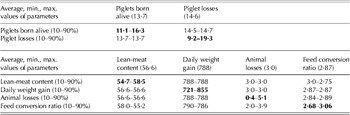
For the construction of alternative scenarios, farm data from the extension service (SSBSH 2011) were used to calculate quantiles, variances and co-variances of specific performance parameters (see Fig. 2). These parameters were varied separately for the stages of piglet production and finishing. As listed in Table 1, piglet losses and number of piglets born alive per litter were varied in piglet production. Lean-meat content, daily weight gain, animal losses and feed conversion ratio were the parameters varied in the finishing stage. In a discussion with experts, these parameters were identified as the most important in the pig housing stage as they covered the main biological and feed-related performances. In a first step, the parameters were varied in increments of the quantiles calculated previously (ranging from 10 to 90%). In a second step, variances and co-variances were used together with the parameters varied to calculate joint probabilities (Table 1) with SAS® 9.2 (SAS® Institute Inc. 2008). In this way, it was possible to account for dependencies between the parameters described. This procedure was carried out separately for the stages of piglet production and finishing, but jointly for all the parameters of each stage, resulting in a total of 24 alternative scenarios. Table 1 shows the values of all parameters changed for the variation of 10–90% quantiles as well as all parameters from the particular stages which were influenced by this change through joint probabilities. The mean values listed represented the base scenario, while being equivalent to the 50% quantile. These values were then incorporated into the pig farm model for each scenario.
Level of performance parameters (average farm values) from piglet production and the finishing stage for the maximum variation of 10–90% quantiles (alternative scenarios). Results of the parameters varied are displaced as bold values in the diagonal, off-diagonals show results from the parameters influenced by this change through joint probabilities. Values in parentheses are mean values of the particular parameter for the base scenario

Pig farm model
Whole-farm models, as presented by Schils et al. (Reference Schils, Olesen, del Prado and Soussane2007b ), are normally a diverse mix of empirical and mechanistic modelling. The deterministic model of the pig farm implemented reflected processes within a farrow-to-finishing farm. The computer simulation used the farm data presented in combination with emission factors (IPCC Reference Eggleston, Buendia, Miwa, Ngara and Tanabe2006) and various estimating equations (e.g. Dämmgen & Hutchings Reference Dämmgen and Hutchings2008; Sommer et al. Reference Sommer, Maahn, Poulsen, Hjorth and Sehested2008; Rigolot et al. Reference Rigolot, Espagnol, Pomar and Dourmad2010). In general, the pig farm model included an integrated production chain with vertical linkages between the four stages: farrowing, weaning, finishing and slaughtering of pigs. Thereby, the pig farm model was divided into five modules: general farm information, biological performances, basic feed data, manure management and resource use and emissions, as shown in Fig. 2. Each of these modules was divided further with regard to the stages farrowing, weaning and finishing. Generally, input parameters were related to biological, economic and environmental variables which were varied within a normal range in the base scenario, as demonstrated by Krieter (Reference Krieter2001), whereas economic variables were not considered in the current study. Specifically, the general farm information described production parameters reflected in the model. Examples of input data are number of sows on the farm, number of piglet places per farm and finisher pigs produced per farm. The data for this area mainly originated from the extension service (SSBSH 2011). The biological performance of the farm was addressed in the second module of the pig farm model, considering biological coherencies. Number of piglets born alive per litter, piglet losses, weights of the sows, number of piglets produced per sow, N retention of the animals and daily weight gains of the finisher pigs were some of the parameters dealt within this step. The third bullet point included basic feed data, such as feed intake of the pigs in the different stages, protein content of the feed mixtures and amount of feed needed per farm. The data of this step were provided by the feed company and the extension service. Up to this point, the model was based mainly on Krieter (Reference Krieter1994, Reference Krieter2001) and de Vries (Reference de Vries1989), but updated with current production parameters and expanded using new aspects. Manure management was described in the fourth module of the pig farm model. A simplified scheme of manure management included in the pig farm model is shown in Fig. S1 of the Supporting Information (go to http://www.journals.cambridge.org.AGS). The consumption of different resources (e.g. heat, electricity, water and transports) as well as emissions (e.g. CH4 from enteric fermentation) was calculated in the last step of the pig farm model. Data sources are listed in Table S3 of the Supporting Information. The model was based on a deterministic approach using fixed probability distributions (e.g. different culling rates for sows within cycle, varying litter sizes for sows during longevity), according to Krieter (Reference Krieter1994, Reference Krieter2001). Interactions between farm parameters were accounted for since most of the calculations in the pig farm model were interactive. The procedure of a model run is amplified in Krieter (Reference Krieter2001). The main steps are explained in the following.
The model started with the generation of sow performance. The resulting production cycle was at least 150 or 143 days, whereas the average production cycle was longer due to reproduction failure (e.g. rebreeding, abortion). Litter size and piglet losses were simulated over ten litters with non-linear pattern for both parameters (de Vries Reference de Vries1989). Regarding the above-mentioned performance parameters, an average of 13·7 piglets were born alive per litter and piglet losses averaged 0·15. In the finishing stage, growth performance was of major interest and was calculated using the Gompertz function (Krieter & Kalm Reference Krieter and Kalm1989; Dourmad et al. Reference Dourmad, Guillou and Noblet1992). Daily weight gain for the base scenario was 788 g (see Table S2, Supporting Information): daily weight gain and feed conversion ratio were negatively correlated. A three-phase feeding was used in the finishing stage. Mortality rate in this stage amounted to 0·03. The slaughter weight of c. 95 kg resulted from a final fattening weight of 120 kg and a carcass yield of 0·79. Therefore, the lean-meat content was slightly negatively correlated with feed conversion ratio. In addition to the biological parameters, the amount of nitrogen (N), phosphorus (P) and methane (CH4) excreted by the pigs was also calculated. Details are described in the Supporting Information (go to http://www.journals.cambridge.org/AGS) as well as in Reckmann et al. (Reference Reckmann, Traulsen and Krieter2013).
A validation of the farm model started during the development process of the individual modules of the model. Their structure, variables and parameters used, and their behaviour were continuously examined. For this type of validation, experts in farm management and nutrition of the extension services were used to check modules and the system as a whole. Subsequently, the model was subjected to a sensitivity analysis with a systematic investigation of the feedback from the model response to extreme input values. Again, the behaviour of the system was reviewed by the same advisory board and the qualitative expert knowledge was used for optimizing the model.
Output
An output was generated for each scenario modelled in this way. Among other output values, it included the amount of meat produced, electricity and water use, the amount of manure produced, transportation distances, feed use and on-farm emissions (Fig. 2). The output data were used to estimate the environmental impacts of the pork supply chain for the different scenarios via an LCA.
Life-cycle assessment
The methodology of LCA was applied because, of all the different methods used to determine the environmental impact of livestock production systems (Halberg et al. Reference Halberg, van der Werf, Basset-Mens, Dalgaard and de Boer2005; Dalgaard et al. Reference Dalgaard, Halberg and Hermansen2007), LCA is widely used, of high relevance and good quality (Thomassen & de Boer Reference Thomassen and de Boer2005). The attributional approach was used in the current study, which describes the environmentally relevant physical flows to and from a life cycle (Curran et al. Reference Curran, Mann and Norris2005) in a status quo situation (de Vries & de Boer Reference de Vries and de Boer2010) in relation to the functional unit (Nguyen et al. Reference Nguyen, Hermansen and Mogensen2011). Details of the LCA methodology and its application on pork production are described in Reckmann et al. (Reference Reckmann, Traulsen and Krieter2012). All calculations for the analysis were performed in SimaPro 7.3.3 (Pré Consultants 2009).
Impact assessment
Results were calculated for each of the 24 scenarios, expressed in the impact categories GWP (expressed in CO2-eq), eutrophication potential (EP; expressed in PO4-eq) and acidification potential (AP; expressed in SO2-eq). These are the most established categories that reflect an environmental picture of agricultural products (Halberg et al. Reference Halberg, van der Werf, Basset-Mens, Dalgaard and de Boer2005). To calculate the results of these categories, the CML 2 Baseline 2000 method v 2.05 (CML 2009) was used. The functional unit of the results presented was 1 kg of pork (slaughter weight) at the gate of the slaughterhouse.
RESULTS
Results of the base scenario
The environmental impacts of the base scenario are presented in Table 2. The assessment of basic pork production resulted in a GWP of 3·22 kg CO2-eq/kg pork. The EP of pork production in 2010/11 was 23·3 g PO4-eq/kg pork, whereas the AP reached 57·1 g SO2-eq/kg pork. It should be highlighted that the GWP was mainly caused by the production of feed (0·63), followed by the housing of pigs (0·30). The slaughtering process had a minor share of the GWP (0·07). The most polluting stage in terms of EP was feed production with a share of 0·52. Pig housing was responsible for 0·36, while slaughtering held the smallest share (0·12). The AP was affected mainly by the pig housing stage (0·76); 0·23 of the AP could be traced back to the production of feedstuffs, whereas slaughtering contributed considerably less (0·01).
Global warming (GWP), eutrophication (EP) and acidification (AP) of pork production in Northern Germany in 2010/2011 (per kg pork) for the base scenario

Environmental impacts of alternative scenarios
Farrowing stage
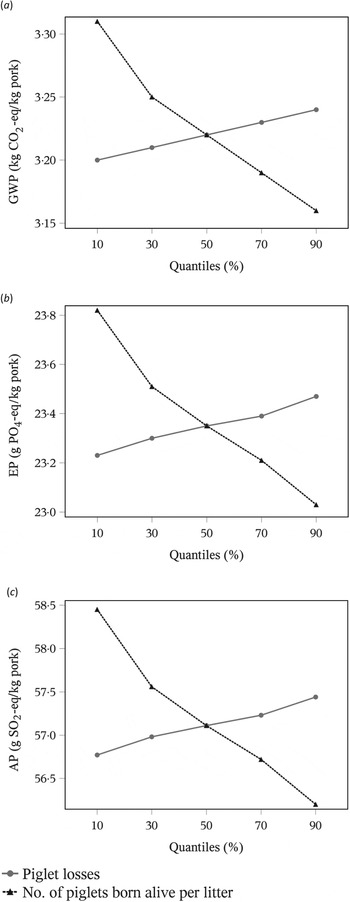
The results of the different levels of piglet losses and number of piglets born alive per litter are shown in Figs 3(a) to (c) for the impact categories (GWP, EP and AP). They illustrate the course of the curve of different parameters assessed to visualize the influence of the changes on the results. The different impact categories showed similar tendencies.
(a) Global warming potential, (b) EP and (c) AP of the piglet production parameters piglet losses and number of piglets born alive per litter. Parameters were varied in units of quantiles, where 50% represents the base scenario.

A lower number of piglets per litter (11·1) resulted in a GWP of 3·31 kg CO2-eq, whereas the increase in this parameter (16·3) led to a GWP of 3·16 kg CO2-eq/kg pork. These values reflected an increase of 2·8% and a decrease of 1·8% compared to the base scenario (Fig. 3(a)). The EP and AP also decreased with a rising number of piglets born alive (23·8–23·0 g PO4-eq and 58·4–56·2 g SO2-eq/kg pork), following the same trend as the GWP (Figs 3(b) and (c)).
Rising piglet losses led to a slightly increased GWP, ranging from 3·20 (10% quantile) to 3·24 (90% quantile) kg CO2-eq/kg pork. The increase in the EP was less marked, reaching values of 23·2 up to 23·5 g PO4-eq/kg pork (Fig. 3(b)). The variation of piglet losses resulted in a maximum change of the AP by 0·6% (Fig. 3(c)), compared to the base scenario.
Overall, the figures illustrate that variation in the number of piglets per litter affected the impact categories much more than a variation of piglet losses. Additionally, the results of piglet losses showed an almost linear increase. The results of the number of piglets born alive, in contrast, tended to show a non-linear decrease. Starting from the base scenario (50% quantile), a lower number of piglets born alive per litter influenced the results more than higher numbers. Hence, the slope of the curve is higher in the range of 10–50% quantiles than in the range of 50–90% quantiles.
Finishing stage
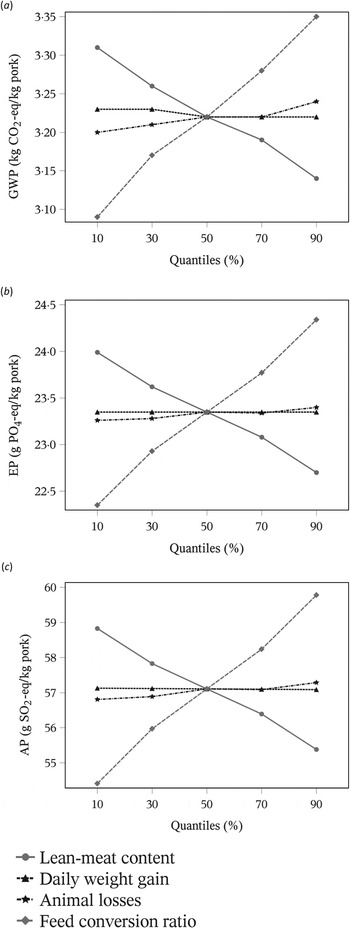
The LCA results of varying performances of finishing pigs for the impact categories are demonstrated in Figs 4(a) to (c). They illustrate the trends of the impact categories for varied lean-meat content, daily weight gain, animal losses and feed conversion ratio.
(a) Global warming potential, (b) EP and (c) AP of the finishing parameters lean-meat content, daily weight gain, animal losses and feed conversion ratio. Parameters were varied in units of quantiles, where 50% represents the base scenario.

The estimation of the GWP for a varied lean-meat content resulted in values ranging from 3·31 to 3·14 kg CO2-eq/kg pork. The EP varied within 24·0 and 22·7 g PO4-eq/kg pork (Fig. 4(b)). The results of the AP showed similar changes (58·8–55·4 g SO2-eq/kg pork).
The maximal increase or decrease in the GWP for a variation of 10 and 90% quantiles of the daily weight gain was 0·3% compared to the base scenario. The EP and AP almost showed the same level of changes with values of 23·4–23·3 g PO4-eq and 57·1–57·1 g SO2-eq/kg pork.
The values of the impact categories assessed in connection with the animal losses did not differ greatly. The GWP was in the range of 3·20–3·24 kg CO2-eq/kg pork (Fig. 4(a)). The EP and AP showed the same tendencies (Figs 4(b) and (c)).
The resulting values from a changed feed conversion ratio for the different impact categories showed the highest variations within the finishing parameters, as visible in Figs 4(a) to (c). The GWP differed from 3·09 up to 3·36 kg CO2-eq/kg pork. Hence, a lower feed conversion ratio decreased the GWP by 4·1%, whereas an increased parameter resulted in a 4·2% higher GWP, when compared to the base scenario. The EP and AP had the same trends. The EP resulted in values of 22·4–24·3 g PO4-eq/kg pork. The calculation of the AP finished within a range of 54·4–59·8 g SO2-eq/kg pork.
Altogether, the changes of the lean-meat content and the daily weight gain resulted in an almost linear decrease in the impact categories (Figs 4(a) to (c)), whereas the trend of the lean-meat content was more marked. The changed animal losses resulted in an approximately linear increase in the GWP, but within a small range. The feed conversion ratio, in contrast, increased within the greatest range of the finishing parameters and tended to show a linear trend.
DISCUSSION AND CONCLUSIONS
Impact categories
The present study focused on the most commonly used impact categories: global warming, eutrophication and acidification. However, the LCA methodology used does provide more categories which could potentially be assessed. One currently discussed impact category is land use and it should therefore be dealt with as an example for discussion. Since the global livestock sector already uses around 0·70 of agricultural land (Steinfeld et al. Reference Steinfeld, Gerber, Wassenaar, Castel, Rosales and de Haan2006), land use and land use change (LUC) are important parameters which should be incorporated in future assessments (Flysjö et al. Reference Flysjö, Cederberg, Henriksson and Ledgard2012). However, Flysjö et al. (Reference Flysjö, Cederberg, Henriksson and Ledgard2012) highlighted that there is no common methodology yet available to account for land use and LUC. The assessment of four different methods to include LUC showed extremely varying results. This is why most of the hitherto published LCA studies do not include LUC. The present study focused on the pig housing stage, in which land use plays a minor role. Thus, it was decided not to include land use or LUC. Nevertheless, the current authors agree with Flysjö et al. (Reference Flysjö, Cederberg, Henriksson and Ledgard2012) that it is becoming increasingly important to incorporate emissions related to land use and LUC when further examining e.g. the feeding stage. Recent literature (Stephenson Reference Stephenson2010; Meul et al. Reference Meul, Ginneberge, van Middelaar, de Boer, Fremaut and Haesaert2012) has demonstrated that the GWP of various pig diets would increase by 3·9–13·1% when direct LUC (relates to the conversion of land directly attributed to the production of one or more feed ingredients) was included. Moreover, the inclusion of direct and indirect LUC (indirect LUC accounts for the conversion of land that is induced by changes in production of or demand for one or more feed ingredients) would increase the GWP by 24·4–34·4% (Meul et al. Reference Meul, Ginneberge, van Middelaar, de Boer, Fremaut and Haesaert2012).
Pig farm model
Various different whole-farm models already exist to simulate greenhouse gas emissions for dairy farms, such as DairyWise (Schils et al. Reference Schils, de Haan, Hemmer, van den Pol-Van Dasselaar, de Boer, Evers, Holshof, van Middelkoop and Zom2007a ), FarmGHG (Olesen et al. Reference Olesen, Schelde, Weiske, Weisbjerg, Asman and Djurhuus2006), SIMSDAIRY (Del Prado et al. Reference del Prado, Misselbrook, Chadwick, Hopkins, Dewhurst, Davison, Butler, Schröder and Scholefield2011), Integrated Farm System model (IFSM) (Rotz et al. Reference Rotz, Corson, Chianese, Montes, Hafner and Coiner2012) and FarmSim (Salètes et al. Reference Salètes, Fiorelli, Vuichard, Cambou, Olesen, Hacala, Sutton, Fuhrer, Soussana, Kaltschmitt and Weiske2004), some of which have been compared in Schils et al. (Reference Schils, Olesen, del Prado and Soussane2007b ). But there are only few holistic models available for pork production to date, for instance Farm Assessment Tool (FASSET) (Jacobsen et al. Reference Jacobsen, Petersen, Berntsen, Boye, Sørensen, Søgard and Hansen1998) and MELODIE (Chardon et al. Reference Chardon, Rigolot, Baratte, Espagnol, Raison, Martin-Clouaire, Rellier, Le Gall, Dourmad, Piquemal, Leterme, Paillat, Delaby, Garcia, Peyraud, Poupa, Morvan and Faverdin2012). Most of the models highlighted also account for sustainability farm attributes of biodiversity, landscape, product quality and animal welfare (Del Prado et al. Reference del Prado, Misselbrook, Chadwick, Hopkins, Dewhurst, Davison, Butler, Schröder and Scholefield2011; Chardon et al. Reference Chardon, Rigolot, Baratte, Espagnol, Raison, Martin-Clouaire, Rellier, Le Gall, Dourmad, Piquemal, Leterme, Paillat, Delaby, Garcia, Peyraud, Poupa, Morvan and Faverdin2012). The pig farm model presented in the current study was a concept to develop a whole-farm model to predict all relevant flows on a farm which potentially influence the sustainability of pork production. It was able to include interactions and dependencies between different farm components. To date, the pig farm model has focused on N and P flows on the pig farm, direct and indirect emissions related to manure management (including in-house and outside storage, application of manure to field and avoided production and application of mineral fertilizers), energy use and animal or farm performances. Since the current study focused on environmental impacts affecting global warming, eutrophication and acidification, this approach could be extended in respect of other assessment aspects. It would be desirable to build similar models for pig farms which include additional parameters, or rather to extend the pig farm model presented. For example, the pig farm model provided a basis for economic aspects, which could be expanded in future assessments to generate a holistic economic picture of pig farms. Other assessment parameters to be included could be animal welfare, biodiversity or social aspects. Overall, the implementation of the pig farm model was an important step in establishing a basis for the assessment of different management practices.
Results
Even if a direct comparison between studies was hindered due to differences in methodological choices (e.g. functional unit, system boundaries, allocation method), the results of the base scenario were in line with those from recent European studies (Dalgaard et al. Reference Dalgaard, Halberg and Hermansen2007; Stephenson Reference Stephenson2010; Nguyen et al. Reference Nguyen, Hermansen and Mogensen2011). Moreover, the results of the alternative scenarios for the piglet production stage highlighted that an increased number of piglets per litter and year could decrease the GWP, EP and AP by up to 1·8%. The decline was due to increased system efficiency, where the impacts of a sow could be allocated to a higher number of piglets. Even though feed intake rises with increasing number of piglets per sow, more meat is produced with less ‘fixed environmental costs’ (from e.g. feed, manure and energy). Thereby, environmental impacts decrease. Regarding the marginal decline of impact category values, it has to be considered that the uncertainty of such results might be relatively high. The level of uncertainty has not been tested in the current study, but it is known that there are actual differences of each scenario, potentially influencing the final results. The analysis showed that the number of piglets born alive increased from 13·7 (base scenario) to 16·3 (90% quantile), resulting in an increase of 18·8% in the amount of meat produced. Thereby, the in- and outputs per kg pork remained almost the same. Only the shares of heating, NH3 emissions from manure, lactating feed and partly finishing feed were affected per kg pork. Kleanthous (Reference Kleanthous2009) confirmed that an increasing number of litters weaned could lower the environmental impacts of the pork supply chain. Even if Kleanthous (Reference Kleanthous2009) used another parameter (number of litters weaned per sow and year), the fact that the amount of meat increased as well as the feed needed by the sow to raise the piglets were the same in the present study.
Additionally, the results identified the feed conversion ratio as the parameter of the finishing stage which affected the results the most. This was not surprising, since several European LCA studies on pork have already highlighted feed production as having a considerable impact on the results (Basset-Mens & van der Werf Reference Basset-Mens and van der Werf2005; Basset-Mens et al. Reference Basset-Mens, van der Werf, Robin, Morvan, Hassouna, Paillat and Vertès2007; Kingston et al. Reference Kingston, Meyhoff Fry and Aumonier2009; Sonesson et al. Reference Sonesson, Cederberg and Berglund2009; Nguyen et al. Reference Nguyen, Hermansen and Mogensen2011; Reckmann et al. Reference Reckmann, Traulsen and Krieter2013). The feed conversion ratio was the parameter from the pig housing stage which naturally had the greatest influence on the feed used to produce pork. When comparing inputs and outputs of the base scenario and the 10% quantile of feed conversion ratio, the amount of meat produced increased by only 1%. Despite this, when results were recalculated per kg pork, transports, N in manure, NH3 emissions from manure and the amount of finishing diets used increased slightly. Calculating shared GWP impacts of both scenarios identified that direct emissions, feed for gestating sows, finisher feeds and manure use as fertilizer were affected. Therefore, shares of total GWP decreased compared to the base scenario. Moreover, the considerable effect of lean-meat content on the results was not a direct effect on inputs and outputs, but an indirect effect due to the feed conversion ratio being greatly influenced through joint probabilities. Overall, it was demonstrated that the feed conversion ratio is one of the most important parameters on the pig farm to influence the highly pollutant feeding stage. Also Dalgaard et al. (Reference Dalgaard, Halberg and Hermansen2007) mentioned that the combination of an increased number of weaned piglets per sow, decreased feed conversion ratio and reduced use of electricity and heat in pig housing could lower the environmental impacts of pork by up to 11%.
Another noticeable characteristic of the results was the shape of the trends from the impact categories. Most of the parameters showed an approximately linear trend; however, the number of piglets born alive per litter was the only parameter whose variations resulted in a non-linear course of the trends. One possible explanation was that the parameter was calculated over ten litters with non-linear patterns in the pig farm model. Therefore, a certain range of values was changed as part of the variations, not just a single value. This could potentially influence the shape of the course.
In conclusion, the results highlighted that a maximal decrease of 4·7% would be possible via a lower feed conversion ratio. This reflected an AP of 54·4 g SO2-eq/kg pork. This decrease was reached by a variation of the feed conversion ratio which could be achieved practically, taking into account biological and management aspects. Additionally, when the management strategies of the farrowing and the finishing stage were combined, a decrease of 6% in the GWP could be achieved. Nevertheless, it has to be considered that the effect on environmental impacts was only one aspect of the sustainability of pork. Aspects of animal welfare and health had to be considered as well, especially when increasing e.g. the number of piglets born alive per litter. For that, some first steps were made to improve the sustainability of pork in terms of pig housing. Overall, the fertility of sows and the feed management were identified as the main parameters at pig farm level that influenced the environmental impact of pork production.
The supplementary material for this article can be found at http://www.journals.cambridge.org/AGS
The authors gratefully acknowledge the financial support of the ZDS e.V. and the Landwirtschaftliche Rentenbank. The paper benefited from comments of anonymous reviewer.