Implications
A lot of studies have been conducted to investigate the effects of prebiotics on intestinal microbial populations, digestive and systemic health, immune function and growth performance in humans, poultry, dogs, cats, pigs, horses, cows, calves and lambs. However, there is no information on the effects of supplemental inulin and other prebiotic compounds in kids. This study aims to evaluate the effects of inulin supplementation on selected faecal characteristics and health status of kids. According to the results of our study, the dose of 0.6 g inulin/day for kids is not enough to observe effects of it. The findings of our study will be useful to help further explore the dose and timing of inulin supplementation for the purpose of improving performance and health status in kids.
Introduction
Prebiotics are defined as non-digestible carbohydrates that beneficially affect the host by selective modification of the composition of the intestinal microflora (Propst et al., Reference Propst, Flickinger, Bauer, Merchen and Fahey2003; Gaggìa et al., Reference Gaggìa, Mattarelli and Biavati2010). Fructans are one of the most popular prebiotic supplements available and include short-chain fructooligosaccharides (scFOS), oligofructose (OF) and inulin (Flickinger et al., Reference Flickinger, Van Loo and Fahey2003a and Reference Flickinger, Schreijen, Patil, Hussein, Grieshop, Merchen and Fahey2003b).
Fructans are fermented by beneficial types of colonic bacteria (Lactobacillus and Bifidobacterium) and have the potential to prevent the invasion of pathogenic bacterial species (Escherichia coli, Clostridium species and Salmonella species; Flickinger et al., Reference Flickinger, Van Loo and Fahey2003a; Barry et al., Reference Barry, Hernot, Middelbos, Francis, Dunsford, Swanson and Fahey2009). Colonic fermentation of fructans by beneficial microflora increases the production of short-chain fatty acids (SCFA), acetate, propionate and butyrate (Saavedra, Reference Saavedra2005; Barry et al., Reference Barry, Hernot, Middelbos, Francis, Dunsford, Swanson and Fahey2009). SCFA are bactericidal substances (De Vrese and Marteau, Reference De Vrese and Marteau2007) and increased SCFA production lowers pH in the colon, which suppresses the growth of potential pathogens (Swanson et al., Reference Swanson, Grieshop, Flickinger, Bauer, Healy, Dawson, Merchen and Fahey2002a; Barry et al., Reference Barry, Hernot, Middelbos, Francis, Dunsford, Swanson and Fahey2009).
Studies in humans and animals have shown that fructans can alter intestinal microbial populations, pH and SCFA concentrations and have the potential to positively affect host health, immune function and animal performance (digestion, BW gain, feed efficiency; Buddington et al., Reference Buddington, Kelly-Quagliana, Buddington and Kimura2002; Saavedra and Tschernia, Reference Saavedra and Tschernia2002; Schley and Field, Reference Schley and Field2002; Masanetz et al., Reference Masanetz, Preißinger, Meyer and Pfaff2011). However, data on the efficacy of fructans are variable owing to the type of fructans and basal diet used and animal characteristics (species, age, stage of production, health status) and are not yet fully conclusive (Schley and Field, Reference Schley and Field2002; De Vrese and Marteau, Reference De Vrese and Marteau2007).
There has been a growing demand for goat products such as goat milk, cheese and kid meat throughout the world in recent years (İnce, Reference İnce2010). Turkey is among the leading countries of the world in terms of goat population. In the last few years, interest in Saanen goats has grown in Turkey because of their high productivity in terms of milk production and multiple births (Ocak and Güney, Reference Ocak and Güney2010). The most important income of Turkish goat breeders is provided by milk production and sale of kids (Koşum et al., Reference Koşum, Alçıçek, Taşkın and Önenç2003). Kid losses are one of the main factors that has a negative effect on productivity in goat breeding (Ayı;şı;ğı; et al., Reference Ayışığı, Ataşoğlu, Yurtman, Mendeş and Pala2005).
Diarrhoeal diseases are considered to be one of the most common causes of neonatal kid loss throughout the world (Smith and Sherman, Reference Smith and Sherman2009). Infectious agents, such as E. coli, Salmonella species, Clostridium species, Cryptosporidium species and rotavirus, and nutritional problems, less common, can cause diarrhoea in neonatal kids (Kritas et al., Reference Kritas, Burriel, Tzivara, Govaris, Kyriakis, Karatzias and Vlemmase2003; Smith and Sherman, Reference Smith and Sherman2009). Mul (Reference Mul1997) and De Vrese and Marteau (Reference De Vrese and Marteau2007) reported that fructans can contribute to the prophylactic prevention of diarrhoea.
Prebiotics have been used in nutrition research with canines (Verlinden et al., Reference Verlinden, Hesta, Hermans and Janssens2006; Apanavicius et al., Reference Apanavicius, Powell, Vester, Karr-Lilienthal, Pope, Fastinger, Wallig, Tappenden and Swanson2007), felines (Hesta et al., Reference Hesta, Hoornaert, Verlinden and Janssens2005), poultry (Xu et al., Reference Xu, Hu, Xia, Zhan and Wang2003), swine (Yasuda et al., Reference Yasuda, Maiorano, Welch, Miller and Lei2007), horses (Bailey et al., Reference Bailey, Menzies-Gow, Harris, Habershon-Butcher, Crawford, Berhane, Boston and Elliot2007), young ruminants (Kaufhold et al., Reference Kaufhold, Hammon and Blum2000; Heinrichs et al., Reference Heinrichs, Jones and Heinrichs2003) and adult ruminants (Franklin et al., Reference Franklin, Newman, Newman and Meek2005). Although some prebiotics such as scFOS, OF, inulin, mannanoligosaccharides (MOS) and galactooligosaccharides have been supplemented to cows (Mwenya et al., Reference Mwenya, Santoso, Sar, Pen, Morikawa, Takaura, Umetsu, Kimura and Takahashi2005), calves (Masanetz et al., Reference Masanetz, Preißinger, Meyer and Pfaff2011) and lambs (Thayne, Reference Thayne2007) and some information is available on the effects of feeding prebiotics in selected species mentioned above (Swanson et al., Reference Swanson, Grieshop, Flickinger, Bauer, Healy, Dawson, Merchen and Fahey2002a), there is no information on the effects of supplemental inulin in kids.
Inulin is a group of fructooligosaccharides (FOS) with chain lengths varying between 3 and 65 monomers (Apanavicius et al., Reference Apanavicius, Powell, Vester, Karr-Lilienthal, Pope, Fastinger, Wallig, Tappenden and Swanson2007) and may be fermented more slowly in the colon as it has a higher degree of polymerization compared with scFOS and OF (Flickinger et al., Reference Flickinger, Schreijen, Patil, Hussein, Grieshop, Merchen and Fahey2003b; Bosscher, Reference Bosscher2009). It has been shown that slowly fermenting fructans can be tolerated more easily than faster fermenting fructans (Bosscher, Reference Bosscher2009), which may prevent adverse side effects, such as diarrhoea and flatulence, because of excessive amount of fermentation by colonic bacteria within a short time in neonatal kids under stress and at greatest risk of dehydration and hypothermia. Because of the aspect indicated above, we decided to use inulin in the current study.
The aim of the study was to evaluate the effects of inulin supplementation on faecal score, faecal pH, selected faecal bacterial population, BW, body temperature, haematological traits, selected health parameters and the incidence of diarrhoea in kids.
Material and methods
Study area and animals
The study was carried out at Uludag University Applied Research Center for Veterinary Faculty Unit in Bursa, located within the North West Turkey, 40° north latitude, 29° east longitude and at an altitude of 120 m above sea level. All animals were handled according to the European Union directive number 86/609/EEC concerning the protection of animals used for experimental and other scientific purposes. In addition, this study was conducted under an approved protocol by Animal Care and Use Committee of University of Uludag.
Fifty newborn Saanen kids (21 male and 29 female) were used in this study. The animals were sorted by parity of their dams and multiple birth (twin or triplet) and assigned to one of the two groups (control: CG, and experimental: EG) at birth. Each group consisted of 25 kids. The groups were allotted with regard to sex (CG: 10 male and 15 female; EG: 11 male and 14 female) and birth weight (CG: 3.06 ± 0.32 kg; EG: 3.17 ± 0.24 kg). There were 19 kids born as twin and 6 kids born as triplet in both CG and EG.
Management and experimental design
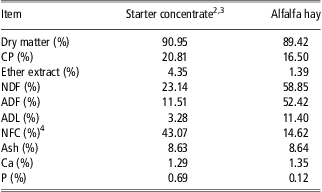
The kids were housed with their dams in a paddock equipped with feeders and waterers, with straw bedding, for the first 20 days after birth. The kids and their dams had free access to drinking water. At 20 days of age, kids were separated from their dams and housed in another paddock equipped with feeders and waterers, with straw bedding, until weaning (60 days after birth). During the suckling period from day 20 to 60, kids were given 12 h access to the dam. Water, pelleted starter concentrate (Matli Feed Industry, Karacabey, Turkey) and alfalfa hay were supplied ad libitum. Nutrient compositions of pelleted starter concentrate and alfalfa hay are presented in Table 1. During the suckling period, kids were closely monitored to ensure sufficient sucking. Uniform feeding and management standards were applied in both groups.
Nutrient compositions of starter concentrate and alfalfa hay on a dry matter basisFootnote 1
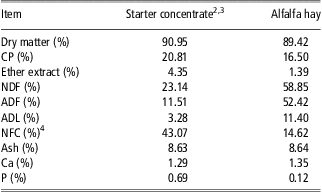
NFC = Nonfiber carbohydrate; Ca = calcium; P = phosphorus.
1 Nutrient analyses of the feeds were performed according to the Association of Official Analytical Chemists (AOAC, 1990).
2 Matli Feed Industry, Karacabey, Turkey.
3 Contained the main ingredients: ground corn grain, rolled barley, wheat bran, soya bean oil, soya bean meal, corn gluten meal, sunflower meal, molasses, mineral and vitamin mix, limestone, salt.
4 NFC = 100 − (% NDF + % CP + % ether extract + ash).
All kids were fed colostrum for the first 3 days after birth, and then the kids in EG were adapted to inulin supplementation by an increased dosage from day 4 to 7. Each kid in EG was supplemented with 0.2 g, 0.3 g, 0.4 g, 0.5 g and 0.6 g inulin (Orafti® GR, BENEO-Orafti S.A., Tienen, Belgium) on day 4, 5, 6, 7 and from day 8 to 28, respectively, whereas the kids in CG did not receive inulin. Inulin (0.6 g) dissolved in 10 ml of distilled water was administered orally to the kids in EG via a syringe. Thus, the kids in EG could receive the daily dose of inulin. In previous studies with young livestock such as calves (Heinrichs et al., Reference Heinrichs, Jones and Heinrichs2003; Hill et al., Reference Hill, Bateman, Aldrich and Schlotterbeck2008; Masanetz et al., Reference Masanetz, Preißinger, Meyer and Pfaff2011), lambs (Thayne, Reference Thayne2007; Milewski et al., Reference Milewski, Sobiech, Bednarek, Wojcik, Malaczewska, Zaleska and Siwicki2010) and pigs (Davis et al., Reference Davis, Maxwell, Erf, Brown and Wistuba2004; Lynch et al., Reference Lynch, Sweeney, Callan and O'Doherty2007), prebiotics were added to milk replacer or concentrate feed of suckling or weanling animals. However, prebiotics have not been supplemented to animals sucking milk from their dams through oral gavage. Orafti® GR contained 93.4% of inulin on a dry matter basis (96.6% dry matter). Potential adverse side effects, such as diarrhoea and flatulence, may occur in animals consuming high levels of fructans or at moderate levels of ingestion in unadapted animals (Propst et al., Reference Propst, Flickinger, Bauer, Merchen and Fahey2003). In addition, no information exists regarding daily doses of inulin and other prebiotic compounds for kids. Thus, the kids in EG were adapted to inulin supplementation by an increased dosage from day 4 to 7. In the current study, daily dose of inulin was based on the concentrations of prebiotics added to milk replacer in a previous study using calves (Hill et al., Reference Hill, Bateman, Aldrich and Schlotterbeck2008). Barry et al. (Reference Barry, Hernot, Middelbos, Francis, Dunsford, Swanson and Fahey2009) suggested that beneficial effects of fructans are not observed unless dietary concentrations are above 0.4% of dry food (as fed basis) in dogs. The suggestion of Barry et al. (Reference Barry, Hernot, Middelbos, Francis, Dunsford, Swanson and Fahey2009) and high content of prebiotics (oligosaccharides) in goat milk (25 to 30 mg/100 ml; Martínéz-Férez et al., Reference Martínéz-Férez, Rudolff and Guadix2005) were also determinant in deciding daily dose of inulin.
Faecal score, faecal pH and selected faecal bacterial population
Faecal samples were collected from each kid by retrieval from the rectum on day 14, 21 and 28 at 0900 h. Faecal samples were scored with regard to consistency by the same researcher on all collection days according to the following system: 1 = watery, diarrhoea; 2 = soft, unformed; 3 = soft, formed; 4 = hard, formed; and 5 = hard, dry pellets. Faecal pH was measured immediately following the collections. An electronic pH meter (PT-10, Sartorius AG, Goettingen, Germany) fitted with a glass electrode was used to determine faecal pH. Each faecal sample was placed in a 50 ml glass beaker and diluted 10-fold with distilled water as described by Verlinden et al. (Reference Verlinden, Hesta, Hermans and Janssens2006). The mixture of faecal sample and distilled water was homogenized and pH was measured.
For selected faecal microbial analysis, 10 healthy kids were randomly selected in each group after all kids were clinically examined (body temperature, respiration and pulsation rates) and monitored in respect to diarrhoea. Fresh faecal samples were collected from 10 kids in each group on day 29 at 0900 h through retrieval from rectum using sterile gloves. Following collection, faecal samples were placed in sterile sampling bags, immediately packed in ice and transported to the microbiology laboratory for bacterial enumeration (total Clostridia, E. coli and total coliform). One g of faecal sample from each animal was aseptically transferred into a sterile stomacher bag and homogenized with 9 ml of saline peptone water in a Stomacher 80 Lab System (Seward® Inc., Port Saint Lucie, FL, USA) for 2 min. Serial 10-fold dilutions were made in saline peptone water and plated onto relevant selective media. Total coliform was grown on Violet Red Bile (VRB, Oxoid CM0107, Basingstoke, Hampshire, UK) agar using the pour plate technique and the plates with 30 to 300 colonies were used for enumeration after 24 to 48 h of incubation at 37°C. All red colonies with or without halos, except pinpoint colonies, were recorded as coliform. The red colonies with halos are typical for E. coli. The colonies typical for E. coli were enumerated and inoculated Lactose Broth (LB, Oxoid CM0137, Basingstoke, Hampshire, UK) with Durham tube. After 24 to 48 h of incubation at 44°C, gas and lactic acid production positive tubes were streaked onto Eosin Methylen Blue (EMB, Oxoid CM0069, Basingstoke, Hampshire, UK) agar and confirmed to be E. coli by biochemical tests, such as Indol (SIM, Merck 1.05470, Darmstadt, Germany), Methyl red and Voges-Proskauer (MR-VP, Merck 1.05712, Darmstadt, Germany) and Citrate (Oxoid CM0155, Basingstoke, Hampshire, UK). Indol positive, MR positive, VP negative and Citrate negative indicated the presence of E. coli type-1. For Clostridia enumeration, 1 ml of the dilutions until 10−6 was plated in the tubes containing Sulfite Polymyxin Sulfadiazine (SPS, Merck 1.10235, Darmstadt, Germany) agar. The top of the tubes was covered with paraffin, and serial dilutions in the tubes were incubated at 35°C to 37°C for 24 to 48 h in anaerobic jars, using Gas Generating (Oxoid BR038, Basingstoke, Hampshire, UK) kit. After the incubation, the colonies typical for Clostridium species were enumerated. The bacterial counts were expressed as log10 cfu per gram of faecal samples.
BW, body temperature and haematology
Kids were weighed on birth day, day 14, 21, 28 and 60 at 0900 h. Body temperature was measured on day 14, 21 and 28 at 30 min after inulin supplementation.
On day 29 at 0900 h, blood samples were collected from 10 healthy kids in each group via jugular puncture in 10 ml evacuated tubes containing ethylenediaminetetraacetic acid for total white blood cell (WBC) count, neutrophil, lymphocyte and monocyte concentrations and haematocrit value. The kids sampled for haematological analysis were the same animals that were selected to sample for faecal bacterial analysis. Total WBC count was determined in whole blood by means of the chamber counting method developed for counting blood cells. Total WBC in the whole of cross-ruled area of the Thoma counting chamber was counted. Neutrophil, lymphocyte and monocyte concentrations as percentage of total WBC were determined by staining a smear of the blood with Diff-quick stain (May-Grunwald-Giemsa dyes), allowing the different types of WBC to be clearly seen under the microscope. Haematocrit value was determined directly by centrifuging blood in a microhaematocrit tube at 10,000 × g for 5 min.
Health status and the incidence of diarrhoea
Health status of kids was monitored daily during the period from birth to weaning by diagnosing pneumonia and diarrhoea. Kids treated for pneumonia and diarrhoea were recorded. Faecal scores of 1 and 2 were considered to be diarrhoea. In addition, tail and/or hind limbs stained with faeces were evaluated as a finding of diarrhoea. Mortality of kids from birth to weaning was recorded.
Statistical analysis
All statistical analyses were conducted by using Statistical Package for the Social Sciences software (SPSS, 2004). Data for faecal score and faecal pH were tested to determine normal distribution by F-test. Faecal scores and faecal pH were analysed by two-sample t-test. The statistical analyses for faecal bacterial populations and haematological traits were performed using the Mann–Whitney test. Data for BWs were tested to determine normal distribution by Kolmogorov–Smirnov test. BWs were tested for homogeneity of variance. The statistical analyses for BWs and body temperatures were performed by independent samples t-test. The incidences of diarrhoea were analysed by χ 2 test. Differences between groups were considered significant when P-values were <0.05.
Results
Faecal score, faecal pH and selected faecal bacterial population
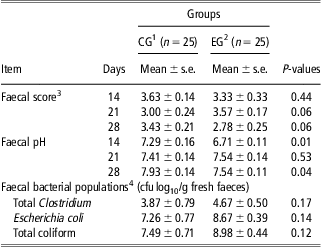
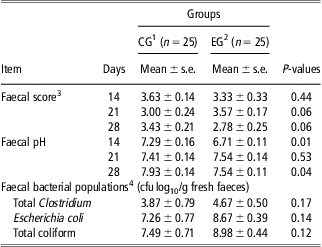
Faecal scores were not different (P > 0.05) between groups (Table 2). There were differences in faecal pH on day 14 (P = 0.01) and 28 (P < 0.05), whereas no difference in faecal pH on day 21 (P > 0.05) was detected between groups (Table 2). Faecal bacterial populations (total Clostridium, E. coli and total coliform) were not different (P > 0.05) between groups (Table 2).
The effects of inulin supplementation on faecal score, faecal pH and faecal bacterial populations of kids
1Control group.
2Group supplemented with inulin.
3Faecal scoring system: 1 = watery, diarrhoea; 2 = soft, unformed; 3 = soft, formed; 4 = hard, formed; and 5 = hard, dry pellets.
4Bacterial populations in sterile faeces sampled from a subset (n = 10) of healthy kids in each group on day 29.
BW, body temperature and haematology
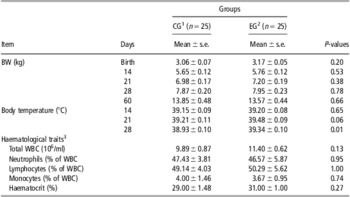
No differences (P > 0.05) in BW were found between groups (Table 3). Body temperature did not differ on day 14 and 21 (P > 0.05), whereas there was a difference in body temperature on day 28 (P = 0.01) between groups (Table 3). There were no differences (P > 0.05) in total WBC count, neutrophil, lymphocyte and monocyte concentrations (% of WBC) and haematocrit value between groups (Table 3).
The effects of inulin supplementation on BW, body temperature and haematological traits of kids

WBC = white blood cell.
1Control group.
2Group supplemented with inulin.
3Haematological traits in blood samples collected from a subset (n = 10) of healthy kids in each group on day 29.
Health status and the incidence of diarrhoea
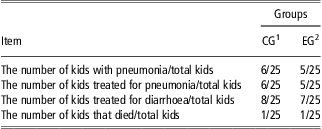
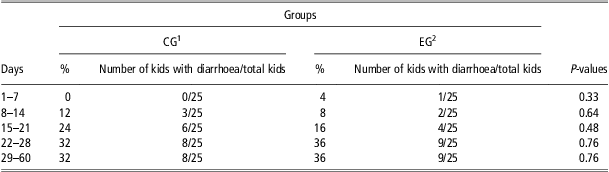
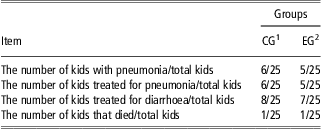
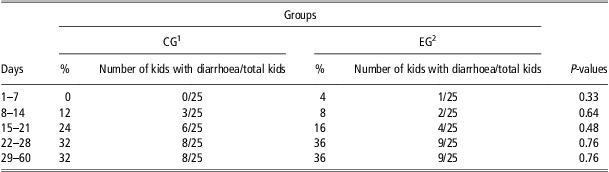
Pneumonia developed in 6 of 25 and 5 of 25 kids in CG and EG, respectively, during the study. The numbers of kids treated for pneumonia were six and five in CG and EG, respectively. The kids that developed pneumonia were the same as the kids treated for pneumonia. The numbers of kids treated for diarrhoea were eight and seven in CG and EG, respectively. The number of kids that died during the study was one in both CG and EG (Table 4). No difference (P > 0.05) in the incidence of diarrhoea was found between groups (Table 5).
The number of kids with pneumonia, kids treated for pneumonia and diarrhoea and kids that died during the period from birth to weaning
1Control group.
2Group supplemented with inulin.
The effects of inulin supplementation on the incidence of diarrhoea of kids
1Control group.
2Group supplemented with inulin.
Discussion
Faecal score, faecal pH and selected faecal bacterial population
Faecal scores were similar between groups in the current study (Table 2). The result of faecal score in our study was in agreement with the data reported by Propst et al. (Reference Propst, Flickinger, Bauer, Merchen and Fahey2003), who supplemented OF or inulin to adult dogs, and by Hill et al. (Reference Hill, Bateman, Aldrich and Schlotterbeck2008), who investigated effects of feeding FOS and MOS in dairy calves. Excessive amount of fermentation of fructans by colonic bacteria can lead to increased gas formation, abdominal cramps and loose faeces. This effect is strictly related to dose of fructans (Saavedra, Reference Saavedra2005). Verlinden et al. (Reference Verlinden, Hesta, Hermans and Janssens2006) reported that inulin supplementation lowered faecal score (loose faeces) in adult dogs but the decrease in faecal score had no clinical importance because it remained in an acceptable range and was not associated with diarrhoea. In our study, a lower faecal score would indicate formation of softer faeces and the dose of inulin supplemented to the kids in EG did not adversely affect faecal score.
In the current study, faecal pH was lower for EG in comparison to CG on day 14 and 28 (Table 2). Inulin is a highly fermentable substrate (Propst et al., Reference Propst, Flickinger, Bauer, Merchen and Fahey2003) and SCFA produced in response to inulin fermentation in the colon may decrease faecal pH (Younes et al., Reference Younes, Coudray, Bellanger, Demigne, Rayssiguier and Remesy2001). Hesta et al. (Reference Hesta, Janssens, Debraekeleer and De Wilde2001) observed that faecal pH was decreased in adult cats when 6% or 9% OF was added to the diet, but there was no significant decrease in faecal pH when 3% or 6% inulin was added to the diet. As inulin has a higher degree of polymerization compared with OF, Hesta et al. (Reference Hesta, Janssens, Debraekeleer and De Wilde2001) suggested a slower fermentation of inulin in the relatively short colon of cats. Verlinden et al. (Reference Verlinden, Hesta, Hermans and Janssens2006) also reported that inulin supplementation did not affect faecal pH in adult dogs. We suggested that inulin supplementation had no consistent effect on faecal pH in the current study as there was no difference in faecal pH on day 21 between groups, whereas EG had a lower faecal pH than CG on day 14 and 28 (Table 2).
As sterile faecal sample could not be collected from all healthy kids on day 29, sterile faeces were sampled from a subset of healthy kids in each group. In the current study, there were no differences (P > 0.05) in concentrations of faecal total Clostridium, E. coli and total coliform between groups (Table 2). Barry et al. (Reference Barry, Hernot, Middelbos, Francis, Dunsford, Swanson and Fahey2009) reported similar results for concentration of faecal E. coli in adult dogs when 0.2% or 0.4% inulin was added to the diet. Lynch et al. (Reference Lynch, Sweeney, Callan and O'Doherty2007) observed that inulin supplementation did not change E. coli concentration in the colon of pigs. Bunce et al. (Reference Bunce, Howard, Kerley and Allee1995) reported that 3 or 7 g/day OF supplemented to calves did not significantly decrease faecal concentrations of total Clostridium and E. coli. Swanson et al. (Reference Swanson, Grieshop, Flickinger, Bauer, Healy, Dawson, Merchen and Fahey2002a) reported no significant differences in faecal bacterial populations of adult dogs among groups with FOS (2 g/day), MOS (2 g/day), FOS (2 g/day) plus MOS (2 g/day) and without prebiotics. Lower pH values are generally associated with a reduction in the growth of potentially pathogenic bacteria (Flickinger et al., Reference Flickinger, Van Loo and Fahey2003a). It was likely that lower faecal pH values for EG in our study were not enough to decrease faecal concentrations of total Clostridium, E. coli and total coliform. A higher dose than 0.6 g inulin/day may be necessary to change these bacterial populations in kid faeces. Barry et al. (Reference Barry, Hernot, Middelbos, Francis, Dunsford, Swanson and Fahey2009) reported that measurable changes can be observed in bacterial populations after 10 days of dietary adaptation. In the current study, sterile faecal samples were collected on day 29, which should have allowed enough time for bacterial populations to adapt to inulin.
BW, body temperature and haematology
In this study, inulin supplementation had no significant effect on BW in kids (Table 3). A satiety effect of prebiotic supplementation can jeopardize the attempt to increase BW gain in livestock (Gaggìa et al., Reference Gaggìa, Mattarelli and Biavati2010). Kaufhold et al. (Reference Kaufhold, Hammon and Blum2000) reported that BW only tended to be higher in the calves receiving FOS supplementation lasting for 3 weeks than control calves. Hill et al. (Reference Hill, Bateman, Aldrich and Schlotterbeck2008) reported no improvement in BW gain of dairy calves fed milk replacer containing FOS or MOS. In contrast, Mul (Reference Mul1997) reported that 2 to 5 g/kg OF added to milk replacer diets of calves improved BW gain. Xu et al. (Reference Xu, Zuo, Hu, Xia, Zhan and Wang2002) reported that 4 or 6 g/kg FOS added to the diet improved BW gain in growing pigs. The results of prebiotic supplementation on the growth performance (BW, BW gain and feed efficiency) of livestock are often contradictory and mostly affected by the compound chosen, the dietary supplementation level, duration of use and the environmental and stress status of the animals (Gaggìa et al., Reference Gaggìa, Mattarelli and Biavati2010). The low or absent effect on growth performance in animals supplemented with prebiotics can be due to enough prebiotic compounds in the basal diet (Flickinger et al., Reference Flickinger, Van Loo and Fahey2003a; Gaggìa et al., Reference Gaggìa, Mattarelli and Biavati2010). In the current study, the absent effect of inulin on BW in suckling kids may be due to high content of prebiotics in goat milk (25 to 30 mg/100 ml; Martínéz-Férez et al., Reference Martínéz-Férez, Rudolff and Guadix2005) and the period of inulin supplementation (25 days) being too short.
Body temperature is a useful indicator of describing the health status of animals (Ayı;şı;ğı; et al., Reference Ayışığı, Ataşoğlu, Yurtman, Mendeş and Pala2005). Increased body temperature is an early sign of infection (Apanavicius et al., Reference Apanavicius, Powell, Vester, Karr-Lilienthal, Pope, Fastinger, Wallig, Tappenden and Swanson2007). Normal body temperature in kids ranges from 38.8°C to 40.2°C (Jackson and Cockcroft, Reference Jackson and Cockcroft2002). During the current study, there were only two kids having a higher body temperature than 40.2°C in both CG and EG. It remained within an acceptable range, despite the fact that mean body temperature on day 28 was higher for EG in comparison to CG (Table 3). For eliminating stress of restraining and dosing the kids in EG, body temperature was measured at 30 min after inulin supplementation. As mean values of body temperature on day 14 and 21 were similar for CG and EG, a higher mean body temperature on day 28 for EG was not because of stress of restraining and dosing.
Blood samples were collected from a subset of healthy kids in each group. Total WBC counts, neutrophil, lymphocyte and monocyte concentrations (% of WBC) and haematocrit values were similar for CG and EG (Table 3). Mean values of all haematological traits were within reference ranges (Jackson and Cockcroft, Reference Jackson and Cockcroft2002) in both CG and EG. Swanson et al. (Reference Swanson, Grieshop, Flickinger, Bauer, Healy, Dawson, Merchen and Fahey2002a) reported that there were no significant changes in the total WBC count and neutrophil concentration in adult dogs supplemented with FOS (2 g/day), MOS (2 g/day) or FOS (2 g/day) plus MOS (2 g/day). However, adult dogs supplemented with MOS had a higher lymphocyte concentration than control dogs in their study. Davis et al. (Reference Davis, Maxwell, Erf, Brown and Wistuba2004) observed the increase in blood lymphocyte concentration and the decrease in blood neutrophil concentration when pigs were fed the diets supplemented with 0.3% MOS. The increase in blood lymphocyte concentration may be useful because of the increased level of protection from re-infection of a pathogen, whereas the decrease in blood neutrophil concentration may be a negative outcome of feeding prebiotics as neutrophils play a key role in the first line of defense against infectious organisms (Swanson et al., Reference Swanson, Grieshop, Flickinger, Healy, Dawson, Merchen and Fahey2002b; Davis et al., Reference Davis, Maxwell, Erf, Brown and Wistuba2004). Verlinden et al. (Reference Verlinden, Hesta, Hermans and Janssens2006) reported that 3% inulin added to the diet did not change blood neutrophil, lymphocyte and monocyte concentrations and haematocrit value in dogs. Masanetz et al. (Reference Masanetz, Preißinger, Meyer and Pfaff2011) reported no change in the total WBC count, blood neutrophil, lymphocyte and monocyte concentrations of calves fed the diet containing 2% inulin. The results of Verlinden et al. (Reference Verlinden, Hesta, Hermans and Janssens2006) and Masanetz et al. (Reference Masanetz, Preißinger, Meyer and Pfaff2011) were in agreement with those of our study. Studies where an immune challenge is presented may be conducted to determine whether changes in the concentrations of lymphocyte and neutrophil from blood immune characteristics are useful or harmful. Different haematological results on the effects of inulin or other prebiotic compounds may be obtained for kids facing an immune challenge.
Health status and the incidence of diarrhoea
The numbers of kids with pneumonia and kids treated for diarrhoea were similar for CG and EG. All kids with pneumonia were treated with antibiotics (Table 4). Kid losses (one in both CG and EG) during the study were evoked by pneumonia. In the current study, inulin supplementation did not affect the incidence of diarrhoea (Table 5). Prebiotics inhibit the growth of potentially pathogenic bacteria in the colon by increasing the production of SCFA and lowering pH (Flickinger et al., Reference Flickinger, Van Loo and Fahey2003a; Barry et al., Reference Barry, Hernot, Middelbos, Francis, Dunsford, Swanson and Fahey2009), which may decrease the incidence of diarrhoea caused by intestinal bacterial infections (De Vrese and Marteau, Reference De Vrese and Marteau2007; Heinrichs et al., Reference Heinrichs, Jones, Elizondo-Salazar and Terrill2009). The results of faecal bacterial populations in our study supported the conclusion that 0.6 g/day inulin did not decrease the incidence of diarrhoea in kids. Despite some promising results of animal experiments, there is not enough evidence to a successful use of prebiotics for the prevention or treatment of diarrhoea (De Vrese and Marteau, Reference De Vrese and Marteau2007). In general, the kids in the present study were healthy. Growth and health status were similar for both groups. Different results may be observed in kids facing a disease challenge or under stress.
Conclusion
Inulin supplemented to kids did not adversely affect faecal score. Inulin supplementation decreased faecal pH. However, this effect of inulin was not consistent. Inulin had no significant effects on selected faecal bacterial populations, BW, haematological parameters, health status and the incidence of diarrhoea. Weaning is a stressful event, which may compromise immune systems, due to change in the diet and is associated with undesirable changes in bacterial population in the intestine. Thus, the use of inulin may be more beneficial during the weaning period. We suggested that daily dose (0.6 g) of inulin for kids might not be enough to observe effects of it. Additional studies with supplementing during the weaning period and with higher doses and/or different durations of supplementation are required to evaluate whether the use of inulin for kids and other young ruminants positively affect performance and health status. The findings of our study will be useful to help further explore the dose and timing of inulin supplementation in kids.
Acknowledgements
The authors would like to thank Artı;san Feed Co., Ltd for procuring the product (inulin) and workers of Uludag University Applied Research Center for Veterinary Faculty Unit for help during the study.