INTRODUCTION
Coevolution and natural selection may shape the interactions among species by presenting an evolutionary trade-off between specializing to perform a few activities well, and generalizing to perform many activities fairly (Levins, Reference Levins1968; Brodie et al. Reference Brodie and Brodie1999). Thus, the ability for parasites to specialize or generalize and to infect hosts with varying efficacy poses compelling questions: what factors determine parasite host-specificity, and how does the degree of host-specificity impact parasite distribution and diversification? These factors may ultimately influence the virulence, the geographical distributions, and the potential for parasites to emerge into novel hosts (Garamszegi, Reference Garamszegi2006; Hellgren et al. Reference Hellgren, Pérez-Tris and Bensch2009; Cooper et al. Reference Cooper, Griffin, Franz, Omotayo, Nunn and Fryxell2012).
The host range of parasites primarily depends on their compatibility with the host, which is limited by a coevolutionary arms race between hosts and parasites (Kawecki, Reference Kawecki1998). In fact, the study of host–parasite coevolutionary relationships through molecular approaches allows researchers to elucidate the phenomena of cospeciation, the hallmark of coevolution (Demastes and Hafner, Reference Demastes and Hafner1993; Clark et al. Reference Clark, Moran, Baumann and Wernegreen2000). For example, studies of mites and their avian hosts show significant evidence of cospeciation (Ehrnsberger, Reference Ehrnsberger2001; Morelli and Spicer, Reference Morelli and Spicer2007; Hendricks et al. Reference Hendricks, Flannery and Spicer2013). In addition, mammalian and avian hosts also show evidence of cospeciation with haemosporidian blood parasites, including the causative agents of leucocytozoonosis and malaria (Ricklefs and Fallon, Reference Ricklefs and Fallon2002; Garamszegi, Reference Garamszegi2009; Hughes and Verra, Reference Hughes and Verra2010; Jenkins and Owens, Reference Jenkins and Owens2011).
Infections of malaria occur in multiple vertebrate hosts including reptiles, mammals and birds (Levine, Reference Levine1988). Malaria parasites of birds are found on all continents of the world, except Antarctica (Valkiunas, Reference Valkiunas2005), and have been studied intensively for over 100 years. Avian malaria has therefore proven to be an important model system for pursuing evolutionary and ecological issues such as speciation (Ricklefs and Fallon, Reference Ricklefs and Fallon2002; Ricklefs et al. Reference Ricklefs, Fallon and Bermingham2004; Pérez-Tris et al. Reference Pérez-Tris, Hellgren, Križanauskienė, Waldenström, Secondi, Bonneaud, Fjeldså, Hasselquist and Bensch2007), life-history trade-offs (Garamszegi, Reference Garamszegi2006; Hellgren et al. Reference Hellgren, Pérez-Tris and Bensch2009), and competition and community structure in a changing environment (Read and Taylor, Reference Read and Taylor2001; Mideo et al. Reference Mideo, Alizon and Day2008; Mideo, Reference Mideo2009; Palinauskas et al. Reference Palinauskas, Valkiūnas, Bolshakov and Bensch2011; Loiseau et al. Reference Loiseau, Harrigan, Robert, Bowie, Henri, Smith and Sehgal2012; Svensson-Coelho et al. Reference Svensson-Coelho, Blake, Loiselle, Penrose, Parker and Ricklefs2013). Extensive host switching of some avian Plasmodium lineages has been shown in birds belonging to different families (Ricklefs and Fallon, Reference Ricklefs and Fallon2002; Waldenström et al. Reference Waldenström, Bensch, Kiboi, Hasselquist and Ottosson2002; Fallon et al. Reference Fallon, Bermingham and Ricklefs2003, Reference Fallon, Bermingham and Ricklefs2005; Szymanski and Lovette, Reference Szymanski and Lovette2005) and the potential for these widely distributed avian Plasmodium parasites to switch into new hosts can have calamitous effects, as was seen in the endemic bird populations of Hawaii (van Riper, Reference Van Riper, van Riper, Goff and Laird1986). Thus, it is crucial to understand the factors that influence parasite host specificity and the longstanding host relationships among parasites.
Considering host–parasite relationships, Ricklefs and Fallon (Reference Ricklefs and Fallon2002) used tree-based methods to assess cospeciation and host switching between the avian haemosporidian genera Plasmodium and Haemoproteus and their hosts. Their study included 20 avian families distributed throughout six countries, in which they reported significant cospeciation and host switching. In addition, Ricklefs et al. (Reference Ricklefs, Fallon and Bermingham2004) conducted a more focused analysis by re-examining cospeciation of avian malaria parasites and forest dwelling songbirds within North America and the West Indies. Consistent with their previous findings, cospeciation and host switching were prominent events recovered in their study. Here, we assessed the coevolutionary host–parasite relationships of avian Plasmodium found in the Old-World bird family Nectariniidae. We sought to increase the sensitivity for the detection of coevolutionary relationships by focusing on the large assemblage of Africa sunbirds. This assemblage comprises 95 species that are primarily restricted to continental Africa and its neighbouring islands including Madagascar, but which includes five Asian species that represent a recent back-colonization from Africa (Bowie, Reference Bowie2003, Bowie et al. unpublished data).
Sunbirds utilize virtually all forms of habitat, including moist forests, swamps, grasslands, primary rainforests, open woodlands, and semi-arid regions(Cheke et al. Reference Cheke, Clive and Allen2001). Most species are sedentary or short-distance seasonal migrants, and can be either ecological generalists or specialists (i.e. restricted to a very small area, e.g. highlands in East Africa; Bowie et al. Reference Bowie, Fjeldså, Hackett and Crowe2004). A recent study established that Nectariniidae and other bird families in Africa (Muscicapidae, Pycnonotidae, Timaliidae and Turdidae) also harbour both generalist and specialist Plasmodium parasites (Loiseau et al. Reference Loiseau, Harrigan, Robert, Bowie, Henri, Smith and Sehgal2012). The detection of multiple specialist parasite lineages and the tight host specificity that specialist parasites exhibit suggests that some degree of cospeciation may occur among avian Plasmodium parasites and their African sunbird hosts.
The coevolutionary relationships of avian Plasmodium parasites and their hosts are further complicated by vector–parasite interactions and habitat change (Chasar et al. Reference Chasar, Loiseau, Valkiūnas, Iezhova, Smith and Sehgal2009). Environmental changes over time may have led to changes in both host and Plasmodium vector distribution, which may consequently affect the transmission and prevalence of avian malaria (Kamdem et al. Reference Kamdem, Tene Fossog, Simard, Etouna, Ndo, Kengne, Boussès, Etoa, Awono-Ambene, Fontenille, Antonio-Nkondjio, Besansky and Costantini2012; Pavlacky et al. Reference Pavlacky, Possingham, Lowe, Prentis, Green and Goldizen2012). Because avian Plasmodium are globally distributed among many bird species, the coevolution of avian Plasmodium parasites are likely driven at the global-scale by environmental changes with periodic cycling of geographic expansion and isolation, a process described as taxon pulses (Hoberg and Brooks, Reference Hoberg and Brooks2008; Agosta et al. Reference Agosta, Janz and Brooks2010). Here we assess the cross-continental patterns and coevolutionary histories of a host–parasite system in Africa and provide empirical evidence that supports a model for biotic diversification in avian Plasmodium.
MATERIALS AND METHODS
Sample collection
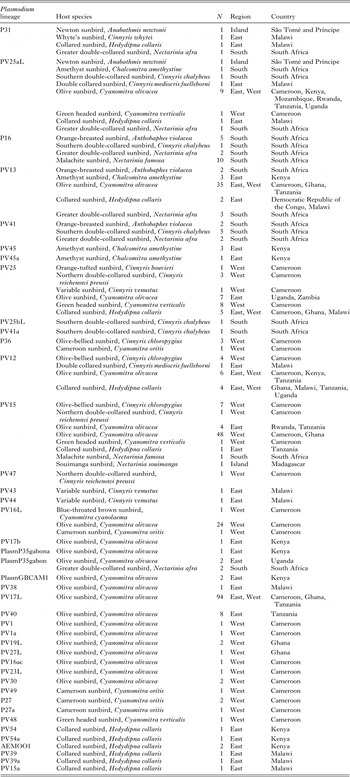
Blood samples from birds were collected in 12 countries of Africa and in three island countries covering five biogeographic regions: West Africa (Gabon, Ghana, and Cameroon; N = 935), East Africa (Burundi, Kenya, Democratic Republic of the Congo, Malawi, Mozambique, Rwanda, Uganda, Tanzania and Zambia; N = 392), Southern Africa (The Republic of South Africa; N = 252), Madagascar (N = 18) and two small oceanic archipelagos (São Tomé and Principe; N = 21, and the Comoros; N = 18) during the period 1999 to 2009. All birds were caught with mist-nets and blood samples were collected from the brachial vein. Blood samples were stored in lysis buffer (10 mm Tris-HCL pH 8·0, 100 mm EDTA, 2% SDS) or in absolute ethanol at −80°C or in liquid Nitrogen cryo-tanks.
PCR amplification and DNA sequencing
In total, 1636 individual sunbirds (N species = 32) were screened for Plasmodium parasites (see Table 1). DNA was extracted from whole blood following a DNeasy kit protocol (Qiagen, Valencia, California). Success of each DNA extraction was verified with primers that amplify the brain-derived neurotrophic factor (BDNF) (Sehgal and Lovette, Reference Sehgal and Lovette2003).
The number of Plasmodium lineages (N), host species and sampling locality

Since mitochondrial lineages have been shown to be reproductively isolated (Bensch et al. Reference Bensch, Pérez-Tris, Waldenström and Hellgren2004), Plasmodium spp. mitochondrial haplotypes are often defined as unique cytochrome b lineages (Hellgren et al. Reference Hellgren, Waldenström and Bensch2004; Waldenström et al. Reference Waldenström, Bensch, Hasselquist and Ostman2004; Bensch et al. Reference Bensch, Hellgren and Pérez-Tris2009). Therefore, each lineage (i.e. haplotype) differing by at least 1 bp was analysed as a separate entity (i.e. OTU). In some cases, identical cyt b lineages exhibited differences (1 bp or greater) in asl or clpc and were also treated as separate entities. To detect Plasmodium spp. lineages, we used nested PCR to amplify the cyt b gene (340 bp) of the mtDNA with the primers HAEMF/HAEMR2 – HAEMNF/HAEMNR2 following the protocols of Waldenström et al. (Reference Waldenström, Bensch, Hasselquist and Ostman2004). For positive controls, we used DNA samples from infected birds, in which infections were verified by microscopy. Purified water was used in place of DNA template as negative controls.
The amplicons were run out on a 1·8% agarose gel using 1×TBE, and visualized by ethidium bromide staining under ultraviolet light. Amplicons from DNA samples of birds infected with Plasmodium spp. were purified using ExoSap (following manufacture's instructions, USB Corporation, Cleveland, Ohio). We identified lineages by sequencing the fragments (BigDye [R] version 3.1 sequencing kit, Applied Biosystems) on an ABI PRISM 3100 (TM) automated sequencer (Applied Biosystems). All unique sequences were sequenced twice for verification. DNA chromatographs containing double peaks, indicating multiple infections of parasites within a single host, were excluded from the analyses. We compared the lineages with all sequences from blood parasites already deposited in GenBank. In addition to using sequence data from the mitochondria genome, previous studies have used sequence data from the apicoplast and nuclear genomes to analyse phylogenetic relationships of Plasmodium species, including clpc and asl (Rathore et al. Reference Rathore, Wahl, Sullivan and McCutchan2001; Hagner et al. Reference Hagner, Misof, Maier and Kampen2007; Martinsen et al. Reference Martinsen, Perkins and Schall2008) Subsequently, we amplified the apicoplast gene clpc (416 bp) and the nuclear gene asl (166 bp) from 33 cyt b Plasmodium lineages following Martinsen et al. (Reference Martinsen, Perkins and Schall2008).
For the host phylogeny, the mtDNA gene ATPase 6 (364 bp) and nuclear genes RDPSN (720 bp) and TGFB2 (488 bp) were PCR amplified from Plasmodium positive Nectariniidae species, 18 in total, using the protocols described in Hunt et al. (Reference Hunt, Bermingham and Ricklefs2001) and Primmer et al. (Reference Primmer, Borge, Lindell and Saetre2002). All new sequences were deposited into GenBank (online Table S1) and MalAvi (Bensch et al. Reference Bensch, Hellgren and Pérez-Tris2009).
Prevalence and statistical analyses
Plasmodium parasite infection prevalence and 95% Bayesian credible interval for infection prevalence were calculated for all respective regions. We calculated credible intervals using the inverse of the cumulative distribution function of the beta distribution in R as described in Swei et al. (Reference Swei, Rowley, Rödder, Diesmos, Diesmos, Briggs, Brown, Cao, Cheng, Chong, Han, Hero, Hoang, Kusrini, Le, McGuire, Meegaskumbura, Min, Mulcahy, Neang, Phimmachak, Rao, Schoville, Sivongxay, Srei, Stöck, Stuart, Torres, Tran, Tunstall, Vieites and Vredenburg2011). The Plasmodium lineages were divided by region, according to the presence of one or more lineages, into the following regions: West Africa, East Africa, Southern Africa, Madagascar, and oceanic archipelagos. Oceanic archipelagos were treated as a single unit in our analyses because of low sample sizes in these regions. Analysis of Similarities (ANOSIM) was used to compare parasite assemblage data among regions. The ANOSIM R-statistic value ranges from −1 to +1 and indicates the extent to which groups are separated; an R value of 0 indicates random grouping, R>0·75 indicates strong separation, and R<0·25 indicates little separation among groups. Intermediate values, 0·25<R<0·75, indicate separation with varying overlap. All analyses were executed in R (R Core Team, 2012). The null hypothesis of panmixia was tested in Arlequin 3.5.1.3 software (Excoffier and Lischer, Reference Excoffier and Lischer2010) using an exact test of the differentiation among parasite communities. This test is analogous to Fisher's exact test, but extends the test from a two-by-two contingency table to a contingency table of arbitrary size.
Phylogenetic analyses
The sequences were edited using Sequencher 4.8 (GeneCodes, Ann Arbor, MI). SEAVIEW software (Galtier et al. Reference Galtier, Gouy and Gautier1996) was used to align the sequences. Modeltest Version 3.7 (Posada and Crandall, Reference Posada and Crandall1998) was used to determine the most appropriate nucleotide substitution model for the Akaike Information Criterion. All genes were initially analysed separately and phylogenetic relationships were inferred using maximum likelihood (ML) implemented in RaxML. A Bayesian approach, as implemented in MrBayes v3.1.2 (Ronquist and Huelsenbeck, Reference Ronquist and Huelsenbeck2003) and described below, was used to estimate posterior probabilities of the tree branches. There was no significant conflict among individual gene trees, with any conflict being restricted to nodes that had a bootstrap of >70% and a PP of >0·95. Therefore, for our final tree, all sequences were concatenated.
For the Bayesian inference, the metropolis-coupled MCMC (MCMCMC) methods were implemented using the GTR+G model. Two Markov chains were run simultaneously for 10 million generations and sampled every 200 generations, generating 50 000 trees; 25% of the trees were discarded and the remaining 37 500 trees were used to construct a majority consensus tree. The Bayesian Posterior Probabilities (BBP) was then calculated using these remaining trees.
Host phylogeny
The phylogenetic relationships of the 18 infected Nectariniidae species were inferred using ML, as implemented in PAUP*Ver.4.0b10 (Swofford, Reference Swofford2001). ML methods were implemented using the TVM+G model. Four species (Acridotheres tristis, Sturnus roseus, Sturnus unicolor, and Sturnus vulgaris) from the Sturnidae family were selected as outgroup taxa to root the Nectariniidae tree.
Parasite phylogeny
A ML tree based on three genes for Plasmodium was generated using RAxML (Stamatakis, Reference Stamatakis2006), under the GTR+I+G model. A thorough ML search was performed along with 1000 rapid bootstrap inferences. In addition, we performed a Bayesian analyses as described above. Two Leucocytozoon lineages (Leuco. sp. 2208 and P157) were selected as outgroup to root the Plasmodium phylogeny.
Biogeographical analysis
The distribution ranges of Plasmodium lineages were designated as follows: Southern Africa, East Africa, West Africa, Madagascar, Oceanic archipelagos. A Bayesian analysis was conducted in Beast v1.8.0 (Drummond et al. Reference Drummond, Suchard, Xie and Rambaut2012). The MCMC chains were run simultaneously for 1 million generations and trees were sampled every 100 generations. The burn-in was set to 1000 and 9000 trees from the MCMC output were then used to reconstruct the ancestral distributions of the Plasmodium lineage phylogeny in RASP v2.1b (Yu et al. Reference Yu, Harris and He2010, Reference Yu, Harris and He2013) using the S-DIVA method (Statistical Dispersal-Vicariance Analysis), as outlined by Yu et al. Reference Yu, Harris and He2010 and Ali et al. Reference Ali, Yu, Pfosser and Wetschnig2012. This method uses all trees from the MCMC output and calculates the average frequency of an ancestral range at a node in ancestral reconstructions. The inferred ancestral ranges for each node on a post burn-in tree were obtained.
Host–parasite cophylogeny
TreeMap 1.0b (Page, Reference Page1994) was used to produce a tanglegram, which shows the Plasmodium phylogeny relative to the bird phylogeny. Distance-based methods were used to test the extent of a global hypothesis of coevolution between hosts and their parasites with ParaFit (Legendre et al. Reference Legendre, Desdevises and Bazin2002) and Procrustean Approach to Cophylogeny (PACo) (Balbuena et al. Reference Balbuena, Míguez-Lozano and Blasco-Costa2013). These approaches use phylogenetic distance matrices and host–parasite associations to test for overall fit, which can be interpreted as congruence between host and parasite phylogenies. Similar to the ParaFitGlobal statistic, PACo produces a goodness-of-fit statistic and also assesses the significance by randomization of the host–parasite association data. We used 1000 permutations for our distance-based analyses. Although distance-based methods are useful for dealing with large phylogenies or phylogenetic polytomies and uncertainties, such methods do not evaluate all coevolutionary scenarios. Therefore, tree reconciliation methods were implemented in JANE 4.0 (Conow et al. Reference Conow, Fielder, Ovadia and Libeskind-Hadas2010) to map cospeciation, duplication, duplication with host switching, loss and failure to diverge events onto the host–parasite cophylogenies. Each event type is assigned an associated cost and a search for a cophylogeny with a minimum total cost (most parsimonious scenario) is performed. A search for the most parsimonious scenario was performed with and without host switching allowed. The event cost values were individually downweighted in separate analyses (e.g. for downweighting cospeciation the cost values used were: cospeciation = −1, duplication = 1, duplication and host switch = 2, loss = 1, failure to diverge = 1) or were set to even event cost values (cospeciation = 1, duplication = 1, duplication and host switch = 2, loss = 1, failure to diverge = 1). A second search was performed with event cost values intended to maximize cospeciation events (cospeciation = −1, duplication = 0, duplication and host switch = 0, loss = 0, failure to diverge = 0). Our analyses included 46 parasite lineages, 18 host species and 86 host–parasite links. We performed a second analysis in which we only included parasite lineages with ⩾2% sequence divergence, resulting in 23 parasite lineages, 18 hosts and 45 host–parasite links. Random tip mapping methods were implemented with a total of 1000 random replicates to estimate the likelihood of obtaining optimal reconciliations by chance. In addition, we used Core-PA (Merkle et al. Reference Merkle, Middendorf and Wieseke2010) to further assess the correspondence between parasite and host phylogenetic trees. This programme allows for the frequency of events to be evaluated without the need to individually downweigh event cost values and is useful when it is difficult to assign appropriate cost values (Merkle et al. Reference Merkle, Middendorf and Wieseke2010). Scenarios were reconstructed with automatically calculated event cost values using a simplex optimization algorithm method. Randomization testing was performed with 1000 random cycles using standard parameters and the above cost values.
RESULTS
Origins and biogeography of malaria parasites in African sunbirds
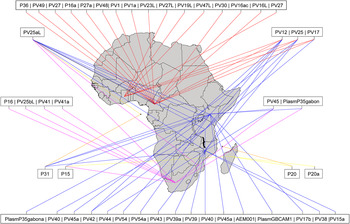
We acquired and analysed a comprehensive set of blood samples from sunbirds collected across Africa. Fifteen parasite lineages were found exclusively in West Africa. Similarly, 15 parasite lineages were found exclusively in East Africa. Only four parasite lineages were found exclusively in South Africa (Fig. 1). These parasite lineages were found at low prevalence (0·1–8%); and our 95% credible Bayesian intervals were consistent with prevalence being low for the majority of parasites restricted to East and West Africa (See online Table S2, supporting information). Two parasite lineages, PV20 and PV20a, were recovered from the endemic Souimanga Sunbird (Cinnyris sovimanga) of Madagascar and the Comoros (Cheke et al. Reference Cheke, Clive and Allen2001). We also recovered Plasmodium lineages P15 in the Souimanga Sunbird. However, P15 is not restricted to Madagascar and was also found in the Collared Sunbird (Hedydipna collaris) and the Malachite Sunbird (Nectarinia famosa) from East and South Africa, respectively. Several parasite lineages were found in either two, three, or in all four regions of our study (Fig. 1). ANOSIM revealed that the parasite assemblages did not vary significantly among biogeographic regions (R-value 0·21; P = 0·03). Furthermore, the Plasmodium lineages are generally not grouped into distinct clades according to biogeographic origin (online Fig. S2). However, the non-differentiation exact P value was significant (P<0·00001) among all biogeographic regions sampled, suggesting non-random structure likely indicative of differences in frequency of Plasmodium parasite communities among biogeographic regions.
Map showing sampling origins for each Plasmodium lineage. Plasmodium lineages are grouped and coloured according to regions/s that they are recovered from: Red = West, Blue = East, Pink = South, Yellow = Madagascar, Orange=Archipelagos).

Phylogeny of African sunbirds-hosts
Using the combined dataset (ATPase+RDPSN+TGFB2), the ML analyses produced one tree with a score of 7583·538 (online Fig. S1). Our preliminary phylogeny shows no monophyletic relationships among all genera of the family Nectariniidae. This topology and lack of monophyly among sunbird genera is consistent with a study that encompasses 95% of African species (Bowie Unpublished data). However, the family Nectariniidae itself is monophyletic and sister to the family Dicaeidae (Flowerpeckers) (Bowie Unpublished data).
Phylogeny of the Plasmodium-parasites
We obtained 396 Plasmodium cyt b sequences sourced from 18 host species. Of these sequences, 33 represent distinct parasite mitochondrial DNA lineages. Five previously identified generalists Plasmodium lineages (PV12L, P15, P31 and PV13L) were recovered along with nine reported specialist lineages (P16, PV40, PV41, PV38, P36, PV19L, PV16L, PV25aL and PV1L) (Loiseau et al. Reference Loiseau, Harrigan, Robert, Bowie, Henri, Smith and Sehgal2012). These lineages were dispersed throughout the phylogeny and did not form distinct clades based on specializing or generalizing strategies. However, the specialists reported by Loiseau et al. (Reference Loiseau, Harrigan, Robert, Bowie, Henri, Smith and Sehgal2012) may be specialists at the family, but not the species level.
We recovered 12 parasite lineages with identical cyt b sequences that exhibit sequence divergence in either the nuclear asl (N = 4; 0·3–28%) or the apicoplast clpc (N = 8; 0·2–11%) gene. Two cyt b parasite lineages exhibited diversity in both asl and clpc (1·2%). Conversely, two different cyt b parasite lineages, PV47 and PV19L, share the same asl sequence. Overall, the phylogeny reveals the tremendous diversity of Plasmodium parasites in this group of birds (online Fig. S2).
Historical biogeography of malaria parasites in African sunbirds
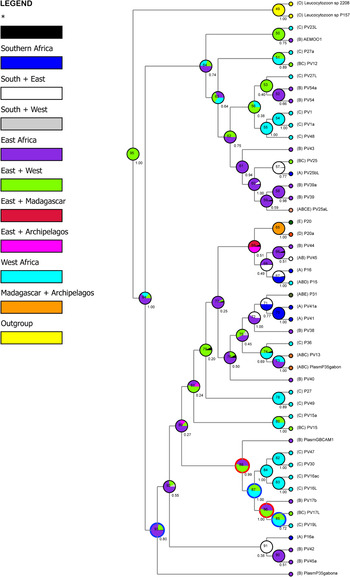
We applied the S-DIVA method to determine whether historical processes of vicariance and dispersal may have contributed to the evolution and assembly of Plasmodium parasite communities. The S-DIVA results reveal 16 vicariance events and 39 dispersals, suggesting an important role for dispersal in influencing the observed Plasmodium parasite distribution patterns (online Table S3). Node 94 suggests an East African origin (frequency of occurrence is 64·09%) of the current Plasmodium lineages recovered (Fig. 2). An early dispersal is predicted at node 64. The possible ancestral ranges at this node are East Africa, West Africa, East+West Africa with the frequency of occurrence being 51·48, 27·45 and 21·45%, respectively. Vicariance at this node is also suggested, resulting in East and West African Plasmodium lineages.
Ancestral distribution and phylogeny of Plasmodium lineages obtained by S-DIVA (RASP). Legend key to the inferred ancestral ranges, shown in pie chart form, at different nodes; black with an asterisk represent other ancestral ranges. The probability of ancestral ranges is shown at each node of one post-burn Bayesian tree with Bayesian Posterior Probability values indicated below the pie charts. Select nodes in which dispersal (blue) and vicariant (red) events are predicted to occur are highlighted to illustrate a potential taxon pulse. Biogeographical regions: A = South Africa, B = East, C = West, D = Madagascar, E = Archipelagos.

The remaining lineages of East and West Africa most likely arose from an early dispersal event at node 92. The most favoured ancestral range at this node is East Africa. Interestingly, the majority of Southern African lineages were predicted to arise from dispersal events, with the exception of a vicariance event evident in node 91. The possible ancestral range at node 91 is Southern+East Africa with 100% marginal probability. Dispersal events are also postulated to contribute to the origin of Plasmodium lineages of Madagascar and oceanic archipelagos (online Table S3).
With respect to the host biogeography, JANE predicted 19 parasite lineages of putative duplication with host switching events occurring in hosts that have overlapping distribution regions. Duplication with host switching events occur when a Plasmodium parasite speciates and one of the new species switches into a different host. Fourteen host taxa harboured two or more parasite lineages and thus host switching was expected. Interestingly, two parasite lineages that are considered specialists, PV1L and PV41, arose from putative duplications with host switching events.
Host–parasite cophylogeny
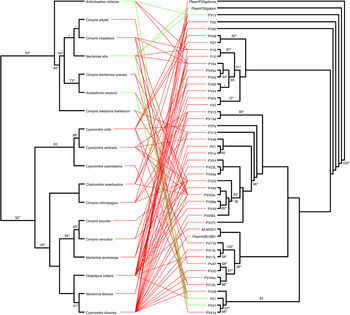
The tanglegram produced by TreeMap (Fig. 3) shows no obvious congruence between the Plasmodium and the Nectariniidae topologies. We found no significant fit between the host and parasite phylogenies with the observed ParaFitGlobal statistic (P = 0·66) and PACo global goodness-of-fit statistic (P = 0·84). Only 6% of individual host–parasite associations contributed significantly to the ParaFitGlobal statistic (online Fig. S3). The JANE optimal reconstruction trees recovered when setting the event cost values to maximize cospeciation also show that cospeciation was not significantly more frequent than random (P = 0·72). When using even event cost values or cost values with individual events downweighted, the JANE optimal reconstruction trees revealed significant cophylogeny (P<0·05), except when individually downweighting loss/sorting events. These results suggest that all individual events evaluated, with the exception of loss/sorting and cospeciation events, contribute significantly to the coevolution of avian Plasmodium parasites.
A tanglegram of the Nectariniidae host species ML tree (left) compared to a ML tree of Plasmodium lineages (right) with lines indicating host–parasite associations. Only maximum likelihood bootstrap values above 50 and Bayesian Posterior Probability values ⩾0·95 (indicated by asterisks) are shown. Green lines indicate host–parasite associations that contribute significantly to the ParaFitGlobal statistic, whereas red lines indicate associations that do not contribute significantly to the ParaFitGlobal statistic.

It is possible that some Plasmodium lineages in the parasite phylogeny may exhibit intraspecific polymorphisms and may not represent distinct species. Taking into account errors due to excessive parasite duplications within host species, we excluded Plasmodium lineages with less than 2% sequence divergence and repeated our cophylogenetic analyses with the event cost values used for maximizing cospeciation. Applying ParaFit, PACo, and JANE suggested no significant cospeciation in this analysis (P>0·05).
Given that the results strongly depend on good estimations of the set of event cost values, we conducted separate analyses in Core-PA with the event cost values automatically estimated. The estimated event cost values obtained were cospeciation = 0·0029, sorting = 0·0006, duplications = 0·0029, host switching = 0·9936. When applying these event cost values, all number of events was significantly higher than expected by chance alone (P ⩽ 0·05), with the exception of cospeciation events (P = 0·25). In summary, we consistently detected significant sorting, duplication, and host switching events throughout our cophylogenetic analyses.
DISCUSSION
A lack of cospeciation and a significant role for host switching in the coevolution of avian malaria parasites
Our study constitutes the first investigation of coevolution between Plasmodium parasites and an African bird family that includes taxa distributed across Africa, comprising a local, regional and continental scale. In our analysis, we found significant cospeciation within Plasmodium parasites when implementing a tree-based cophylogenetic analysis with an even cost structure and with a cost structure downweighting cospeciation events. However, no significant cospeciation was apparent when applying a cost structure intended to maximize cospeciation events or when applying the explicit statistical approaches ParaFit and PACo. These data suggest that low levels of cospeciation potentially occur between avian malaria parasites and their hosts, but have little influence on Plasmodium diversification.
Therefore, Plasmodium diversification is more likely influenced by host switching. Here, we provide additional evidence for this well-described process (Bensch et al. Reference Bensch, Stjernman, Hasselquist, Ostman, Hansson, Westerdahl and Pinheiro2000; Ricklefs and Fallon, Reference Ricklefs and Fallon2002; Waldenström et al. Reference Waldenström, Bensch, Kiboi, Hasselquist and Ottosson2002). Several Plasmodium lineages of our analyses were shared across several avian families of Africa, including Muscicapidae, Nectariniidae, Pycnonotidae and Turdidae (Loiseau et al. Reference Loiseau, Harrigan, Robert, Bowie, Henri, Smith and Sehgal2012); suggesting that host-relatedness within avian families may not necessarily limit the evolution of Plasmodium parasites via host switching. The JANE analysis revealed two specialist parasite lineages arising from duplication and host switching events. These findings support the hypothesis of oscillation and taxon pulses (Hoberg and Brooks, Reference Hoberg and Brooks2008), and also corroborate the greater rates for Plasmodium parasites in Africa to transition from generalists to specialists as opposed to transitioning from specialists to generalists (Loiseau et al. Reference Loiseau, Harrigan, Robert, Bowie, Henri, Smith and Sehgal2012).
Host switching may affect the coevolutionary cycles between host–parasite histories, and can be linked to the heterogeneous mosquito feeding tendencies across avian hosts (Hamer et al. Reference Hamer, Kitron, Goldberg, Brawn, Loss, Ruiz, Hayes and Walker2009). These feeding patterns contribute to the distribution of avian malaria parasites and may facilitate host switching (Kim and Tsuda, Reference Kim and Tsuda2012). Such factors will in turn weaken the association between Plasmodium parasite and host phylogenies. However, in some cases vectors do not play a major role in the distribution patterns of Plasmodium parasites across hosts (Njabo et al. Reference Njabo, Cornel, Bonneaud, Toffelmier, Sehgal, Valkiūnas, Russell and Smith2011; Medeiros et al. Reference Medeiros, Hamer and Ricklefs2013). Thus host switching may depend more on inherent features of Plasmodium or more likely their hosts (Agosta et al. Reference Agosta, Janz and Brooks2010). Some hosts may harbour a community of parasites, which can force parasites to compete for host resources (de Roode et al. Reference De Roode, Pansini, Cheesman, Helinski, Huijben, Wargo, Bell, Chan, Walliker and Read2005; Graham, Reference Graham2008). This may be a determining factor for Plasmodium parasites to colonize new hosts and possibly explains the prominence of sorting events recovered in our cophylogenetic analyses. Our data confirm the remarkable complexity of the host parasite interactions in the malaria system, and that host and vector ecology likely play important roles in parasite diversification.
Evidence for biotic diversification in avian malaria parasites of African sunbirds
The diversity and structure of parasite communities are likely determined by the distribution of hosts. Hosts with wide distributions, particularly migratory birds, can encounter more parasites and often harbour a greater diversity of parasites in comparison to hosts with restricted distributions (Figuerola and Green, Reference Figuerola and Green2000; Hubálek, Reference Hubálek2004; Pérez-Tris and Bensch, Reference Pérez-Tris and Bensch2005; Jenkins et al. Reference Jenkins, Thomas, Hellgren and Owens2012). Migratory birds may also facilitate shifting of Plasmodium transmission areas(Hellgren et al. Reference Hellgren, Krizanauskiene, Valkĭunas and Bensch2007 Reference Hellgren, Waldenström, Peréz-Tris, Szöll, Si, Hasselquist, Krizanauskiene, Ottosson and Bensch b ). Such a system could result in a lack of phylogeographic structuring of parasite communities, as shown in avian malaria parasite communities of the Black-throated Blue Warbler (Dendroica caerulescens) (Fallon et al. Reference Fallon, Fleischer and Graves2006) and the Common Yellowthroat (Geothylpis trichas) (Pagenkopp et al. Reference Pagenkopp, Klicka, Durrant, Garvin and Fleischer2008). However, in systems with restricted host distributions, some parasite communities are phylogeographically structured (Fallon et al. Reference Fallon, Bermingham and Ricklefs2003, Reference Fallon, Bermingham and Ricklefs2005). African sunbirds, although not migratory, can have both wide and restricted ranges and thus provided an interesting model for assessing the biogeographic patterns of Plasmodium parasite communities. We found that current Plasmodium lineage assemblages likely originated in East Africa and that dispersal appears to have played an important role in shaping the observed Plasmodium communities. Our results indicate that early and late vicariance events may have also played a role in Plasmodium diversification, suggesting that Plasmodium parasites may diversify by taxon pulses (Fig. 2), episodes of vicariant events alternating with episodes of dispersal events (Hoberg and Brooks, Reference Hoberg and Brooks2008).
Dispersal events may occur as a result of host switching, which may be followed by isolation or specialization in a particular host (Zarlenga et al. Reference Zarlenga, Rosenthal, La Rosa, Pozio and Hoberg2006; Janz and Nylin, Reference Janz, Nylin and Tilman2007; Waltari et al. Reference Waltari, Hoberg, Lessa and Cook2007; Hoberg and Brooks, Reference Hoberg and Brooks2008; Loiseau et al. Reference Loiseau, Harrigan, Robert, Bowie, Henri, Smith and Sehgal2012). It is possible that related hosts provide an ecological fit through similar physiological and biochemical environments that allow parasites to persist in novel hosts. Alternatively, parasites may possess phenotypes that are pre-adapted to colonize and survive (i.e. possessing untapped potential fitness) in novel conditions provided through different host (Agosta et al. Reference Agosta, Janz and Brooks2010). Our results suggest that host switching is a significant factor that likely leads to a continuum of biotic expansion and biotic isolation over evolutionary and ecological time, which may explain the lack of phylogeographic structuring in Plasmodium parasites of African sunbirds.
Although we did not find evidence to suggest strong phylogeographic and biogeographic structuring in the current Plasmodium communities of African sunbirds, we observed several interesting Plasmodium biogeographic patterns. Some Plasmodium lineages were recovered exclusively in Madagascar and the Comoros. This may in part be due to the host distribution since the Plasmodium lineages recovered exclusively in Madagascar and Comoros were found in an endemic host. Conversely, 22% (N = 10) of Plasmodium lineages were recovered in either two or three of the regions sampled throughout Africa; the majority of these lineages were present in both West and East Africa. These results are not surprising considering that all Plasmodium lineages recovered concurrently in West and East Africa were found in a single species, the Olive Sunbird (Cyanomitra olivacea). This species is considered to be an ecological generalist and lives in various habitats spanning entirely across West and East Africa (Cheke et al. Reference Cheke, Clive and Allen2001; Bowie et al. Reference Bowie, Fjeldså, Hackett and Crowe2004; Smith et al. Reference Smith, Thomassen, Freedman, Sehgal, Buermann, Saatchi, Pollinger, Milá, Pires, Valkiūnas and Wayne2011).
In addition, we find that the majority of Plasmodium lineages recovered are restricted to either West Africa or East Africa. Interestingly, 14 Plasmodium lineages recovered exclusively in East Africa (N = 7) and West Africa (N = 7) were also found in the Olive Sunbird. Moreover, these Plasmodium lineages are separated not only by region, but by habitat type as well (Loiseau et al. Reference Loiseau, Harrigan, Robert, Bowie, Henri, Smith and Sehgal2012). The Plasmodium lineages of the Olive Sunbird recovered exclusively in East Africa were found in montane habitats, whereas Plasmodium lineages recovered exclusively in West Africa were found in rainforest habitats. As was recently described, it is possible that the differences in habitat or climatic conditions affect the geographical distribution and transmission of Plasmodium parasites (Hellgren et al. Reference Hellgren, Krizanauskiene, Valkĭunas and Bensch2007a , Reference Hellgren, Waldenström, Peréz-Tris, Szöll, Si, Hasselquist, Krizanauskiene, Ottosson and Bensch b ; Sehgal et al. Reference Sehgal, Buermann, Harrigan, Bonneaud, Loiseau, Chasar, Sepil, Valkiūnas, Iezhova, Saatchi and Smith2011; Loiseau et al. Reference Loiseau, Harrigan, Robert, Bowie, Henri, Smith and Sehgal2012), resulting in the observed parasite biogeographic patterns. For instance, temperature and altitudinal variables were shown to impact both parasite diversity and abundance, which in turn can alter the parasite community structure (Paaijmans et al. Reference Paaijmans, Blanford, Bell, Blanford, Read and Thomas2010; Van Rooyen et al. Reference van Rooyen, Lalubin, Glaizot and Christe2013).
Climate variability also affects the development of parasites and the survival of the vector populations that transmit them (Koenraadt et al. Reference Koenraadt, Paaijmans, Schneider, Githeko and Takken2006; Minakawa et al. Reference Minakawa, Omukunda, Zhou, Githeko and Yan2006; Afrane et al. Reference Afrane, Little, Lawson, Githeko and Yan2008; Paaijmans et al. Reference Paaijmans, Read and Thomas2009, Reference Paaijmans, Blanford, Bell, Blanford, Read and Thomas2010; Chaves and Koenraadt, Reference Chaves and Koenraadt2010; LaPointe et al. Reference LaPointe, Goff and Atkinson2010). In theory, parasite and host population structures drive host–parasite coevolution and ultimately leads to a geographic mosaic of coevolutionary hot and cold spots (Thompson, Reference Thompson1994; Lively, Reference Lively1999; King et al. Reference King, Delph, Jokela and Lively2009). Taken together, our findings are important in understanding host–parasite coevolutionary dynamics and provide a basis for future studies on the structuring of host–parasite systems.
SUPPLEMENTARY MATERIAL
To view supplementary material for this article, please visit http://dx.doi.org/S0031182014001681.
ACKNOWLEDGEMENTS
The authors would like to thank Edward Connor, Eric Routman and Andrea Swei (San Francisco State University) for their assistance with statistical analysis. The authors also thank Juan Balbuena for his assistance with the PACo analysis. The authors thank Anthony Chasar, Francis Forzi, Dennis Anye Ndeh, Kevin Njabo, Jerome Fuchs, Ross Wanless, Graeme Oatley, Penn Lloyd, Potiphar Kaliba, Jacob Kuire, Jan Bolding Kristensen, Louis Hansen, Jay McEntee and Jon Fjeldsa and the many other scientists involved in sampling efforts. The authors thank the Governments of the Republic of Cameroon, Seychelles, Madagascar, San Tome and Principe, Tanzania (The Tanzanian Commission for Science and Technology and Tanzanian Wildlife Research Institute), Malawi (Museums of Malawi), Mozambique (National Museum Maputo) and South Africa (CapeNature, Northern Cape Conservation) for permission to conduct field research.
FINANCIAL SUPPORT
This work was supported in part by a National Institute of Health grant SC2AI089120-01A1, the Minority Biomedical Research Support – Research Initiative for Scientific Enhancement grant R25-GM059298, and the Genentech Foundation MS Dissertation Scholarship Award.