INTRODUCTION
Marine Isotope Stage (MIS) 3 (60 to 30 ka) was a period of distinct millennial-scale climate shifts (Dansgaard et al., Reference Dansgaard, Johnsen, Clausen, Dahl-Jensen, Gundestrup, Hammer and Hvidberg1993; Wohlfarth and Näslund, Reference Wohlfarth and Näslund2010; Zhang et al., Reference Zhang, Prange, Merkel and Schulz2014). Based on a review of dated records for more than 50 glaciated regions around the world, Gillespie and Molnar (Reference Gillespie and Molnar1995) found that some regions experienced extensive glacial extents during MIS 3. Furthermore, on the Tibetan Plateau, which is the most glacierized non-polar region on Earth (Wang et al., Reference Wang, Kassab, Harbor, Caffee, Cui and Zhang2013a) and affects regional and global climate (Murari et al., Reference Murari, Owen, Dortch, Caffee, Dietsch, Fuchs, Haneberg, Sharma and Townsend-Small2014), recent dating of glacial landforms indicates that glacial advances in some areas occurred during MIS 3 and were more extensive than advances of the global last glacial maximum (LGM; MIS 2) (Owen et al., Reference Owen, Finkel and Caffee2002; Shi and Yao, Reference Shi and Yao2002; Wang, Reference Wang2010; Wang et al., Reference Wang, Kassab, Harbor, Caffee, Cui and Zhang2013a, Reference Wang, Pan, Zhang, Cui, Cao and Geng2013b; Murari et al., Reference Murari, Owen, Dortch, Caffee, Dietsch, Fuchs, Haneberg, Sharma and Townsend-Small2014). Previously, there have been two ideas advanced for the causes of glacial advance during MIS 3 on the Tibetan Plateau. Owen et al. (Reference Owen, Finkel and Caffee2002) and Xu et al. (Reference Xu, Wang and Yang2010) suggested that, during MIS 3, the south Asian monsoon strengthened as the insolation increased, and thus precipitation increased (occurring as snow at high altitude) and glacier mass balance became more positive, causing glaciers to advance. Shi and Yao (Reference Shi and Yao2002) argued that, in addition to increased precipitation during mid-MIS 3, lower temperatures were key to more extensive glacial advance. One way to examine this issue is to determine whether it is necessary to incorporate both low temperature and precipitation increase in reconstructing glacier dynamics to match observed mid-MIS 3 glacial advance (Plummer and Phillips, Reference Plummer and Phillips2003; Laabs et al., Reference Laabs, Plummer and Mickelson2006; Stansell et al., Reference Stansell, Polissar and Abbott2007; Xu et al., Reference Xu, Hu and Qiao2013; Xu, Reference Xu2014).
The equilibrium-line altitude (ELA), which is the position on a glacier where accumulation is exactly balanced by ablation, is often used to define the lowest boundary of climatic glacierization (Ohmura et al., Reference Ohmura, Kasser and Funk1992; Benn and Lehmkuhl, Reference Benn and Lehmkuhl2000). The ELA responds directly to climate change, and thus it is one of the key parameters that is reconstructed in studies of past glaciation (Benn and Ballantyne, Reference Benn and Ballantyne2005; Ramage et al., Reference Ramage, Smith, Rodbell and Seltzer2005; Xu et al., Reference Xu, Wang and Yang2010). Paleoclimate can be derived by comparing past and present ELA using an energy and mass balance model (EMBM), which is a self-consistent representation of the energy fluxes to and from the glacier surface (Kuhn, Reference Kuhn1979; Kaser and Osmaston, Reference Kaser and Osmaston2002; Stansell et al., Reference Stansell, Polissar and Abbott2007; Rupper et al., Reference Rupper, Roe and Gillespie2009). Applying such a model produces a set of combinations of past temperature and precipitation that can explain the ELA change, and so paleoprecipitation or paleotemperature can be determined if other paleoclimate proxies can be used to constrain either past temperature or past precipitation (e.g., pollen or fossils; Xu et al., Reference Xu, Hu and Qiao2013; Xu, Reference Xu2014).
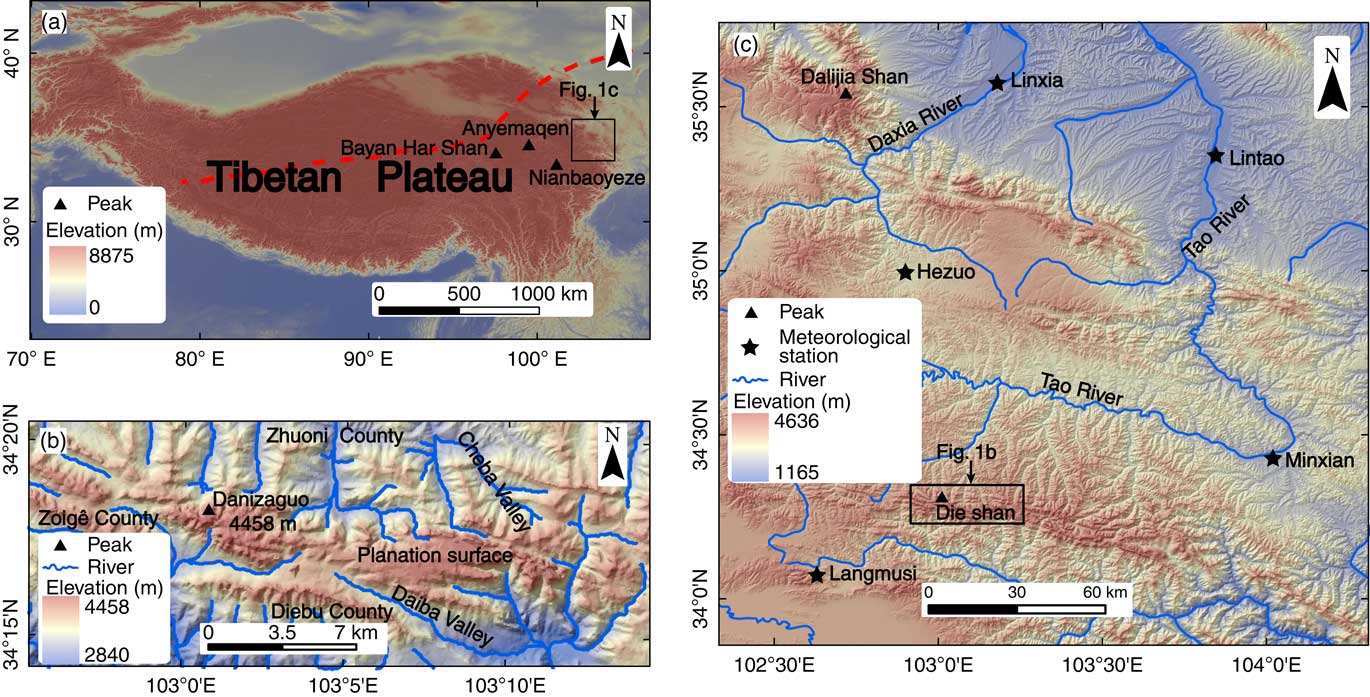
The Die Shan (shan=mountain) is located in the monsoon marginal zone on the northeastern part of the Tibetan Plateau (Fig. 1a). There are no glaciers on the Die Shan today, but it was extensively and repeatedly glaciated during the Quaternary, as indicated by well-preserved glacial erosional and depositional landforms above 3700 m asl (described in detail in Zhao et al., Reference Zhao, Wang, Shen, Yin and Wu2013). Based on regional correlation, Zhao et al. (Reference Zhao, Wang, Shen, Yin and Wu2013) concluded that the local last glacial maximum (LLGM) of Die Shan likely occurred during mid-MIS 3. LLGM moraines dating to mid-MIS 3 have been identified elsewhere on the northeastern Tibetan Plateau, using 10Be exposure ages, including the Anyemaqen (three 10Be exposure ages) and Nianbaoyeze Mountains (14 10Be exposure ages; Owen et al., Reference Owen, Finkel, Ma, Spencer, Derbyshire, Barnard and Caffee2003), and Dalijia Shan (seven 10Be exposure ages; Wang et al., Reference Wang, Kassab, Harbor, Caffee, Cui and Zhang2013a). Previous studies have also used lithogenic tracers, pollen, and mollusks as climate proxies to infer changes in monsoon winds (direction, strength, and persistence) and monsoon-induced precipitation across the northeastern Tibetan Plateau during MIS 3 (Wang et al., Reference Wang, Clemens, Beaufort, Braconnot, Ganssen, Jian, Kershaw and Sarnthein2005a). Quantitative reconstructions of MIS 3 temperature on high mountain areas in the northeastern Tibetan Plateau, however, are lacking. This paper estimates the climate drivers of a presumed mid-MIS 3 glacial advance in the Die Shan region. To do this, ELA is reconstructed by two methods, and then an energy and mass balance model (EMBM) is used to estimate paleotemperature changes.
(color online) (a) DEM of the Tibetan Plateau. The dashed red line shows the modern Asian summer monsoon limit (modified after Chen et al., 2008). (b) Relief of the Die Shan. (c) Map for the meteorological stations used in this paper.

STUDY AREA
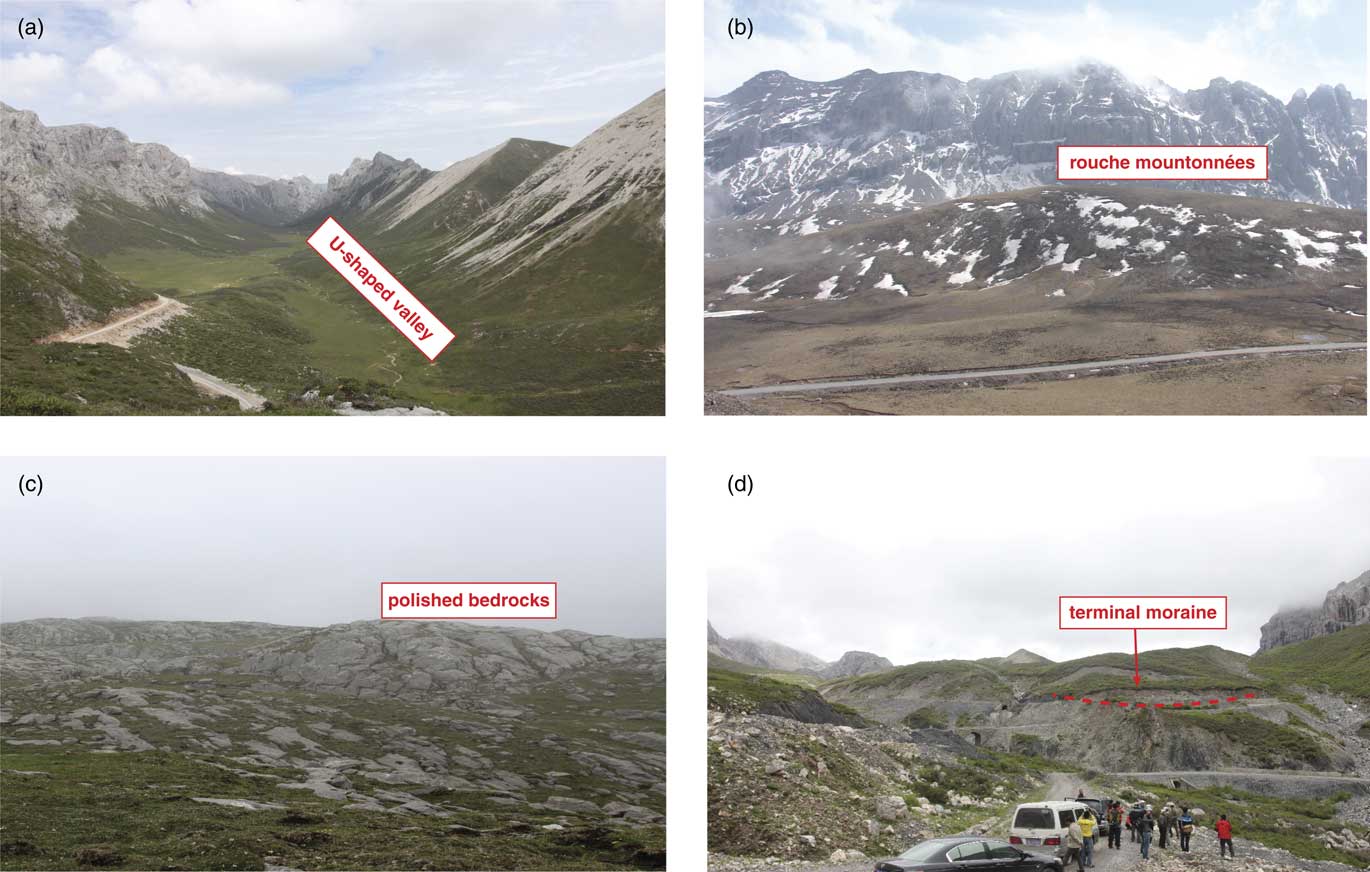
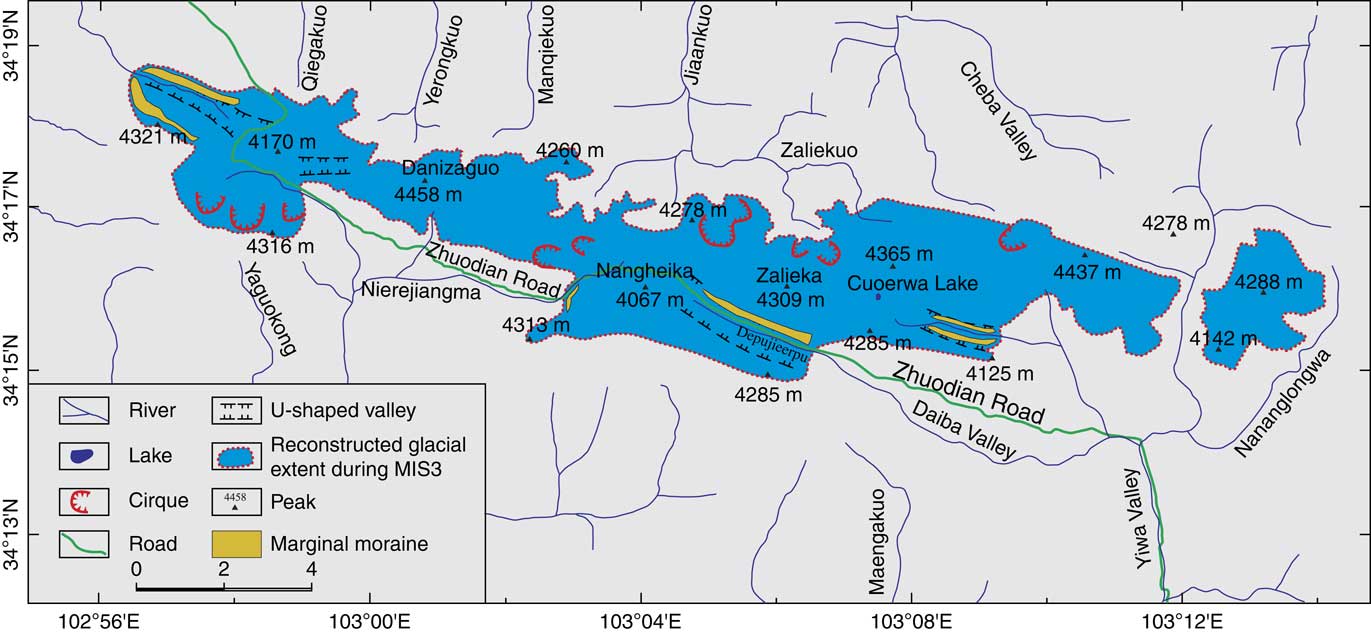
The Die Shan (34º15´ to 34º19´N, 102º56´ to 103º14´E) is located on the northeastern border of the Tibetan Plateau (Fig. 1a). The highest peak, Danizaguo, is 4458 m asl, and the main upper surface of the mountain is a planation surface at 4200 m asl (Fig. 1b). The climate of Die Shan is entirely monsoonal with wet summers and dry winters, and moisture is mainly from the South Asian monsoon (Wang et al., Reference Wang, Clemens, Beaufort, Braconnot, Ganssen, Jian, Kershaw and Sarnthein2005b; Zhang et al., Reference Zhang, Chen, Holmes, Li, Guo, Wang, Li, Lü, Zhao and Qiang2011). At the Langmusi climatological station (Fig. 1c, 34º05´N, 102º38´E, 3363 m asl), the mean annual temperature was 1.4°C and the mean annual precipitation was 753.4 mm in the period 1985–1988, and more than 88% of the annual precipitation was delivered between May and October. Many types of glacial landforms, including U-shaped valleys (Fig. 2a) rouche mountonnées (Fig. 2b), polished bedrock (Fig. 2c), and moraines (Fig. 2d) have been identified above 3700 m asl in the Die Shan (Zhao et al., Reference Zhao, Wang, Shen, Yin and Wu2013; Fig. 3). Polished bedrock, paleo-firn basins, and whaleback rocks are present above 4200 m asl on the planation surface (Zhao et al., Reference Zhao, Wang, Shen, Yin and Wu2013). There are ninecirques and four U-shaped valleys preserved at altitudes of about 4030 to 4150 m asl and 3700 to 4010 m asl, respectively (Zhao et al., Reference Zhao, Wang, Shen, Yin and Wu2013; Fig. 3). At the southwest of Nangheika, a terminal moraine (103º02´52.71”, 34º15´53.83”) is present at an altitude of about 3780 m asl (Zhao et al., Reference Zhao, Wang, Shen, Yin and Wu2013; Fig. 2d and 3).

(color online) Distribution of glacial erosional and depositional landforms of the Die Shan (modified after Zhao et al., Reference Zhao, Wang, Shen, Yin and Wu2013).

Present theoretical ELA of Die Shan
As Die Shan is not currently glacierized, a present-day theoretical ELA (ELAt) in the free atmosphere is needed to calculate past shifts in ELA compared to present (ΔELA). We used an iterative approach to calculate ELAt that was used previously in the Dalijia Shan (Wang et al., Reference Wang, Cui, Harbor, Zheng and Yao2015) and that is based on relationships between the annual precipitation (Pa, mm), the mean atmospheric temperature in summer (June, July, and August, T6~8, °C), and H (elevation). As there is no climate station on Die Shan, data from five meteorological stations close to the Die Shan (Fig.1b, Table 1; http://cdc.cma.gov.cn) were used to derive optimum regression relationships between H and T6~8 as well as Pa. This analysis showed that T6~8 and Pa are linearly correlated with elevation in this region:
 $$T_{{6\,\sim\,8}} \,{\equals}\,{\minus}{\rm 0}{\rm .0055}H{\plus}{\rm 28}{\rm .469}\quad {\rm R}^{2} \,{\equals}\,0.99$$
 $$P_{a} \,{\equals}\,{\rm 0}{\rm .1411}H{\plus}{\rm 219}{\rm .58}\quad R^{2} \,{\equals}\,0.73$$
Summary of modern climate data for meteorological stations in the Die Shan region. T a , annual mean temperature; P 6-8 , summer mean precipitation

Using the iterative model, we started with an initial ELA of 4800 m asl because the ELAs of modern glaciers on the eastern Tibetan Plateau are about 4600 to 5000 m asl (Shi et al., Reference Shi, Huang and Yao2000). In addition, a relationship between T6~8 and Pa at the ELA is needed. Using the T6~8 and Pa at the ELA from 17 glaciers in western China, Shi et al. (Reference Shi, Huang and Ren1988) derived a logarithmic relationship between T6~8 and Pa: T6~8=–15.4 + 2.48l n Pa. Using the initial ELA we determine T6~8 and Pa at 4800 m asl from equations 1 and 2, then these values were input into the logarithmic formula to test whether they also satisfied this equation. If not, the initial ELA was adjusted until T6~8 and Pa at the initial ELA from equations 1 and 2 reach a best fit for the logarithmic formula. This iterative approach resulted in an ELAt for Die Shan of 4903 m asl.
Reconstructed maximum glacier extent
The distribution and features of glacial landforms on the Die Shan were mapped by Zhao et al. (Reference Zhao, Wang, Shen, Yin and Wu2013) based on remote sensing and field mapping. Zhao et al. (Reference Zhao, Wang, Shen, Yin and Wu2013) then used the pattern of oldest glacial landforms and deposits to constrain the maximum extent of past glaciation (Fig. 3). Quaternary glacial landforms and deposits (cirques, U-shaped valleys, whaleback rocks, polished bedrock, and lateral and end moraines) are mainly located on the west, north, and south of Die Shan, so the oldest glacial extent is well constrained in these areas. Along the east of Die Shan, where glacial landforms and deposits are poorly preserved, the ice limits were estimated by Zhao et al., (Reference Zhao, Wang, Shen, Yin and Wu2013) from the transition from U- to V-shaped valleys. Based on this approach, the oldest and most extensive glacial extent was an ice cap (the Die Ice Cap [DIC]) that covered an area of 65 km2 and had minimum and maximum ice elevations of 3520 and 4460 m asl, respectively (Fig. 3).
On the Tibetan Plateau during the Quaternary, glaciations are the combined result of global cooling and local tectonic uplift (Zhou et al., 2006, Reference Zhou, Li, Zhao, Wang and Zheng2011). Although there is no current numerical age control for the glacial landforms on the DIC, an initial age assignment can be made using regional comparison. Dalijia Shan, which is located 140 km northwest of Danizaguo (Fig. 1b), has a summit planation surface at 4000 to ~4300 m asl (Wang et al., Reference Wang, Kassab, Harbor, Caffee, Cui and Zhang2013a). The mean annual temperature of the Dalijia Shan planation surface is –2.8ºC to ~–1.9 ºC, and the mean annual precipitation is 800 to ~900 mm (Wang et al., Reference Wang, Cui, Harbor, Zheng and Yao2015). In comparison, the planation surface of Die Shan has a mean annual temperature of about –1.7ºC, and a mean annual precipitation is about 800 mm (from equations 1 and 2). The climate of Dalijia Shan and Die Shan are both dominated by the East Asian and South Asian monsoons (Wang et al., Reference Wang, Clemens, Beaufort, Braconnot, Ganssen, Jian, Kershaw and Sarnthein2005b; Zhang et al., Reference Zhang, Chen, Holmes, Li, Guo, Wang, Li, Lü, Zhao and Qiang2011). Thus, the topography and climate of Dalijia Shan and Die Shan are similar. In addition, based on the incision rate of two major rivers (he=river), Daxia He (Li et al., Reference Li, Fang, Van der Voo, Zhu, Niocaill, Ono and Pan1997) and Tao He (Cui, Reference Cui2015), the surface uplift of Dalijia Shan and Die Shan since MIS3 have been about 29 m (Wang et al., Reference Wang, Cui, Harbor, Zheng and Yao2015) and 12 m (discussed below), respectively, both small uplifts that would have only minor effects on glacial history. Therefore, we hypothesize that the glacial events of Dalijia Shan and Die Shan should be broadly similar in age. 10Be exposure ages of eight samples were collected on the oldest lateral moraine within the Deheisui Valley of Dalijia Shan, and potential inheritance and incomplete exposure have been taken into account in analyzing the apparent age results. As a result, the oldest glacial advance of Dalijia Shan has been assigned to mid-MIS 3 (38.6 ka, Wang et al., Reference Wang, Kassab, Harbor, Caffee, Cui and Zhang2013a), and thus, following Zhao et al. (Reference Zhao, Wang, Shen, Yin and Wu2013), we conclude that landforms associated with the DIC were deposited in mid-MIS 3. If additional data from future research leads to a revised age designation, our climate reconstruction would apply to that revised timing of glaciation.
METHODS
A primary goal of the work presented here is to use the glacial extent mapped by Zhao et al. (Reference Zhao, Wang, Shen, Yin and Wu2013) to estimate paleoclimatic conditions. We do this by reconstructing the former ELA using mapped ice marginal positions and a reconstructed ice surface profile. To check for consistency, we use two different approaches to estimate the paleo ELA. We then model changes in past temperature and precipitation required to produce the observed change in ELA.
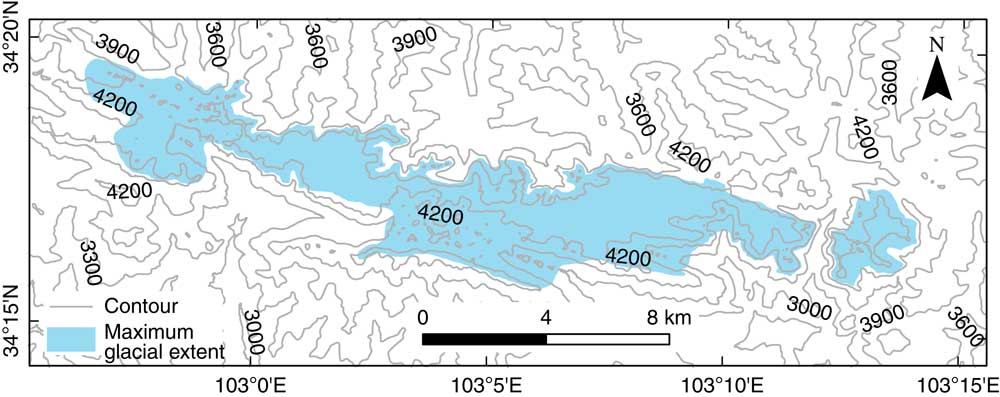
Ice surface profile To derive past ELA, it is necessary to reconstruct the former ice surface. The established relationship between basal shear stress and ice thickness (Plummer and Phillips, Reference Plummer and Phillips2003; Laabs et al., Reference Laabs, Plummer and Mickelson2006) was used to determine the ice surface of the DIC (Fig. 4):
 $$\tau \,{\equals}\,\rho gh\sin \alpha $$
where τ is the basal shear stress, ρ is the density of ice (917 kg m-3), g is the gravitational acceleration (9.81 m s-2), h is ice thickness (m), and α is the surface slope of the ice in degrees. A typical value of τ is 100 kPa for an ice cap (Paterson, Reference Paterson1994; Benn and Hulton, Reference Benn and Holton2010), and there is no need to include adjustments for valley wall effects, as these would be minimal or absent for much of the ice cap.
(color online) Reconstruction of surface contour for the Die Ice Cap.

Reconstructing former ELA
Accumulation Area Ratio (AAR) method
For a glacier in steady state, the ratio of the accumulation area to the area of a glacier (AAR; Meier, Reference Meier1962) is constant. For mid- and high-latitude glaciers, the AAR is in the range 0.5 to 0.8 and AAR is 0.6±0.05, for mountain glaciers (Porter, Reference Porter1975) or 0.67 (Kaser and Osmaston, Reference Kaser and Osmaston2002). Because of the very asymmetric area-altitude distributions of piedmont glaciers and ice caps, however, the AARs for these types of glaciers are exceptions to this rule (Meier and Post, Reference Meier and Post1962). Kaser and Osmaston (Reference Kaser and Osmaston2002) suggest that the AAR of an ice cap is between 0.4 and 0.5 and these values were used in this paper.
Area-Altitude Balance Ratio (AABR) method
The AABR method is based on two assumptions: (1) the gradients of accumulation and ablation are linear or approximately linear; and (2) that the ratio of the two gradients (BR) is known. This method can give robust ELA values. The hypsometry of the glacier is essential to this method, however, and so it is best applied where good topographic information is available and the surface contours of former glaciers are well constrained (Benn and Gemmell, Reference Benn and Gemmell1997; Benn and Lehmkuhl, Reference Benn and Lehmkuhl2000; Osmaston, Reference Osmaston2005). Although we do not have a well-constrained paleo-hypsometry, we included this approach as a check for consistency with the AAR method. If the two approaches give similar values, then it adds to confidence that the paleo-ELA value was reasonable. The Osmaston (Reference Osmaston2005) AABR method was used to estimate the ELA of Die Shan and, as there are no glaciers at this site at present, the average BR of glaciers around the world (1.75±0.71; Rea Reference Rea2009) was used here.
Post-glacial uplift
To determine paleo-ELA in tectonically active areas, tectonic uplift should be taken into account to see if it makes a significant difference in the ELA determination (Hebenstreit, Reference Hebenstreit2006). The incision rate of Tao He, which is located on the northern slope of Die Shan (Fig. 1b), has been estimated at 0.3 m ka-1 since 0.13 Ma using the spatial distribution and chronology of fluvial terraces (Cui, Reference Cui2015). Assuming that the incision rate keeps pace with the rock uplift rate (Pan et al., Reference Pan, Su, Hu, Hu, Gao, Li and Kirby2009), a surface uplift of Die Shan is about 12 m since the glacial advance during mid-MIS 3 (38.6 ka, Wang et al., Reference Wang, Kassab, Harbor, Caffee, Cui and Zhang2013a).
Reconstructing paleoclimate: Energy and mass balance model (EMBM)
Mass and energy balance at ELA
The basic mass and energy balance equation used is:
 $$b\left( z \right)\,{\equals}\,c\left( z \right){\minus}a\left( z \right)\quad \left[ {{\rm mm}} \right]$$
 $$Q_{R} \left( z \right){\plus}Q_{S} \left( z \right){\plus}Q_{M} \left( z \right){\plus}Q_{L} \left( z \right){\plus}Q_{P} \left( z \right){\plus}{\rm \Delta }Q\,{\equals}\,{\rm 0}\quad \left[ {{\rm MJ}\,{\rm m}^{{{\minus}2}} \,{\rm d}^{{{\minus}1}} } \right]$$
where z is the surface elevation of glacier; b, c, and a are the mass balance, accumulation, and ablation, respectively (Kaser and Osmaston, Reference Kaser and Osmaston2002); Q R is the heat flux resulting from the radiation balance; Q S is the sensible heat flux; Q M is the energy available for melting the snow/ice surface; Q L is the latent heat flux; Q P is the heat flux supplied by precipitation; and ΔQ is the heat conduction at the glacier surface. ΔQ is neglected from here on, as it is a small term in the seasonal energy balance (Kayastha et al., Reference Kayastha, Ohata and Ageta1999; Ohmura, Reference Ohmura2001). Assuming that all precipitation that falls as snow at the ELA, Q P is zero (Rupper and Roe, Reference Rupper and Roe2008).
Heat fluxes for ablation usually consist of Q M and Q L (Kaser and Osmaston, Reference Kaser and Osmaston2002; Rupper and Roe, Reference Rupper and Roe2008), so the specific ablation can be expressed as:
 $$a\left( z \right)\,{\equals}\,\tau \left( {{{\rm 1} \over {L_{M} }}Q_{M} \left( z \right)} \right){\plus}{{\rm 1} \over {L_{V} }}Q_{L} \left( z \right)$$
where τ is the number of days in the melting season with a daily mean air temperature over 0°C, which is assumed to be constant on a given glacier (Zhang et al., Reference Zhang, Fujita, Ageta, Nakawo, Yao and Pu1998). L M is the specific latent heat of melting (0.334 MJ kg-1) and L V is the latent heat of vaporization (2.514 MJ kg-1). If Q M (z) is replaced using equation 5, the result is:
 $$a\left( z \right)\,{\equals}\,{\minus}\tau \left( {{{\rm 1} \over {L_{M} }}\left( {Q_{R} \left( z \right){\plus}Q_{S} \left( z \right)} \right){\plus}\left( {{{\rm 1} \over {L_{V} }}{\minus}{{\rm 1} \over {L_{M} }}} \right)Q_{L} \left( z \right)} \right)$$
As the accumulation is equal to the ablation at the ELA (assuming ELA=h 0 ), the accumulation at ELA (c(h 0 )) is:
 $$c\left( {h_{{\rm 0}} } \right)\,{\equals}\,{\minus}a\left( {h_{{\rm 0}} } \right)\,{\equals}\,{\rm \tau }\left( {{{\rm 1} \over {L_{M} }}\left( {Q_{R} \left( {h_{{\rm 0}} } \right){\plus}Q_{S} \left( {h_{{\rm 0}} } \right)} \right){\plus}\left( {{{\rm 1} \over {L_{V} }}{\minus}{{\rm 1} \over {L_{M} }}} \right)Q_{L} \left( {h_{{\rm 0}} } \right)} \right)$$
If the climate changes, a new ELA will be established at h 0 +Δh. Equation 8 can be expressed at the new altitude as:
 $$\eqalignno{ c\left( {h_{{\rm 0}} } \right)&{\plus}{\rm \delta }c{\plus}{{\partial c\left( z \right)} \over {\partial z}}{\rm \Delta }h\,\cr&{\equals}\,{\rm \tau }\left( {{{\rm 1} \over {L_{M} }}\left( {Q_{R} \left( {h_{{\rm 0}} } \right){\plus}{\rm \delta }Q_{R} {\plus}{{\partial Q_{R} \left( z \right)} \over {\partial z}}{\rm \Delta }h{\plus}Q_{S} \left( {h_{{\rm 0}} } \right){\plus}{\rm \delta }Q_{s} } \right.} \right.{\plus} \cr & \left. {{{\partial Q_{s} \left( z \right)} \over {\partial z}}{\rm \Delta }h} \right){\plus}\left. {\left( {{{\rm 1} \over {L_{V} }}{\minus}{{\rm 1} \over {L_{M} }}} \right)\left( {{\rm Q}_{{\rm L}} \left( {h_{{\rm 0}} } \right){\plus}{\rm \delta }Q_{L} {\plus}{{\partial Q_{L} \left( z \right)} \over {\partial z}}{\rm \Delta }h} \right)} \right) $$
where δc is a change in the accumulation; δQ R is a change in the radiation; δQ S is a change in the sensible heat; δQ L is a change in the latent heat, and ∂c(z)/∂z,∂Q R (z)/∂z,∂Q s (z)/∂z, and ∂Q L (z)/∂z are their altitude gradients, respectively. Subtracting equation 8 from 9 gives:
 $$\eqalignno{ {\rm \delta }c\!{\plus}\!{{\partial c\left( z \right)} \over {\partial z}}{\rm \Delta }h\,{\equals}\, & {\rm \tau }\left( {{{\rm 1} \over {L_{M} }}\!\left( {\left. {{\rm \delta }Q_{R} {\plus}{{\partial Q_{R} \left( z \right)} \over {\partial z}}{\rm \Delta }h{\plus}{\rm \delta }Q_{s} {\plus}{{\partial Q_{s} \left( z \right)} \over {\partial z}}{\rm \Delta }h} \!\right)} \right.}\!\! \right \cr & {\plus}\left( {{{\rm 1} \over {L_{V} }}{\minus}{{\rm 1} \over {L_{M} }}} \right)\left( {{\rm \delta }Q_{L} {\plus}{{\partial Q_{L} \left( z \right)} \over {\partial z}}{\rm \Delta }h} \right)\bigg) $$
Equation 10 relates Δh to changes in the climate factors.
Radiation
The radiation balance Q R (z) is composed of the absorbed portion of global radiation G(z)(1-r(z)), the atmospheric incoming longwave radiation A(z) and the outgoing longwave radiation E(z):
 $$Q_{R} \left( z \right)\,{\equals}\,G\left( z \right)\left( {{\rm 1}{\minus}r\left( z \right)} \right){\plus}A\left( z \right){\plus}E\left( z \right)$$
where G(z) is the global radiation and r(z) is the albedo. A(z) and E(z) can be calculated from climate data:
 $$A\left( z \right)\,{\equals}\,{\epsilon}_{a} \sigma T_{a}^{{\rm 4}} \left( z \right)$$
 $$E\left( z \right)\,{\equals}\,{\epsilon}_{s} \sigma T_{s}^{{\rm 4}} \left( z \right)$$
where ε a and ε s are emission coefficients of the atmosphere near the surface and the surface of the glacier, which are all fixed at 1 (Kaser and Osmaston, Reference Kaser and Osmaston2002). σ is the Stefan-Boltzmann constant (4.9 × 10⁻⁹ MJ m-2d-1 ºC-4). T a (z) and T s (z) are the temperatures of the atmosphere near the surface and the surface of the glacier, respectively. Thus, the altitude gradient of Q R (z) can be written as:
 $$\eqalignno{ {{\partial Q_{R} \left( z \right)} \over {\partial z}}\,&{\equals}\,{{\partial G\left( z \right)} \over {\partial z}}\left( {1{\minus}r\left( z \right)} \right){\minus}G\left( z \right){{\partial r\left( z \right)} \over {\partial z}}\cr&{\plus}4\sigma T_{a}^{3} {{\partial T_{a} \left( z \right)} \over {\partial z}}{\plus}4\sigma T_{s}^{3} {{\partial T_{s} \left( z \right)} \over {\partial z}}$$
where ∂G(z)/∂z, ∂r(z)/∂z, ∂T a (z)/∂z, and ∂Ts(z)/∂z are the altitude gradients of G(z), r(z), T a (z), and T s (z) respectively.
With a linearization of A(z) and a simplifying assumption that T a =0ºC on the ELA and T s =0ºC for a melting surface during the whole ablation period (Kaser and Osmaston, Reference Kaser and Osmaston2002), making α R = 4σ × 273.153, δQ R is:
 $${\rm \delta }Q_{R} \,{\equals}\,{\rm \delta }\left( {G\left( {{\rm 1}{\minus}r} \right)} \right){\plus}{\rm \delta }A\,{\equals}\,{\rm \delta }\left( {G{\rm (1}{\minus}r{\rm )}} \right){\plus}{\rm \alpha }_{R} {\rm \delta }T_{a} $$
where δ(G(1-r)) is a change in the global radiation; δA is a change in the atmospheric incoming longwave radiation; and δT a is a change in the temperature of the atmosphere near the surface. As T s =0ºC, the altitude gradient of E(z) can be considered to be zero. Considering the small difference of surface conditions between h 0 and h 0 +Δh, the altitude gradient of r(z) can also be omitted. In addition, the altitude gradient of G(z) through the glacier is small and only the altitude gradient of A(z) needs to be taken into account (Kuhn Reference Kuhn1979). Therefore, the altitude gradient of Q R (z) can be simplified as:
 $${{\partial {\rm Q}_{{\rm R}} \left( {\rm z} \right)} \over {\partial {\rm z}}}\,{\equals}\,{\rm 4\sigma }{\times}{\rm 273}{\rm .15}^{{\rm 3}} {{\partial T_{a} \left( z \right)} \over {\partial {\rm z}}}\,{\equals}\,{\rm \alpha }_{R} {{\partial T_{a} \left( z \right)} \over {\partial {\rm z}}}$$
Sensible heat and latent heat
The sensible heat can be computed by
 $$Q_{S} \left( s \right){\equals}\alpha _{s} \left( {T_{a} \left( z \right){\minus}T_{s} \left( z \right)} \right)$$
where a s is the heat transfer coefficient for turbulent exchange [MJ m-2 d-1 ºC -1]. As discussed above, T s =0ºC for the melting surface, so the altitude gradient of Q S (z) and a change in the Q S (z) can be expressed as:
 $${{\partial Q_{S} \left( z \right)} \over {\partial z}}\,{\equals}\,\alpha _{s} {{\partial T_{a} \left( z \right)} \over {\partial z}}$$
 $${\rm \delta }Q_{S} \,{\equals}\,\alpha _{s} \delta T_{a} $$
The latent heat can be written as:
 $$Q_{L} \left( {\rm z} \right)\,{\equals}\,D_{s} \rho _{{\rm 0}} {{\rm 1} \over {p_{{\rm 0}} }}L_{V} \left( {e_{a} {\minus}e_{s} } \right)$$
where D s is the turbulent transfer coefficient; ρ 0 is the density of air at sea level (1.29 kg m-3); p 0 is the atmospheric pressure at standard sea level (1013 hPa; and, e a and e s are the vapor pressure of the above surface air and vapor pressure at the surface (hPa), respectively.
The response of ELA to climatic variations
Additional simplifications to equation 10 are needed to reduce further the number of unknown variables. Based on heat-balance studies that have been performed at glaciers on the eastern margin of the Tibetan Plateau (e.g., Kang, Reference Kang1996; Chen et al., Reference Chen, Duan, Wang, Jang, He, Gao and Xie2007; Sun et al., Reference Sun, Qin, Ren, Wu, Du, Liu and Hou2011), changes in latent heat produce only minor change in heat balance, so that changes in it and its altitude gradient are both negligible and so can be omitted. Thus, based on the parameterization and assumptions above, it is possible to simplify equation 10 and solve for a change in the ELA (Δh):
 $${\rm \Delta }h\,{\equals}\,{{{\tau \over {L_{M} }}\left( \delta{\delta \left( {{\rm G}\left( {{\rm 1}{\minus}r} \right)} \right){\plus}\left( {\alpha _{R} {\plus}\alpha _{s} } \right)\delta \delta_{a} } \right){\minus}\delta c} \over {{{\partial c\left( z \right)} \over {\partial z}}{\minus}{\tau \over {L_{M} }}\left( {\alpha _{R} {\plus}\alpha _{s} } \right){{\partial {\rm T}_{{\rm a}} \left( z \right)} \over {\partial z}}}}$$
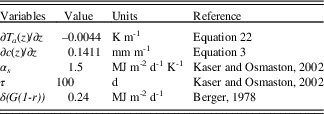
In this paper, we calculate temperature depressions related to ELA changes from equation 21. To do this, all variables in equation 21 must be constrained. The ∂Ta (z)/∂z for Die Shan was derived from the linear regression of the mean annual temperature and altitude:
 $$T_{a} \left( z \right)\,{\equals}\,{\minus}{\rm 0}{\rm .0044}H{\plus}{\rm 15}{\rm .933}\;R^{2} \,{\equals}\,0.99$$
Δh was estimated based on geomorphological evidence and can be derived from equation 3 (Table 2). The magnitude of other variables in equation 21 cannot be established exactly for the Die Shan, but their mean values have been constrained well for mid-latitudes (Table 2), and these values were used here. We ran the EMBM with precipitation perturbations from –90% to 100% (10% steps) of present to capture possible climatic conditions during mid-MIS3.
Variables used in equation 21 and the associated references.

RESULTS
Mid-MIS 3 ELA values
The ELA of DIC and ELA depressions compared to today are compiled in Table 3, adjusted after regional tectonic uplift. With AAR range from 0.4 to 0.5 (Kaser and Osmaston, Reference Kaser and Osmaston2002), the ELA is 4137 to 4187 m asl. Using a BR of 1.75±0.71, the ELA derived from the AABR method was 4071 to 4132 m asl, and the average value was 4087 m asl. Compared to the ELAt of Die Shan (4903 m asl), the ΔELA of DIC ranged from 844 to 716 m, with an average value of 786±31 m (uncertainty is one standard deviation). Within uncertainty, this is the same ΔELA as the mid-MIS3 ΔELA of Dalijia Shan (772±78 m; Wang et al., Reference Wang, Cui, Harbor, Zheng and Yao2015), which is near the northwest of Die Shan. This ΔELA, however, is more than twice the estimated ΔELA during mid-MIS 3 in the northeastern Tibetan Plateau (158 to 468 m; Heyman, Reference Heyman2014). Previous studies of ΔELA across the Tibetan Plateau have suggested that there are important regional differences in ΔELA (Owen et al., Reference Owen, Finkel and Caffee2002; Owen and Benn, Reference Owen and Benn2005; Heyman, Reference Heyman2014), and it is thus not surprising that our estimated ΔELA does not match those from distant regions. This may reflect varied ELA reconstruction methods and local climatic and topographic characteristics (Ramage et al., Reference Ramage, Smith, Rodbell and Seltzer2005). The two ELA reconstruction methods used in this study had deviation from the mean of no more than 1.7%, and this consistency between methods adds confidence that our calculated ΔELA is reliable and can be applied to reconstruct the presumed mid-MIS 3 climate of Die Shan.
Calculated ELAs.

a The error of the mean value is 1-sigma
Mid-MIS3 temperature reconstruction
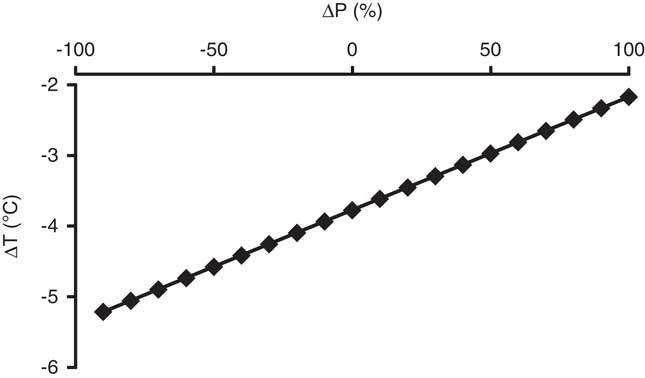
An average ΔELA of 805 m was used with the EMBM discussed above to estimate possible mid-MIS 3 paleoclimate combinations that would produce this change in ELA. With precipitation changes (ΔP) of –90 to +100% (in 10% step increments), temperature drops (ΔT) required to produce the observed ΔELA are shown in Figure 5. Considering that the mid-MIS3 precipitation of Die Shan was about 50 to ~100% of present (based on Rao et al., Reference Rao, Chen, Cheng, Liu, Wang, Lai and Bloemendal2013), the ΔT derived from the EMBM suggest that the actual temperature reduction was between 3.8°C and 4.6°C. A change in precipitation of±50% of modern values only causes a±0.8°C change in the temperature values to match the required ΔELA.
Plot of temperature and precipitation combinations that yield the mid-MIS 3 ELA depression in model simulations.

DISCUSSION MIS3 glacial advance of the northeastern Tibetan Plateau
Several studies have shown that the LLGM in the northeastern Tibetan Plateau occurred during MIS 3. Based on the 10Be exposure ages, glacial advances during MIS 3 at Nianbaoyeze (Owen et al., Reference Owen, Finkel, Ma, Spencer, Derbyshire, Barnard and Caffee2003), Anyemaqen (Owen et al., Reference Owen, Finkel, Ma, Spencer, Derbyshire, Barnard and Caffee2003), Bayan Har Shan (Heyman et al., Reference Heyman, Stroeven, Caffee, Hättestrand, Harbor, Li, Alexanderson, Zhou and Hubbard2011), and Dalijia Shan (Wang et al., Reference Wang, Kassab, Harbor, Caffee, Cui and Zhang2013a) were much larger than the MIS 2 glacial advances in these regions. Moreover, a review of published 10Be exposure ages from the mid-latitude westerlies and monsoon-influenced regions on the Tibetan Plateau (Dortch et al., Reference Dortch, Owen and Caffee2013; Murari et al., Reference Murari, Owen, Dortch, Caffee, Dietsch, Fuchs, Haneberg, Sharma and Townsend-Small2014) suggested that the LLGM of the mid-latitude westerlies and monsoon-influenced regions occurred during MIS 4 and MIS 3, respectively. As the climate of Die Shan is influenced by the South Asian monsoon, this is also consistent with an MIS 3 age for the LLGM here. Finally, nearby Dalijia Shan has a similar climate and relief to Die Shan, and have an MIS 3 LLGM, and so these lines of evidence lead us to assign the oldest and most extensive glacial advance of the ice cap on Die Shan to MIS 3.
Glacier sensitivity to climate change
It is difficult to directly quantify glacier sensitivity to climate change because many climate variables influence glacier mass balance (Xu and Glasser, Reference Xu and Glasser2015). We can infer the response of glaciers to climate change, however, by estimating ELA shifts. In this section, we use our EMBM results to discuss DIC sensitivity to temperature and precipitation.
Based on an analysis of the relationship between temperature and precipitation at the ELA of 70 glaciers across the world, Ohmura et al. (Reference Ohmura, Kasser and Funk1992) suggest that a precipitation change of 500 mm at the ELA is accommodated by a 1.25°C to 1.65°C change in temperature. In this section, we use this empirical value coupled with EMBM to discuss the DIC sensitivity to temperature and precipitation. If temperature is held constant, a ±500 mm change in precipitation would account for about±190 m change in ELA at the DIC, based on our EMBM. Likewise, with no change in the precipitation and a change in temperature of±1.25°C to±1.65°C, the shift of ELA for the DIC is about±269 to±355 m. These results indicate that the DIC is more sensitive to temperature changes than precipitation changes (also see Fig. 5). Based on reconstructed precipitation from the Yuanbao profile, which is located on the northern slope of Die Shan, precipitation during mid-MIS 3 was about 50 to 100% of present (Rao et al., Reference Rao, Chen, Cheng, Liu, Wang, Lai and Bloemendal2013). Thus, precipitation changes could not account for the estimated ΔELA of DIC because the climate was drier in mid-MIS 3, rather than wetter. As a consequence, we conclude that changing temperature is the principal cause of the mid-MIS 3 ELA shift at Die Shan.
Mid-MIS 3 temperature estimates
On the northeastern Tibetan Plateau, vegetation assemblages and lake-levels are more sensitive to precipitation changes and they are commonly used to estimate moisture changes rather than temperature variability (Herzschuh et al., Reference Herzschuh, Tarasov, Wünnemann, Herzschuh, Mohammadi, Mingram, Kqrschner and Riedel2004; Wang et al., Reference Wang, Clemens, Beaufort, Braconnot, Ganssen, Jian, Kershaw and Sarnthein2005a; Chen et al., Reference Chen, Xu, Chen, Birks, Liu, Zhang and Jin2015). In addition, the amplitude of changes in temperature at high mountain area does not correspond to that at low altitude (Yao et al., Reference Yao, Liu, Wang and Shi2000; Stansell et al., Reference Stansell, Polissar and Abbott2007; Li et al., Reference Li, He, Wang, Wang, Xin, Zhang and Cao2011). Quantitative reconstructions of paleotemperatures based on paleo-glacier analysis are rare for the northeastern Tibetan Plateau (e.g., Wang et al., Reference Wang, Cui, Harbor, Zheng and Yao2015). ELA variability of the DIC is more sensitive to changes in temperature than precipitation and, in addition, other proxy data indicate that precipitation remained constant or decreased in the DIC region during MIS 3. Thus, we conclude above that temperature changes were the key driver of MIS 3 glacier expansion at DIC. There are limitations to the approach used here, however. As the ELA is influenced by temperature, precipitation, solar radiation, or a combination of these (Rupper et al., Reference Rupper, Roe and Gillespie2009), it is limiting to convert the ΔELA to a temperature drop using the atmospheric lapse rate. Local climate would need to be parameterized in terms of precipitation and temperature using analytic methods for even more robust results (Kuhn, Reference Kuhn1979; Kaser and Osmaston, Reference Kaser and Osmaston2002; Kerscher and Ivy-Ochs, Reference Kerschner and Ivy-Ochs2008; Rupper et al., Reference Rupper, Roe and Gillespie2009).
With a ΔELA of –786 m and mid-MIS 3 precipitation at 50 to ~100% of present for Die Shan, our model suggests that the temperature during the mid-MIS 3 was 3.8°C to 4.6°C cooler than today. This temperature drop agrees well with mid-MIS 3 temperature reconstructions of adjacent regions. Wang et al. (Reference Wang, Cui, Harbor, Zheng and Yao2015) estimated a mid-MIS 3 cooling for Dalijia Shan of 3.3°C–6.8°C or 4.2°C–5.6°C from two glacier-climate models with mid-MIS 3 precipitation at 50 to 100% of modern. The oxygen isotope record of the RM core from the Zoigê Basin (Wu et al., Reference Wu, Wang, Shi and Lei2000) and δ18O records in the Guliya ice core in the West Kunlun Mountains (Shi et al., Reference Shi, Huang and Yao2000; Shi and Yao, Reference Shi and Yao2002) indicated that the mid-MIS3 temperature was 5°C colder than present. This consistency adds to the confidence of our results from the EMBM that explains a ΔELA of –786 m on Die Shan as a result of 50 to 100% of modern values for precipitation and a temperature depression of 3.8°C to 4.6°C.
Drivers of glacial advance during the MIS3 and MIS2
Based on comparisons with the Dalijia Shan, we have hypothesized that the LLGM of Die Shan occurred during MIS 3, rather than LGM (MIS 2), and our analysis suggests that this glacial expansion was primarily a result of a temperature depression of 3.8°C to 4.6°C. It is important to put these results in context with other proxy-based reconstructions of LGM paleotemperatures for the Tibetan Plateau. Pollen analysis of a sediment core collected from a medium-sized lake at 3200 m asl in the Qilian Mountains (Herzschuh et al., Reference Herzschuh, Kürschner and Mischke2006), suggests LGM cooling of 4°C to ~7°C. This value is similar to recent estimates of LGM cooling derived from a glacier-climate model that incorporated multiple climate variables applied at the head of the Tashkurgan Valley (5°C to 8°C; Xu et al., Reference Xu, Hu and Qiao2013) and in the Yingpu Valley (4.0°C to 5.9°C; Xu, Reference Xu2014). Shi et al. (Reference Shi, Zheng and Yao1997) and Yao et al. (Reference Yao, Liu, Wang and Shi2000) inferred a LGM temperature depression of 6°C to 9°C from records of ice core δ18O and lake pollen on the Tibetan Plateau. Thus, our mid-MIS 3 temperature depression at DIC was less than the LGM temperature depression across other parts of the Tibetan Plateau. If the MIS 2 temperature depression at DIC was also larger than the temperature depression during MIS 3, then it would have required a substantial reduction in precipitation in the DIC area during MIS 2 to prevent expansion of the DIC to a larger extent than during MIS 3. Thus, it may be that the LLGM of Die Shan was caused by a different combination of temperature and precipitation between MIS 3 and MIS 2. The South Asian Monsoon was stronger during MIS 3 than MIS 2 as a consequence of higher insolation during MIS 3 (Prell and Kutzbach, Reference Prell and Kutzbach1987; Wang et al., Reference Wang, Cheng, Edwards, An, Wu, Shen. and Dorale2001) and overall monsoon precipitation was higher during MIS 3 than MIS 2. In addition, stable isotope records from calcrete in the Thar Desert and paleoclimate proxies of pollen, dune activity, δ13C, and δ18O in India have been used to suggest that it was more humid during MIS3 than MIS2 (Andrews et al., Reference Andrews, Singhvi, Kailath, Khun, Dennis, Tandon and Dhir1998). Furthermore, at the Yuanbao profile, precipitation of mid-MIS3 was even higher than that during LGM (Rao et al., Reference Rao, Chen, Cheng, Liu, Wang, Lai and Bloemendal2013). As a consequence, the LLGM of Die Shan was likely caused by a cold-humid climate during mid-MIS 3 that resulted in even more intense glaciation than the slightly colder but even drier climate during MIS2.
CONCLUSION
Based on geomorphic evidence and comparisons with the chronological framework, topography, and modern climatic conditions of the Dalijia Shan, we conclude that the oldest and most extensive glacial advance of Die Shan occurred during mid-MIS 3 rather than MIS 2. Using the AAR and AABR methods adjusted for a regional uplift of 12 m asl since mid-MIS 3, the mid-MIS 3 ELA of Die Shan is estimated at 4059–4187 m asl, with an average of 4117±31 m asl. Compared to the ELAt of Die Shan (4901 m asl), the mid-MIS 3 ELA depressions were 716 to 844 m (average=786±31 m). Based on these calculated ELAs, the paleoclimate of mid-MIS 3 was reconstructed using an EMBM. With the precipitation during mid-MIS 3 of 50 to 100% of modern values and an average ΔELA of 786 m, the temperature was 3.8°C to 4.6 °C lower than present according to the EMBM. This temperature drop is consistent with generally accepted mid-MIS3 climate conditions. Compared with other climate records across the Tibetan Plateau, this mid-MIS3 temperature depression was less than the LGM temperature drop. With separate evidence for paleoprecipitation, we suggest that the mid-MIS 3 LLGM of Die Shan reflects cold-humid conditions and that the smaller extent of MIS 2 glacier expansion at Die Shan resulted from even colder, but also much drier, conditions than mid-MIS 3.
ACKNOWLEDGMENTS
This work was supported by the National Natural Science Foundation of China (Grant Nos. 41571060, 41230743, and 41171063) and the Fundamental Research Funds for the Central Universities (lzujbky-2017-210). J.M.H.’s work on this project was supported by Purdue University.