Introduction
According to the World Health Organization’s Global Burden of Disease (GBD) study in 2013, infectious disease and maternal, neonatal and nutritional factors accounted for more than 13 million deaths worldwide (25%) out of a total 52.8 million. Non-communicable diseases, on the other hand, caused 34.5 million or 65% of deaths worldwide (Lozano et al., Reference Lozano2013). In view of such mortality evolution, most developing countries are exhibiting a drastic change in their disease pattern with an increase in non-communicable deaths (Jacobs et al., Reference Jacobs, Ir, Bigdeli, Annear and Van Damme2012). Modernization, improved sanitation and better housing in developing countries have been effective in controlling infectious diseases (Ezeamama et al., Reference Ezeamama, Viali, Tuitele and McGarvey2006; United Nations, 2012). Omran (Reference Omran1971) termed these changes a ‘transition of epidemiology’, whereby infectious diseases are being replaced by chronic diseases over time due to expanded public health care and sanitation.
Although the transition of the disease pattern from acute communicable to chronic non-communicable disease is widely visible on the world map, there is large variation in the levels and trends of mortality across countries and regions (Mangen et al., Reference Mangen, Gibbons, Kretzschmar, de Wit, Havelaar, van Lier and Rüütel2011). These differences reflect inequalities in the availability of basic necessities and amenities like food, safe drinking water, sanitation, housing and health care. They also reflect differences in risk factors, behavioural choices, demographic characteristics and other societal contexts that affect the survival of individuals (Allen, Reference Allen1995; Madhavan et al., Reference Madhavan, Adams and Simon2003; Thankappan et al., Reference Thankappan, Shah, Mathur, Sarma, Srinivas, Mini and Vasan2010). In India, the disparity ranges from infant, child and maternal mortality to life expectancy at birth (Dyson & Moore, Reference Dyson and Moore1983; Subrmanian et al., Reference Subramanian, Nandy, Irving, Gordon, Lambert and Smith2006; Saikia et al., Reference Saikia, Jasilionis, Ram and Shkolnikov2010). In most cases, disadvantaged individual-level covariates, and the absence of effective policies and programmes were found to be the major contributing factors to this health disparity among subgroups of the Indian population (Subramanian et al., Reference Subramanian, Nandy, Irving, Gordon, Lambert and Smith2006; Mathers et al., Reference Mathers, Boerma and Fat2009; Jacobs et al., Reference Jacobs, Ir, Bigdeli, Annear and Van Damme2012).
Life expectancy at birth in India increased from about 50 years in 1970–1975 to 67 years in 2009–13 (RGI, 1971a, 2013a). Infant mortality rates halved from 100 to 44 per 1000 live births from 1971 to 2012 (RGI, 1971b, 2013b). A similar declining trend is observed in the maternal mortality rate over this period. India has made significant progress in controlling preventable infectious diseases such as diarrhoea, which caused more than half of total deaths during the seventies and early eighties (Gupte et al., Reference Gupte, Ramachandran and Mutatkar2001; RGI, 2013c). Current changes in India’s population age structure, and improved economic status and lifestyles are associated with an increasing incidence in non-communicable diseases (Prentice, Reference Prentice2006; Sinha & Kapoor, Reference Sinha and Kapoor2010). Uttar Pradesh, the most populous state in India with a population of 200 million, recorded 53 infant deaths per 1000 live births and as many as 292 maternal deaths per 100,000 pregnant women in 2012 (RGI, 2013a). The situation is even worse for women without education and from poor economic strata in the state (RGI, 2011; Kumar & Kumar, Reference Kumar and Kumar2012). Given the size of its population, Uttar Pradesh remains very important in a demographic context; any change in its fertility and mortality will affect the national-level estimates of demographic indicators in India.
Although studies on mortality and morbidity have been conducted extensively in the social research domain, the majority only show the national picture in India (Selvaraj & Karan, Reference Selvaraj and Karan2009; Shah & Mathur, Reference Shah and Mathur2010). These studies do not reflect the state scenarios adequately. With this backdrop, the present study is a modest attempt to critically analyse the epidemiological profile of Uttar Pradesh from 1995 to 2004 as an essential prerequisite to addressing public health problems in India. The specific objectives of this study were to examine the levels, trends and patterns of self-reported diseases by selected covariates in Uttar Pradesh, and to analyse the overall burden of infectious and non-communicable diseases in the state using the DALY (disability-adjusted life year).
Methods
This study used data from the 52nd and 60th rounds of the National Sample Survey Organization (NSSO), conducted in 1995–96 and 2004 respectively. The NSSO was set up in 1950 as a permanent survey organization by the Ministry of Statistics and Program Implementation to collect data on various facets of the Indian economy through nationwide sample surveys in order to assist in socioeconomic planning and policymaking. Besides collecting information on its core areas, that is, household consumption and expenditure, the NSSO collects detailed data on morbidity and disease patterns of the population. Using a multi-stage sampling design, the NSSO covers all the states and union territories in India (see National Sample Survey Organization (1998, 2006) for more details). It adopts a uniform sampling procedure and geographical coverage; thus, all its rounds of surveys are comparable. A total of 76,441 and 56,514 participants were incorporated in the 52nd and 60th rounds respectively.
To estimate the burden of disease using the DALY, the Million Death Study (MDS), also known as the Special Survey of Deaths (SSD), was used. This survey was implemented during 2004–05 and covered all deaths from 2001 to 2003 in the Sample Registration System (SRS). The SRS covered over 6645 small areas (sample units) in all the states and union territories in India. The proportion of deaths by particular causes and by age and sex was taken from the MDS.
Outcome variables
Self-reported morbidity
Information on self-reported morbidities is considered important for the estimation of the prevalence of maternal- and childhood-related illnesses. In India, a number of large-scale surveys conducted by NSSO and the National Centre for Applied Economic Research (NCAER) have relied on the use of self-reported morbidity information to report the prevalence and demographic correlates of disease patterns in a population. In both the 52nd and 60th rounds of NSSO, information on 42 different self-reported morbidities was collected, using 15 days prior to the survey date as the reference period. The head of the household or any adult member in the household was the main respondent, depending upon their availability. For children, particularly younger ones, attempts were made to get the required information from their mother. In the present analysis, multiple morbidities for an individual were excluded. For more details about the data collection methods or analysis strategy see the survey reports (National Sample Survey Organization, 1998, 2006).
Self-reported morbidity was classified into five groups: infectious diseases, cardiovascular diseases (CVDs), non-communicable diseases (NCDs), disability and ‘other’. This categorization was based on the International Classification of Disease (ICD) (WHO, 2012). In the 52nd round of the NSSO, fever of short duration, other diagnosed ailments of less than 30 days, undiagnosed ailments of less than 30 days, other diagnosed ailments of more than 30 days and undiagnosed ailments of more than 30 days were classified as ‘other diseases’, whereas in the 60th round fever of unknown origin and other undiagnosed ailments were regarded as ‘other diseases’.
Burden of disease
The overall burden of disease of a population, combining the effects of morbidity and mortality, can be captured with a single numerical value using the DALY (WHO, 2004). This was first developed in 1993 at the Harvard School of Public Health, in collaboration with the World Bank and the World Health Organization (WHO), to assess the global burden of disease (Mathers et al., Reference Mathers, Boerma and Fat2009). The DALY measures the time lived with disability and the time lost due to premature mortality. The computation procedure of the DALY is enumerated as follows:
 $${\rm DALY}={\rm YLL}{\plus}{\rm YLD},$$
where YLL is the years of life lost due to premature mortality and YLD is the years lived with disability. The value of YLL is computed using the following formula:
 $${\rm YLL}=\left( {N/r} \right){\times}\left( {{\rm 1}{\minus}e^{r \times L}} } \right),$$
where N is the number of deaths, L is the standard life expectancy at age of death (years) and r is the discount rate (e.g. 3% corresponds to a discount rate of 0.03). Similarly, the formula for YLD is:
 $${\rm YLD}=\left( {{\rm I}{\times}{\rm DW}{\times}L{\times}\left( {{\rm 1}{\minus}e^{r {{\times L}} } \right)} \right)/r,$$
where I is the number of incident/prevalence cases, DW is disability weight, L is the duration of disability (years) and r is the discount rate.
Predictor variables
Unplanned urbanization in developing countries like India has led to uneven regional development. It has forced people to live in areas with limited availability of, or accessibility to, basic civic amenities, affecting their health status (Montgomery et al., Reference Montgomery, Gragnolati, Burke and Paredes2000; Baker, Reference Baker2008). With this viewpoint, the present study used region as a predictor variable to analyse the regional variation in the prevalence of self-reported morbidity in Uttar Pradesh. The study adopted the region variable from the NSSO.
Beside this, in the NSSO, information on a number of socioeconomic and demographic covariates that can potentially affect the morbidity and mortality pattern of a population was collected. The variables included as predictors in this study were: age, education, place of residence, sex and monthly per capita expenditure.
Statistical analysis
Multivariate analysis using logistic regression analysis was carried out to estimate the adjusted effects of selected covariates on the prevalence of the self-reported morbidity. Logistic regression was used due to the nature of the outcome variables. The outcome variables are in binary form: No (coded 0) or Yes (coded 1). The model is usually put into a more compact form as follows:
 $${\rm ln}\left( {{{p_{i} } \over {1{\minus}p_{i} }}} \right)=\beta _{0} {\plus}\beta _{{1x_{1} }} {\plus}\,\cdots\,{\plus} \beta _{{Mx_{{m,i}} }} {\plus}{\varepsilon}$$
where β 0 is a constant and β 1… β M are regression coefficients indicating the relative effect of a particular explanatory variable on the outcome. These coefficients change with the analysis context.
Results
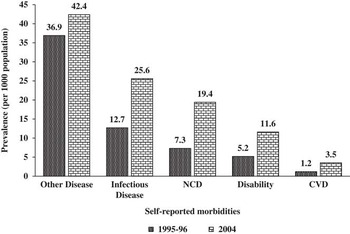
The prevalence of all selected self-reported infectious and non-communicable diseases was found to have increased in Uttar Pradesh over the study period from 1995 to 2004, with most increasing by more than two times. The only exception was the ‘other diseases’ category, which showed little increase in its prevalence, i.e. from 37% in 1995 to 42% in 2004. The maximum increase was observed in the prevalence of non-communicable diseases, which increased to 19% in 2004 from 7% in 1995 (Fig. 1).
Prevalence of different self-reported morbidities in Uttar Pradesh, 1995–2004

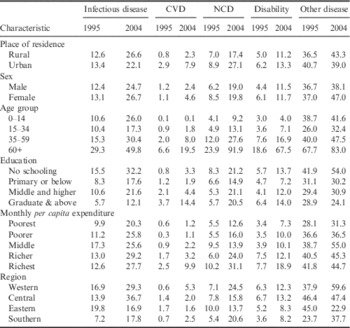
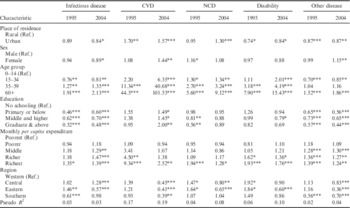
An increase in the prevalence of self-reported morbidities was observed in Uttar Pradesh for all selected covariates over the study period. However, the prevalence was higher among females, those aged 60 and above, among illiterates and affluent households for all diseases. The prevalence of CVDs, NCDs and disability increased across the place of residence, but it was higher in urban areas. The prevalence of infectious and other diseases increased in both rural and urban areas over the study period. Yet, the increase was higher in rural areas, most noticeably in the year 2004. Further, the prevalence of all selected self-reported morbidities increased in all regions over the study period; however, the prevalence of CVDs, NCDs, disability and other diseases was higher in the western region in 2004 (Table 1).
Prevalence of self-reported morbidities by selected characteristics in Uttar Pradesh, 1995–2004

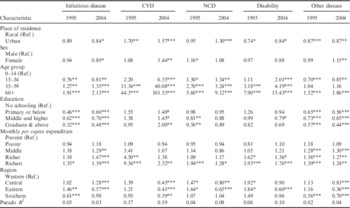
In urban areas, the proportion of infectious diseases, disability and other diseases was lower than in the rural areas. This pattern was observed at both points of time during the study period and was found to be statistically significant. Cardiovascular diseases (OR: 1.57) and NCDs (OR: 1.30) were more prevalent in urban than in rural areas. Females were less likely to have infectious diseases and disability, but more likely to report CVDs, NCDs and other diseases at both points in time during the study period. All the selected self-reported morbidities were positively correlated with age. Those aged 60 and above reported the highest likelihood of having all the selected self-reported morbidities. Yet, the odds ratio of experiencing the selected morbidities for people aged 60 and above increased from 1995 to 2004, and this result was found to be statistically significant. Education and selected morbidities were inversely correlated and statistically significant. The only exception was for CVDs: those who studied up to graduate level and above were more likely (OR: 2.00; p<0.05) to report CVDs than those who were illiterate. Monthly per capita expenditure was positively associated with all the selected morbidities. This pattern was observed at both points in time and found to be statistically significant. In 1995, the southern region was less likely to have infectious and other diseases, and this continued up until 2004. The eastern region was more likely to experience any of the selected morbidities in 1995; however, in 2004, this pattern inverted. In 2004, the eastern region was less likely to experience any of the specified morbidities (Table 2).
Adjusted effects of selected covariates on the prevalence of self-reported morbidities in Uttar Pradesh, 1995–2004
Ref.: reference group.
*p<0.1, **p<0.05; ***p<0.01.
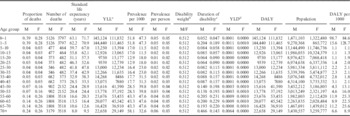
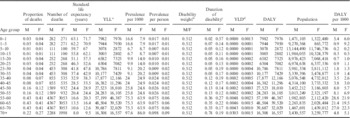
The result for the DALY shows that the burden of infectious diseases was higher during infancy, and noticeably greater among males than females. Yet, females aged 1–5 years were more vulnerable to having infectious diseases than their male counterparts. The age distributions of the DALY indicated that individuals aged below 5 years and above 60 years were more susceptible to infectious diseases. This pattern was observed for both the sexes; however, females at older ages were more at risk of having infectious diseases than their male counterparts. The prevalence of non-communicable diseases increased at the onset of middle age and became more prevalent in old age for both the sexes. Yet, males aged 60 years and above were more at risk of developing non-communicable diseases than their female counterparts (Table 3 and 4).
Burden of infectious diseases by sex in Uttar Pradesh, 2002
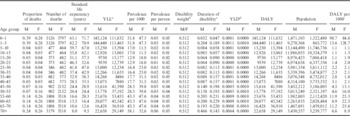
M, male; F, female.
a YLL: years of life lost due to premature mortality.
b Disability weights used in DALY calculations quantify societal preferences for different health states. The weights do not represent the lived experience of any disability or health state, or imply any societal value for the person in a disability or health state. The disability weights are estimated by WHO, and used in the present study for DALY estimation (WHO, 2004).
c Duration of disability=(L(x, n)×prevalence)/l x , where, L=person year lived, x=age, n=interval and l x =person at exact age x. The life table is standardized with Kerala (the state with the highest life expectancy in India; RGI, 2002).
d YLD: years lived with disability.
Burden of non-communicable diseases (NCDs) by sex in Uttar Pradesh, 2002
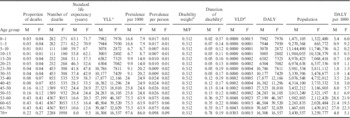
M, male; F, female.
a YLL: years of life lost due to premature mortality.
b Disability weights used in DALY calculations quantify societal preferences for different health states. The weights do not represent the lived experience of any disability or health state, or imply any societal value for the person in a disability or health state. The disability weights are estimated by WHO, and used in the present study for DALY estimation (WHO, 2004).
c Duration of disability=(L(x, n)×prevalence)/l x , where, L=person year lived, x=age, n=interval and l x =person at exact age x. The life table is standardized with Kerala (the state with the highest life expectancy in India; RGI, 2002).
d YLD: years lived with disability.
Discussion
There is a clear indication that the selected self-reported morbidities increased alarmingly from 1995 to 2004 in Uttar Pradesh. While non-communicable diseases increased nearly threefold, all other diseases doubled over the study period. This has also been observed at a national level (Nongkynrih et al., Reference Nongkynrih, Patro and Pandav2004; WHO, 2009; Taylor, Reference Taylor2010). Part of the explanation for this increase could be the timing of the surveys: the 52nd round (in 1995) was conducted throughout the year whereas the 60th round (in 2004) took place in the six months from January to June. The reported prevalence of infectious disease may have been affected by this timing; however, this may not be true for non-communicable diseases. It is believed that reported morbidity, especially for non-communicable diseases, is biased by the perception of the individual reporting, which could be a function of education and household wealth. It has been observed that states that are socioeconomically developed report higher morbidity (Subramanian et al., Reference Subramanian, Subramanyam, Selvaraj and Kawachi2009; Suryanarayana, Reference Suryanarayana2012). For instance, Kerala has the highest levels of literacy (nearly universal for the young) and longevity (a life expectancy of about 74 years), and has the highest rate of self-reported morbidity of all the Indian states (Burström, Reference Burström2012; Prinja et al., Reference Prinja, Jeet and Kumar2012). At the other extreme, Bihar, which has low longevity, and performs poorly in terms of medical and educational facilities, has the lowest rates of reported morbidity. The result of this study is an indication of the fact that one has to be cautious in drawing conclusions from reported morbidity. At the same time, the value of such data should not be ignored.
Females were found to have a higher prevalence of all selected morbidities than males in the present study. Previous studies have found that under-nutrition, over-nutrition, poverty, lack of education, unsafe working conditions, violence and poor health care facilities are often associated with poor health (Andre et al., Reference Andre, Velasquez and Mazur1993; Forastieri, Reference Forastieri1999; Musaiger et al., 2011). Since the gender pattern in a society affects the degree to which women and men are exposed to these risk factors, it also has an effect on their health (WHO, 2003). Like many other studies, this study concluded that the prevalence of self-reported morbidities is considerably higher among the older population (Agrawal & Arokiasamy, Reference Agrawal and Arokiasamy2009; Ghosh & Arokiasamy, Reference Ghosh and Arokiasamy2010). The results of the multivariate analysis suggest that sex, age, place of residence, monthly per capita expenditure, household size, individuals’ education and marital status were significant determinants of infectious, non-communicable and other diseases in the state of Uttar Pradesh. The socioeconomic pattern of diseases shows that the prevalence of infectious diseases, CVDs and other diseases was noticeably higher among females; however, the gender gap was not apparent in non-communicable diseases and disability. In the bivariate analysis, a J-shaped relationship between age and prevalence of selected morbidities was observed. Like many other studies, this study found that the prevalence of non-communicable diseases was higher among the educated, affluent and urbanities. The opposite was observed for infectious diseases (Shah & Mathur, Reference Shah and Mathur2010; Kumar & Kumar, Reference Kumar and Kumar2012).
The results of the regional analysis suggest that the prevalence of infectious diseases was higher in the southern and western regions in 1995–96, but shifted to the central region in 2004. Further, the categorization of self-reported ailments as infectious, NCDs and so on enabled the unanticipated association between better socioeconomic covariates and high prevalence of morbidities to be explained. The high intake of energy-dense food, lack of physical exercise and sedentary lifestyle found in the privileged group has been found to be associated with NCDs (Prentice, Reference Prentice2006; Sinha & Kapoor, Reference Sinha and Kapoor2010).
The result for the DALY showed that the burden of infectious diseases was greater during infancy and noticeably higher among males than females. Yet females aged 1–5 years were more vulnerable to developing infectious diseases compared with corresponding male children. The disadvantaged condition of male children in the early years of life could be because they tend to be biologically weaker in the first year of life than female children (Buvinic et al., Reference Buvinic, Médici, Fernández and Torres2006). However, the inverse condition in the age group 1–5 years may be a reflection of sex discrimination against female children, which is common in northern India (Diamond-Smith & Bishai, Reference Diamond-Smith and Bishai2014). The burden of non-communicable diseases was greater in the older members of the population, with females aged 65–70 being more vulnerable. Given the higher life expectancy of females, they are more likely to experience chronic non-communicable diseases and disabilities.
In conclusion, Uttar Pradesh exhibits disadvantaged socioeconomic characteristics and high rates of newborn, infant and maternal deaths. With a population of 200 million, the state is challenged to meet the health care needs of its population. The problem of infant and maternal deaths from preventable infectious diseases is still a major public health issue in the state. The growing concern about chronic non-communicable diseases, which are prevalent among the older and the better-off, will put additional pressure on Uttar Pradesh’s health system. The state has to grapple with preventable infectious diseases on the one hand, and a growing prevalence of non-communicable diseases on the other. Females are in need of special attention since they are more prone to developing chronic non-communicable diseases and their health is not perceived as being as important as that of men in the context of the northern region of India.