





Low socioeconomic status (SES; a measure including income, education, social class) reflects an individual’s quality-of-life and opportunities, and is a known correlate (McLaughlin et al., Reference McLaughlin, Costello, Leblanc, Sampson and Kessler2012; Peverill et al., Reference Peverill, Dirks, Narvaja, Herts, Comer and McLaughlin2021) as well as a longitudinal predictor of psychopathology in adolescence and general health problems into adulthood (Ferraro et al., Reference Ferraro, Schafer and Wilkinson2016; Santiago et al., Reference Santiago, Wadsworth and Stump2011). Likewise, growing up in a disadvantaged neighborhood (i.e., areas with high crime rates, elevated poverty rates, few employment opportunities) is also a prospective risk factor for psychopathology, including depression (Elovainio et al., Reference Elovainio, Vahtera, Pentti, Hakulinen, Pulkki-Råback, Lipsanen, Virtanen, Keltikangas-Järvinen, Kivimäki, Kähönen, Viikari, Lehtimäki and Raitakari2020). In fact, one’s neighborhood environment predicts unique variance in psychopathology above-and-beyond individual-level SES (Barch, Reference Barch2022; Galea et al., Reference Galea, Ahern, Nandi, Tracy, Beard and Vlahov2007; Gonzalez et al., Reference Gonzalez, Allen and Coan2016; Xue et al., Reference Xue, Leventhal, Brooks-Gunn and Earls2005). Yet not all adolescents who grow up in a low SES environment will develop mental illness. Thus, it is imperative to identify factors which could impact why some youth living in low SES neighborhoods develop mental illness, while others do not. Recent studies have suggested individual differences in affective processing may moderate the relationship between the SES environment and psychopathology. For example, neighborhood SES interacted with blunted neural responses to rewards to predict attention problems (Mullins et al., Reference Mullins, Campbell and Hogeveen2020), and both family and neighborhood SES interacted with blunted neural responses to rewards to predict depression course (Roberts et al., Reference Roberts, Feurer, Petryczenko, Granros and Burkhouse2025). The primary goal of the present study is to determine whether another affective processing factor – neural processing of social feedback from peers – moderates the relationship between SES and an individual’s affect.
Having fulfilling peer relationships during adolescence robustly predicts long-term mental health and functioning (Adedeji et al., Reference Adedeji, Otto, Kaman, Reiss, Devine and Ravens-Sieberer2022; Landstedt et al., Reference Landstedt, Hammarström and Winefield2015). However, youth living in low SES neighborhoods are exposed to a myriad of stressful social factors, such as discrimination and stigma from others (Cozzarelli et al., Reference Cozzarelli, Wilkinson and Tagler2001; Moura et al., Reference Moura, de Almeida Segundo, Barbosa, Ximenes, Moura, Cidade and Nepomuceno2019) – experiences which may be particularly stressful for adolescents sensitive to peer feedback. At the same time, studies have suggested that aspects of the neighborhood community, such as social cohesion, fragmentation, or collective efficacy can buffer against social stressors (Choi et al., Reference Choi, Teshome and Smith2021). Unfortunately, adolescents who are insensitive to signals that they are accepted by their peers may not benefit from these potential buffers to stressors in their environment. That is, individuals from low SES neighborhoods who are also insensitive to positive peer feedback may be particularly at risk for poor mental health outcomes.
Although individual differences in sensitivity to peer feedback can be measured via self-report, a more sensitive and objective measure is brain responses to feedback, more specifically, event-related potentials (ERPs). ERPs are fluctuations in EEG signals that are time-locked to the presentation of events such as accepting relative to rejecting feedback. Unlike other neural measures (e.g., fMRI), ERPs have high temporal resolution (on the order of milliseconds) making them ideal for differentiating neuropsychological responses to peer feedback. For example, the P2 is an ERP that occurs around 180 ms post feedback and is thought to reflect neural activity to post-perceptual selective attention (Hajcak et al., Reference Hajcak, Weinberg, MacNamara and Foti2012; Luck & Hillyard, Reference Luck and Hillyard1994), and is sensitive to affective evaluations (Begleiter et al., Reference Begleiter, Porjesz, Garozzo and Begleiter1979; Hajcak et al., Reference Hajcak, Weinberg, MacNamara and Foti2012). A second ERP is the P3, which occurs slightly later (around 300–400 ms post feedback) and indexes the salience of acceptance feedback, that is, the degree to which participants find peer acceptance salient or important (Funkhouser et al., Reference Funkhouser, Auerbach, Kujawa, Morelli, Phan and Shankman2020; Pegg et al., Reference Pegg, Lytle, Arfer and Kujawa2022). The P2 and P3 can therefore be used to index individual differences in separate brain responses to social feedback (Brown & Cavanagh, Reference Brown and Cavanagh2020).
Studies of mental health in youth often use retrospective self-reported depression symptoms as a primary outcome (e.g., Kim et al., Reference Kim, Wallander, Peskin, Cuccaro, Elliott and Schuster2018; Quon & McGrath, Reference Quon and McGrath2014). An alternative approach is to use ecological momentary assessment (EMA) to probe in-the-moment experiences of affect. When averaged across time, EMA of affect is (a) more reliable, (b) more ecologically valid, and (c) less susceptible to retrospective bias (Scollon et al., Reference Scollon, Kim-Prieto and Diener2003) than self-reported symptoms. Therefore, the primary goal of the study is to test whether neural processing of social feedback from peers moderates the relationship between neighborhood SES and an individual’s EMA-assessed positive and negative rated over one week.
A secondary goal of this study is to test whether neighborhoods themselves may be related to individual differences in brain responses to peer feedback. Numerous studies have examined associations between family SES (Decker et al., Reference Decker, Meisler, Hubbard, Bauer, Leonard, Grotzinger, Giebler, Torres, Imhof, Romeo and Gabrieli2024; White et al., Reference White, Nusslock and Miller2022; Yaple & Yu, Reference Yaple and Yu2020) or neighborhood SES (Gonzalez et al., Reference Gonzalez, Allen and Coan2016; Jorgensen et al., Reference Jorgensen, Muscatell, McCormick, Prinstein, Lindquist and Telzer2023) and monetary and social reward/threat, and have yielded mixed results. However, the only study examining neural response to social feedback more specifically showed that SES relates to blunted responses to positive social feedback (Rappaport et al., Reference Rappaport, Kujawa, Arfer, Pegg, Kelly, Jackson, Luby and Barch2024). The present study sought to replicate this effect.
In sum, the current study tests whether brain responses to peer feedback moderate associations between neighborhood disadvantage and outside-the-lab positive and negative affect. Specifically, we hypothesize that those with both low neighborhood SES and blunted neural response to acceptance would be particularly likely to report elevated negative affect and blunted positive affect outside of the lab. Additional analyses will also examine whether neighborhood SES is associated with brain responses to peer feedback. We hypothesize that, as in Rappaport et al. (Reference Rappaport, Kujawa, Arfer, Pegg, Kelly, Jackson, Luby and Barch2024), low neighborhood SES would be associated with more blunted neural response to acceptance.
Finally, a large body of research shows that stressful life events increase risk for depression (Kendler et al., Reference Kendler, Karkowski and Prescott1999). We aimed to determine the extent to which neighborhood SES contributes unique information above-and-beyond stressful life events. Therefore, follow-up analyses covary for general stressful life events. Similarly, depression is related to blunted positive and heightened negative affect (Naragon-Gainey, Reference Naragon-Gainey2019; Shankman & Klein, Reference Shankman and Klein2003). Therefore, we also aimed to determine the extent to which interactions between neighborhood SES and brain responses to feedback predict unique variance in daily affect, above-and-beyond that predicted by an adolescent’s depression and anxiety severity.
Methods and materials
Participants
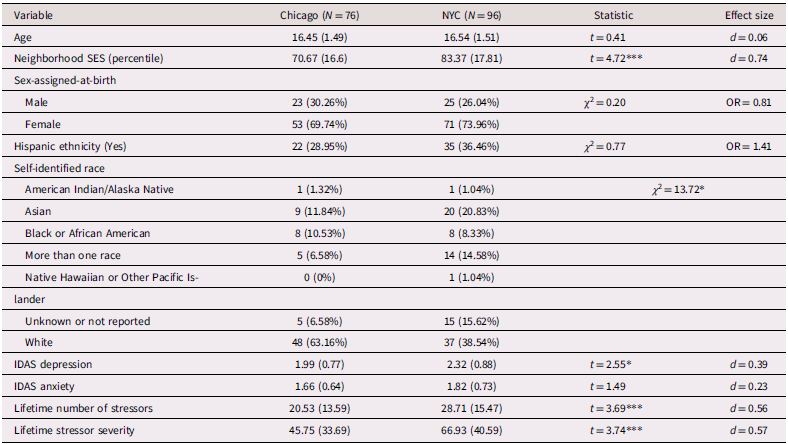
Participants (N = 172) were from a larger project examining adolescent depression. Adolescents, ages 13–18-years-old, were recruited from community and mental health clinics in New York, NY and Chicago, IL. All study procedures were conducted in accordance with the Declaration of Helsinki and approved by the New York State Psychiatric Institute and Northwestern University Institutional Review Boards. Table 1 summarizes participant demographic and clinical characteristics. Informed assent and consent were obtained from the adolescent and parent, respectively, and adolescents 18 years-old provided consent. See Supplement for general inclusion criteria. As the parent study is interested in adolescent depression, the sample is enriched for depression, which increases potential variability in affect and thus, our ability to detect associations with positive and negative affect. Specifically, recruitment emphasized oversampling adolescents with current and remitted depression to achieve a sample with rates of depression higher than would typically be found in the community. This increased potential variability in affect in the present study and thus, our ability to detect associations with positive and negative affect. Of the 172, 160 participants had clean, usable data (i.e., enough artifact free trials, see Reliability of ERPs) for the P2, and 151 for the P3.
Demographics of samples and descriptive statistics of measures of interest and covariates

Table 1. Long description
A table with 17 rows and 5 columns comparing demographic and clinical characteristics of participants from Chicago and NYC. The columns are labeled Variable, Chicago, NYC, Statistic, and Effect size. The table includes data on age, neighborhood SES percentile, sex-assigned-at-birth, Hispanic ethnicity, self-identified race, IDAS depression, IDAS anxiety, lifetime number of stressors, and lifetime stressor severity. Each row provides specific values for these variables in both Chicago and NYC, along with corresponding statistics and effect sizes. Notable trends include differences in neighborhood SES percentile, lifetime number of stressors, and lifetime stressor severity between the two locations.
Note. N (%) or mean (standard deviation) presented. N = 7 missing Neighborhood SES (percentile). *p < .05, ***p < .001, NYC = New York, NY. Neighborhood SES refers to reverse scored area deprivation index percentile, such that scores closer to 100 indicate higher SES, and scores closer to 1 indicate lower SES.
Procedure
Participants completed an EEG task designed to probe neural response to social feedback, 7-days of EMA, and self-report questionnaires of the current depression and anxiety symptoms, as well as lifetime experience of stressful life events.
Brain response to acceptance: social feedback EEG task
Brain activity to social feedback was measured using a variant of the Chatroom Task (Guyer et al., Reference Guyer, Lau, McClure-Tone, Parrish, Shiffrin, Reynolds, Chen, Blair, Leibenluft, Fox, Ernst, Pine and Nelson2008, Reference Guyer, McClure-Tone, Shiffrin, Pine and Nelson2009). First, participants were told they were participating in a multi-site study on adolescent interactions online. Participants created profiles (e.g., hobbies, favorite food, etc.) and were told that other participants would review their profile and indicate interest (acceptance) or not (rejection) in chatting with them. Next, participants viewed photographs of 50 male and 50 female peers and selected 50 that they were “interested” (high value) and 50 they were “not interested” (low value) in chatting with online following the next visit. On the second visit (∼1 week later), participants were presented with whether each of the peers were interested in chatting with them or not – while EEG data were recorded. See Figure 1a for details on trial structure. After each trial, participants rated their emotional response (0–100, “very bad” to “very good”). Trials were pseudo-randomized with no more than two sequential acceptances/rejections. Participants received 50 acceptance and 50 rejection trials – split by participant interest in the peer. After the task, participants’ belief in the task was assessed and they were debriefed. The task therefore has four within-subject conditions, each with 25 trials: (1) acceptance from high-value peers (peers participants were interested in talking to), (2) rejection from high-value peers, (3) acceptance from low-value peers (peers participants were not interested in talking to), and (4) rejection from low-value peers.
(a) Example of trial from chatroom task. (b) Grand average ERP for acceptance and rejection feedback from high-value peers and topographic maps. Gray sections of the graph represent time windows where ERP components were extracted at Cz electrode for the P2 (top) and Pz electrode for the P3 (bottom). Shaded region around lines indicates 95% confidence interval. Topographic maps illustrate topography of mean amplitude to acceptance minus rejection from highlighted time windows.

EEG recording and processing
Continuous EEG data were recorded during the Chatroom task using the 32-channel ActiCHamp (Brain Products, Munich, Germany). See Supplement for details on EEG recording and processing.
Feedback-locked ERPs were averaged separately for each combination of peer value (high, low) and feedback type (acceptance, rejection). Grand averages were inspected to determine time windows to be extracted at the individual-level (Figure 1b). Time windows were chosen based on those windows which showed substantial difference between conditions. Because this is the first application of the Chatroom task to ERP data, we used the approach recommended by Kappenman and Luck (Reference Kappenman and Luck2016). They recommend examining the grand-grand average; that is, the difference between acceptance and rejection regardless of neighborhood SES. That said, results using an a priori time window for the P3 (330–430 ms; Funkhouser et al., Reference Funkhouser, Auerbach, Kujawa, Morelli, Phan and Shankman2020; Pegg et al., Reference Pegg, Lytle, Arfer and Kujawa2022; Rappaport et al., Reference Rappaport, Kujawa, Arfer, Pegg, Kelly, Jackson, Luby and Barch2024; Weinberg et al., Reference Weinberg, Ethridge, Pegg, Freeman, Kujawa and Dirks2021) are presented in the Supplement. For the P2 and P3, time windows of 150–275 ms and 275–425 ms were used, respectively. For the P2, mean amplitude of the difference between acceptance and rejection was maximal at Cz. For the P3, topographic maps of the difference between conditions did not show a clear maximal electrode in the time window. Therefore, the maximal electrode for the P3 (Pz) was based on prior literature (Funkhouser et al., Reference Funkhouser, Auerbach, Kujawa, Morelli, Phan and Shankman2020).
Reliability of ERPs
The P2 and P3 demonstrated acceptable levels of internal consistency across peer-value (high, low) and feedback conditions (acceptance, rejection), with split-half reliability (r) > .68, with particularly high reliability for the high-value peers conditions (acceptance r = .81 and .75, and rejection r = .83 and .70, for P2 and P3, respectively). Split-half reliability was considerably lower for the residualized scores, but remained comparable to other studies (P2resid r > .22, P3resid r > .34, Ethridge & Weinberg, Reference Ethridge and Weinberg2018; Levinson et al., Reference Levinson, Speed, Infantolino and Hajcak2017; Rappaport et al., Reference Rappaport, Kujawa, Arfer, Pegg, Kelly, Jackson, Luby and Barch2024).
In dependability analyses (another form of reliability), the P2 and P3 achieved acceptable dependability (≥0.70) with as few as 12–13 and 13–15 trials, respectively, depending on the peer-value and feedback condition. When using all available trials, up to 25 trials per condition, P2 and P3 achieved good dependability (≥0.80). Based on these dependability analyses 12 subjects were excluded for having too few clean trials for the P2 and 21 subjects for the P3 following artifact rejection. This resulted in different final samples sizes per component: P2 (n = 160) and P3 (n = 151). See Supplement for table of full results of dependability analyses.
Ecological momentary assessment (EMA)
Ecological momentary assessment data were collected using the Effortless Assessment of Risk States (EARS) app (Lind et al., Reference Lind, Byrne, Wicks, Smidt and Allen2018, Reference Lind, Kahn, Crowley, Reed, Wicks and Allen2023) for 7 days after consenting. Participants received three notifications each day (6:30 am–8:30 am, 3:00 pm–5:00 pm, 7:00 pm–10:00 pm) to rate their positive and negative affect items on a scale from 0–100 (not at all to extremely). Composite positive affect (PA) and negative affect (NA) was calculated for each time participants completed a survey. On average, participants completed 14 total assessments of PA (mean PA = 50 ± 21) and 13 total assessments of NA (mean NA = 20 ± 15). Both measures demonstrated moderate test–retest reliability (ICCPA = 0.57, ICCNA = 0.54) suggesting that they reliably detected individual differences in PA and NA, as well as within-person change in PA and NA. Nineteen participants were excluded from these analyses for having made too few EMA responses (<4, Thompson et al., Reference Thompson, Bailen and English2021). See Supplement for further details.
Measures
Neighborhood SES: area deprivation index (ADI)
The area deprivation index (2021 version 4.0.1, Kind & Buckingham, Reference Kind and Buckingham2018; University of Wisconsin School of Medicine and Public Health, 2023) is a composite measure of 17 dimensions of socioeconomic disadvantage for an individual’s neighborhood including education, employment, housing quality, and poverty-related factors, all measured via the American Community Survey. Neighborhoods are determined based on block groups and are assigned a percentile from 1 to 100, where a higher percentile indicates greater levels of neighborhood disadvantage. ADI percentile was reverse scored so that higher scores represented greater neighborhood SES. See Supplement for further details.
Covariates
Depression and anxiety symptoms
To assess whether the examined relationships persist over-and-above depression and anxiety symptoms, we also included depression and anxiety symptoms as covariates. The expanded Inventory of Depression and Anxiety Symptoms (IDAS-II, Watson et al., Reference Watson, O’Hara, Naragon-Gainey, Koffel, Chmielewski, Kotov, Stasik and Ruggero2012) is a 99-item, self-report instrument that measures the severity of depression, anxiety, and bipolar disorder symptoms over the past two weeks. Items are scored on a 5-point scale (1 = not at all; 5 = extremely). For the present study, 52-items were selected to assess current depression and anxiety symptoms. The general depression (Cronbach’s α = 0.95) and anxiety (a combination of the panic and social anxiety subscales; Cronbach’s α = 0.90) demonstrated excellent internal consistency. Mean levels in the sample suggest that youth across both sites were experiencing moderate levels of depression (58th percentile compared to national norms) and anxiety (76th percentile on social anxiety scale and 71st percentile on panic scale, Nelson et al., Reference Nelson, O’Hara and Watson2018).
Stressful life events
To assess whether the examined relationships persist over-and-above those with lifetime experienced stressful life events, we also included the frequency and severity of stress life events as covariates. The Stress and Adversity Inventory for Adolescents (STRAIN, Slavich et al., Reference Slavich, Stewart, Esposito, Shields and Auerbach2019) was used to measure participants’ exposure to stressors over their lifetime. This interview assesses exposures to 75 different stressors across 12 primary life domains (e.g., education, parent/guardian, death, life-threatening situations) and five social–psychological characteristics (e.g., interpersonal loss, physical danger, humiliation). If a participant endorsed a stressor, they rated its severity, frequency, timing, and duration. We used two summary scores: (1) total lifetime stressor count and (2) severity for all acute life events and chronic difficulties, with higher scores indicating more frequent stress exposure and greater severity. Prior studies support the psychometric properties of the STRAIN, including excellent test–retest reliability (r = .90–.95, Cazassa et al., Reference Cazassa, Oliveira, Spahr, Shields and Slavich2020; Slavich & Shields, Reference Slavich and Shields2018). Given the format of the STRAIN, which requires participants to endorse whether a stressor occurred to report its severity, Cronbach’s α could not be measured.
Data analysis
In-task emotional response ratings
Omnibus ANOVAs tested whether in-task emotion ratings varied as a function of Peer value (high/low) and Feedback type (acceptance/rejection); there was too little between-subject variance to use MLMs to model random intercept. Post-hoc paired samples t-tests compared levels of Peer value and Feedback type. Multiple regression models (MLMs) tested whether behavioral ratings were associated with neighborhood SES.
ERP task effects
Omnibus MLMs included random intercept effects of participants and tested whether mean ERP amplitude varied as a function of Peer value (high/low) and Feedback type (acceptance/rejection). See Supplement for these results.
Multilevel multiple regression models (MLMs)
Neighborhood SES moderating association between ERP and EMA measures of affect
Multilevel MLMs tested whether neighborhood SES moderated associations between ERP amplitudes and EMA ratings of negative/positive affect. Models included random intercept effects of subject and fixed effect of study site. Given a positive skew and large number of zeros in negative affect, negative affect was cube-root transformed and zero-inflated Gaussian multilevel models were used. All predictors were included in both conditional and zero-inflation portions of the model. Similar models were used to assess whether neighborhood SES moderated associations between in-task emotional response ratings and EMA-rated affect. All models covaried for site and demographic factors (age, sex-assigned-at-birth). To test for specificity of effects for neighborhood SES, analyses also covaried for lifetime stressors (number and severity of stressful life events) and depression and anxiety symptoms where noted. Nominal p values presented, with corrected p values noted given that association with neighborhood SES is examined across two ERP components. Day was included in the model to account for linear time trends.
Finally, to assure that SES effects are not conflated by race/ethnicity differences, we tested whether findings were similar when neighborhood SES was replaced with race (White, Black or African American, Asian, More than one race) or Hispanic ethnicity. Racial identities of American Indian/Alaska Native or Native Hawaiian or Other Pacific Islander were not included due to small sample size (n = 3 total). Of note, neighborhood SES was significantly lower in Black or African American participants than White (t(135) = 3.47, p FDR(6) = .004), Asian (t(135) = 2.64, p FDR(6) = .028), and multiracial participants (t(135) =2.43, p FDR(6) = .033). Neighborhood SES was also significantly lower in Hispanic than non-Hispanic participants (t(160) = 3.30, p = .001).
Neighborhood SES related to ERP residualized scores
To compute residualized scores to acceptance, we calculated the unstandardized residuals of brain activity to acceptance, accounting for brain activity to rejection. For aim 1, MLMs tested whether neighborhood SES was associated with residualized scores to acceptance for each component (P2resid, P3resid). Nominal p values presented, with corrected p values noted given that association with neighborhood SES is examined across two ERP components.
Results
In-task emotional response ratings
Omnibus ANOVAs showed a significant Peer value × Feedback type interaction (F(1,667) = 427.48, p < .001) as participants rated acceptance from high-value peers (i.e., peers that they were interested in) as feeling significantly better than rejection from high-value peers (Cohen’s D = 1.51, Acceptance mean = 68.93 ± 10.58), Rejection mean = 41.98 ± 10.85), t(168.00) = 19.63, 95% CI [24.24,29.66], p < .001), and participants rated feeling worse in response to acceptance than rejection from low-value peers (Cohen’s D = .49, Acceptance mean = 44.73 ± 13.92), Rejection mean = 54.36 ± 10.15), t(168.00) = −6.36, 95% CI [−12.62,−6.64], p < .001). This counter-intuitive behavioral finding for low-value peers calls into question how participants perceived low-value acceptance and rejection. However, this result is not completely unexpected: previous work suggests that this likely reflects participants feeling good that they were “right” – that is, that they rejected the person who rejected them – and feeling bad (e.g., guilty, sad about “missing out”) when they were “wrong” – that is, rejected someone who accepted them (Quarmley et al., Reference Quarmley, Nelson, Clarkson, White and Jarcho2019). We were concerned that it would be difficult to interpret responses to low-value peers, since they may conflate multiple psychological processes. Therefore, further analyses were conducted only for feedback from high-value peers.
Neighborhood SES did not moderate the association between in-task emotional ratings to feedback (i.e., acceptance ratings residualized for rejection ratings) and EMA positive or negative affect (Acceptance ratingresid: p’s > .45). In-task emotional ratings to feedback were also not significantly associated with neighborhood SES (β = −0.12, 95% CI [−0.28,0.04], p = .14).
Brain responses to peer feedback and neighborhood SES
Neighborhood SES moderation of association between P2resid/P3resid and affect
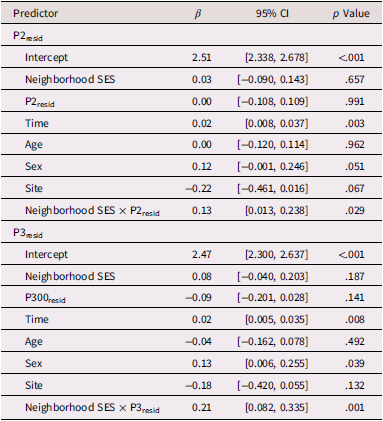
Neighborhood SES significantly moderated the relationship between P2resid and P3resid to acceptance relative to rejection (from high-value peers) and EMA-assessed negative affect (Table 3, Figure 3), over-and-above site and demographic factors. Follow-up simple slope analyses showed that no simple slopes were significant for the neighborhood SES × P2resid interaction (p’s > .11). By contrast, there were significant simple slopes for the neighborhood SES × P3resid interaction, as lower neighborhood SES was associated with a more negative relationship between P3resid to acceptance relative to rejection and subsequent negative affect (β = −0.32, p = .001). That is, individuals from lower SES neighborhoods who had blunted sensitivity to acceptance exhibited greater negative affect. Results were similar when excluding those who reported not being deceived (see Supplement). As a test of specificity, we added lifetime stressors and symptoms of depression and anxiety as covariates; the moderation and simple slope (β = −0.16, p = .038) was still significant when these variables were included (see Supplement). Race did not interact with P2resid nor P3resid to predict negative affect, nor did Hispanic ethnicity interact with P2resid; however, Hispanic ethnicity significantly interacted with P3resid to predict negative affect (see Supplement).
Interactions for which SES significantly moderated association between brain responses to acceptance and negative affect. Orange lines = −1 standard deviation below the mean SES; Blue lines = +1 standard deviation above the mean. SES × P2resid interaction: β = 0.126, 95% CI = [0.013,0.238], p = .029; no simple slopes significant. SES × P3resid to acceptance: β = 0.209, 95% CI = [0.082, 0.335], p = .001; simple slope significant for SES −1 SD.
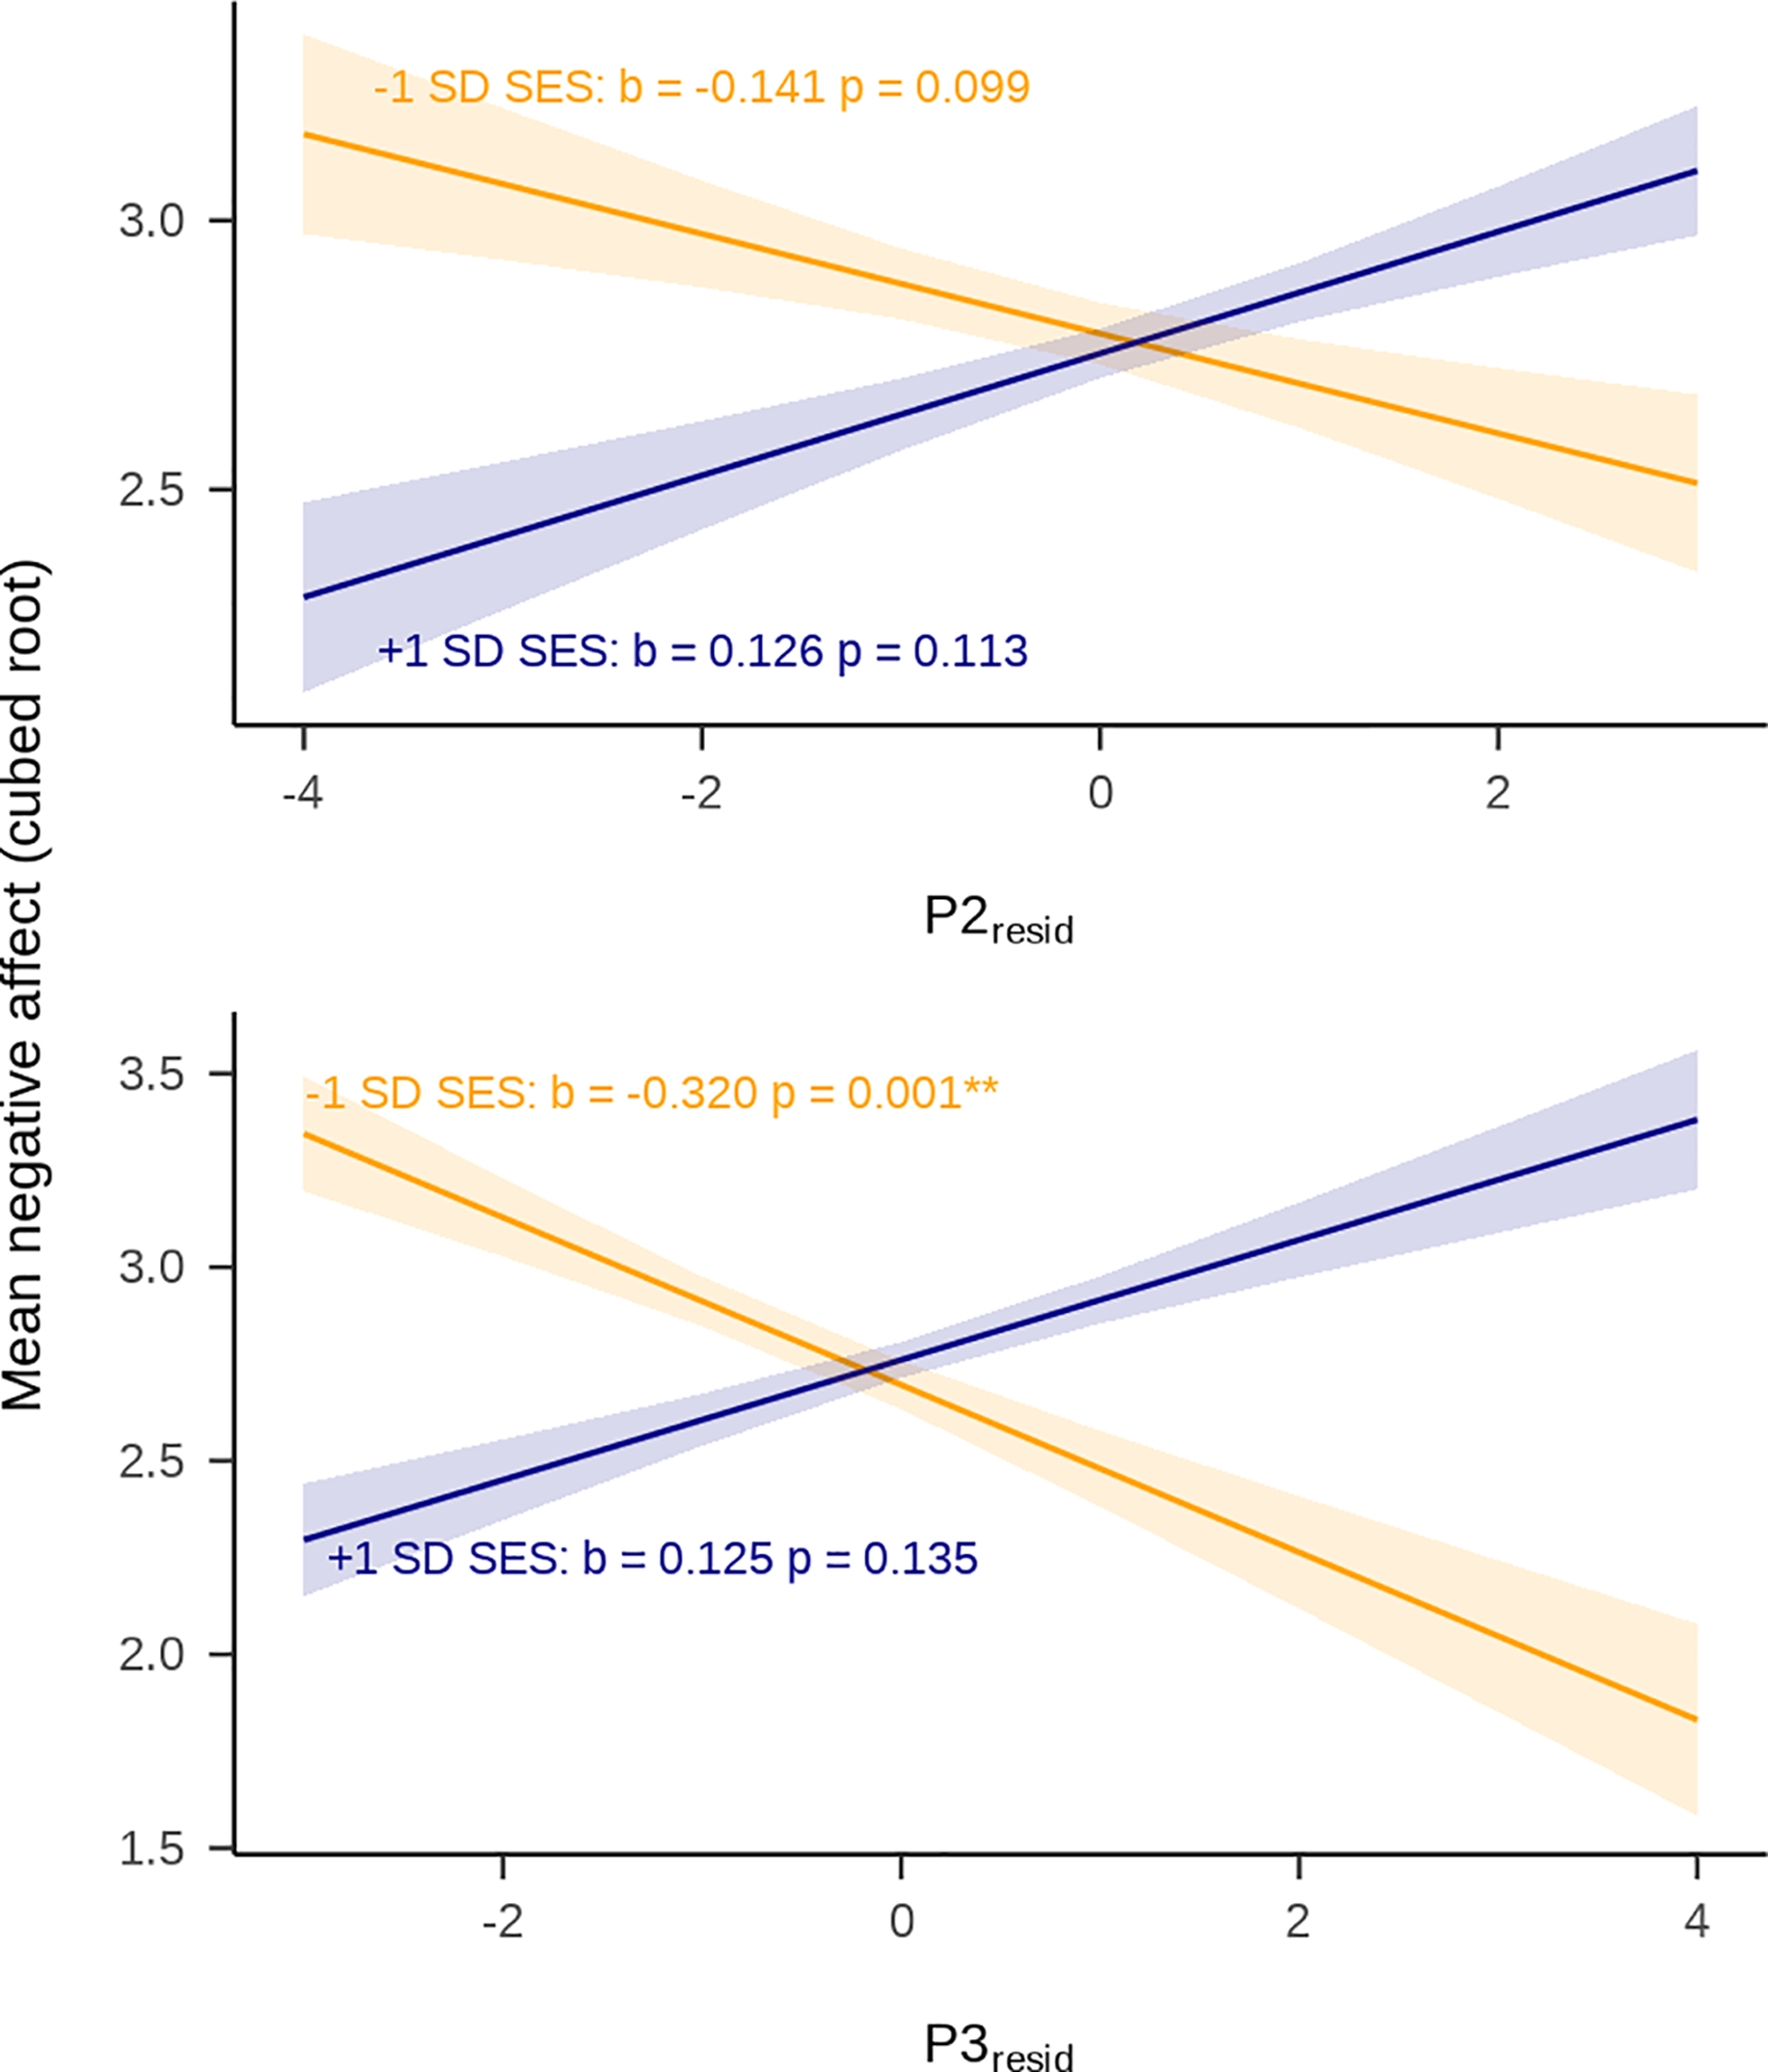
Figure 2. Long description
Two line graphs illustrate the interaction between socioeconomic status (SES) and neural processing of social feedback from peers on negative affect. Panel A: The line graph shows the relationship between P2resid and mean negative affect (cubed root). The x-axis represents P2resid values ranging from -4 to 4, and the y-axis represents mean negative affect values ranging from 2.5 to 3.0. Two lines are plotted: an orange line representing -1 standard deviation below the mean SES and a blue line representing +1 standard deviation above the mean SES. The orange line has a slope of -0.141 with a p-value of 0.099, while the blue line has a slope of 0.126 with a p-value of 0.113. Panel B: The line graph shows the relationship between P300resid and mean negative affect (cubed root). The x-axis represents P300resid values ranging from -2 to 4, and the y-axis represents mean negative affect values ranging from 1.5 to 3.5. Two lines are plotted: an orange line representing -1 standard deviation below the mean SES and a blue line representing +1 standard deviation above the mean SES. The orange line has a slope of -0.320 with a p-value of 0.001, while the blue line has a slope of 0.125 with a p-value of 0.135.
Relationship between SES and brain responses to acceptance (relative to rejection) for P2resid and P3resid ERP components.

Fixed conditional effects from MLM models predicting EMA reported negative affect
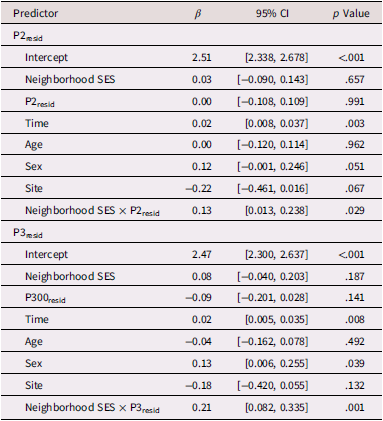
Table 2. Long description
A table showing the fixed conditional effects from MLM models predicting EMA reported negative affect. The table has 14 rows and 4 columns. The columns are labeled Predictor, Beta, 95 percent CI, and p Value. The rows are labeled with different predictors and their corresponding values. Row 1: Intercept, 2.51, [2.338, 2.678], <.001. Row 2: Neighborhood SES, 0.03, [-0.090, 0.143], .657. Row 3: P2resid, 0.00, [-0.108, 0.109], .991. Row 4: Time, 0.02, [0.008, 0.037], .003. Row 5: Age, 0.00, [-0.120, 0.114], .962. Row 6: Sex, 0.12, [-0.001, 0.246], .051. Row 7: Site, -0.22, [-0.461, 0.016], .067. Row 8: Neighborhood SES x P2resid, 0.13, [0.013, 0.238], .029. Row 9: Intercept, 2.47, [2.300, 2.637], <.001. Row 10: Neighborhood SES, 0.08, [-0.040, 0.203], .187. Row 11: P300resid, -0.09, [-0.201, 0.028], .141. Row 12: Time, 0.02, [0.005, 0.035], .008. Row 13: Age, -0.04, [-0.162, 0.078], .492. Row 14: Sex, 0.13, [0.006, 0.255], .039. Row 15: Site, -0.18, [-0.420, 0.055], .132. Row 16: Neighborhood SES x P300resid, 0.21, [0.082, 0.335], .001.
Note. When corrected for multiple comparisons, neighborhood SES interacts with P2resid and P3resid to significantly predict negative affect at pfdr corrected < 0.03.
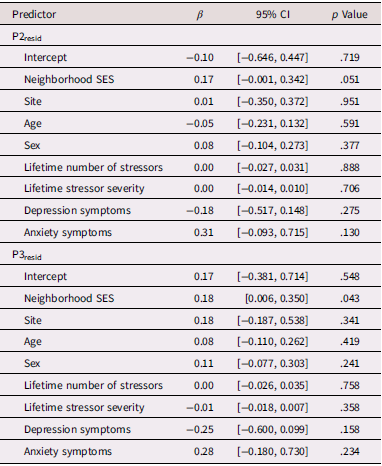
Neighborhood SES associations with P2resid and P300resid
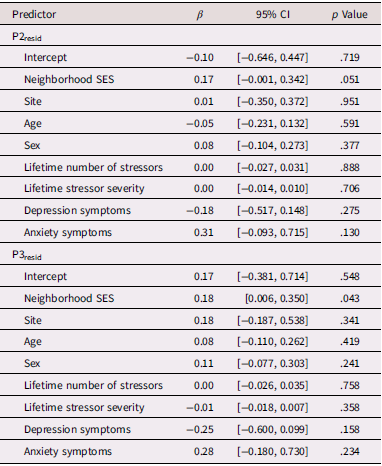
Table 3. Long description
A table with 16 rows and 4 columns. The columns are labeled Predictor, Beta, 95 percent CI, and p Value. The table is divided into two sections: P2resid and P300resid. Each section includes rows for Intercept, Neighborhood SES, Site, Age, Sex, Lifetime number of stressors, Lifetime stressor severity, Depression symptoms, and Anxiety symptoms. The values in the Beta, 95 percent CI, and p Value columns vary for each predictor. Notable trends include significant p values for Neighborhood SES in the P300resid section and non-significant p values for most other predictors.
Note. Nominal p-values reported. When corrected for multiple comparisons, neighborhood SES significantly associated with P2resid and P300resid at pfdr corrected = 0.05.
Positive affect
Neighborhood SES did not moderate the relationship between P2resid to acceptance (from high-value peers) and EMA-assessed positive affect (β = −0.08, 95% CI = [−3.19, 3.03], p = .96), nor between P3resid to acceptance (from high-value peers) and positive affect (β = −3.06, 95% CI = [−6.76, 0.64], p = .11).
Neighborhood SES associations with P2resid and P3resid
Lower neighborhood SES was significantly related to a more blunted P2resid and P3resid to acceptance (from high-value peers; see Table 2 and Figure 2) over-and-above site, demographic factors (e.g., age, sex-assigned-at-birth), lifetime stressors (number of stressful life events, severity of stressful life events), and symptoms of depression and anxiety. Results are consistent when excluding those who reported that they were not deceivedFootnote 1 ; neither race nor Hispanic ethnicity were significantly associated with P2resid or P3resid (see Supplement).
Discussion
The current study found important relationships between neighborhood SES, neural response to social feedback, and daily negative affect: our hypothesis was supported that neighborhood SES moderated the association between neural response to acceptance feedback and negative affect assessed outside of the lab. Follow-up analyses indicated that lower neighborhood SES adolescents who had a more blunted neural response to acceptance (as indicated by a smaller P3resid) reported greater daily experiences of negative affect. Importantly, our specificity analyses indicated that effects were not due to lifetime stressful life events nor symptoms of depression or anxiety, highlighting the particular importance of neighborhood SES. Additionally, our hypothesis that neighborhood SES would relate to neural response to acceptance feedback was also supported, reproducing a prior finding (Rappaport et al., Reference Rappaport, Kujawa, Arfer, Pegg, Kelly, Jackson, Luby and Barch2024).
Relationship between neighborhood SES and negative affect
The present study provides novel evidence of one potential mechanism for why adolescents from low SES neighborhoods may be at heightened risk for internalizing psychopathology: through a blunted response to positive feedback. There are several potential pathways for this mechanism. One possibility is that low SES environments lead to greater negative affect (Gallo & Matthews, Reference Gallo and Matthews2003), which in turn leads to blunted sensitivity to acceptance. A second possibility is that growing up in a low SES environment may make adolescents less sensitive to positive social feedback, relative to their peers. This interpersonal insensitivity may then lead to greater daily negative affect, and chronic negative affect experiences is a robust risk factor for internalizing psychopathology (Mineka et al., Reference Mineka, Watson and Clark1998). Longitudinal studies have consistently shown that low SES prospectively predicts changes in the way youth report on their relationships (Simons & Burt, Reference Simons and Burt2011; Simons et al., Reference Simons, Simons, Lei and Landor2012), and that blunted sensitivity to acceptance is related to depression (Beer et al., Reference Beer, Smith, Jarcho, Chen, Reynolds, Pine and Nelson2016; Eisenberger et al., Reference Eisenberger, Inagaki, Rameson, Mashal and Irwin2009; Groschwitz et al., Reference Groschwitz, Plener, Groen, Bonenberger and Abler2016; Guyer et al., Reference Guyer, Benson, Choate, Bar-Haim, Perez-Edgar, Jarcho, Pine, Ernst, Fox and Nelson2014; Jankowski et al., Reference Jankowski, Batres, Scott, Smyda, Pfeifer and Quevedo2018; Kujawa et al., Reference Kujawa, Kessel, Carroll, Arfer and Klein2017; Kumar et al., Reference Kumar, Waiter, Dubois, Milders, Reid and Steele2017; Rappaport & Barch, Reference Rappaport and Barch2020; Zhang et al., Reference Zhang, Li, Wang, Zhou, Dong, Zhang, Xie, Mu, Li, Zhu and Yu2017) and generally more negative affect (Tan et al., Reference Tan, Lee, Dahl, Nelson, Stroud, Siegle, Morgan and Silk2014, but see Pegg et al., Reference Pegg, Ethridge, Shields, Slavich, Weinberg and Kujawa2019 and Rappaport et al., Reference Rappaport, Kujawa, Arfer, Pegg, Kelly, Jackson, Luby and Barch2024). However, as the present study is cross-sectional, we cannot determine the temporal direction between neighborhood SES, brain activity to peer feedback, and daily negative affect, future longitudinal studies are needed to test this and alternative pathways from SES to psychopathology.
These findings however are consistent with broader developmental theories that hypothesize why some, but not all, youth from low SES environments are at increased risk for depression. Indeed, membership in other marginalized groups has been shown to interact with neural sensitivity to predict suicidality (Eckstrand et al., Reference Eckstrand, Silk, Nance, Wallace, Buckley, Lindenmuth, Flores, Alarcón, Quevedo, Phillips, Lenniger, McLean Sammon, Brostowin, Ryan, Jones and Forbes2022; Seah et al., Reference Seah, Eckstrand, Gupta, Marshal and Forbes2025). These findings and others suggest that neural sensitivity may be a key diathesis or vulnerability as implicated in diathesis stress models (Meehl, Reference Meehl1962; Monroe & Simons, Reference Monroe and Simons1991) or differential susceptibility models of depression (Belsky & Pluess, Reference Belsky and Pluess2009; Belsky et al., Reference Belsky, Bakermans-Kranenburg and Van IJzendoorn2007). Diathesis-stress models suggest that adolescent depression is the result of greater lifetime stress coupled with a sensitivity to stress, although these effects may vary by the specific kinds of stress (Guyer, Reference Guyer2020). For example, depression may result from interactions between hostile environments and brain responses to rejection (Masten et al., Reference Masten, Eisenberger, Borofsky, McNealy, Pfeifer and Dapretto2011), or between peer victimization and brain responses to parental praise (Sequeira et al., Reference Sequeira, Butterfield, Silk, Forbes and Ladouceur2019). The present study suggests that growing up in a low SES neighborhood, which can lead to increased interpersonal rejection and/or decreased acceptance, may be especially harmful for people insensitive to being accepted by others. Additionally, since adolescence is a time of increased neuroplasticity and heightened salience of peers (Nelson et al., Reference Nelson, Jarcho and Guyer2016), those living in a rejecting/discriminating environment who are also insensitive to acceptance may be particularly vulnerable during adolescence. That is, low SES exposes youth to discrimination, which, when combined with a blunted hedonic response to being accepted, may increase risk for depression.
Although the study was under-powered and not designed to examine a full mediation model, our findings that neighborhood SES is directly related to brain responses to peer feedback support a very plausible alternative explanation: that low SES environments cause individual differences in neural responses to peer feedback. For example, the “neural embedding of poverty” theory emphasizes corticolimbic circuitry as a mediator of how youth adapt to stressful environments (Hyde et al., Reference Hyde, Gard, Tomlinson, Burt, Mitchell and Monk2020). These theories suggest that as peers become more salient during adolescence, accepting and rejecting feedback by peers impacts adolescents’ affect more (Guyer & Jarcho, Reference Guyer, Jarcho, Rubin, Bukowski and Laursen2019; Somerville, Reference Somerville2013). However, chronically stressful environments (e.g., impoverished neighborhoods) may tune the brain towards threatening cues (e.g., rejection) so they can be avoided. Likewise, chronically unpredictable environments may lead to a negativity bias (Harhen & Bornstein, Reference Harhen and Bornstein2023). Here, we add to this theory by proposing that stressful environments may also tune the brain away from rewarding cues (acceptance) since they are deemed less salient. This pattern of tuning towards threats and away from rewards is associated with depression (Dillon et al., Reference Dillon, Rosso, Pechtel, Killgore, Rauch and Pizzagalli2014; Rupprechter et al., Reference Rupprechter, Stankevicius, Huys, Steele and Seriès2018) and greater difficulty forming and maintaining social relationships. Moreover, low SES environments provide fewer psychological buffers to stress (e.g., social cohesion), making peer relationships even more important for mental health (Levine, Reference Levine2017). In other words, growing up in low SES environments may result in adolescents (1) attending to more negative and less positive peer information, which (2) further deprives them of buffers against stress: healthy peer relationships.
We also examined participants’ ratings after receiving feedback, to determine whether these ratings showed similar patterns to brain responses. Similar to the ERP task effects, youth rated high-value acceptance as feeling better than rejection. However, neighborhood SES did not moderate associations between behavioral ratings and negative affect and was itself unrelated to behavioral ratings. One possible explanation is that self-reported ratings are less sensitive to individual differences in hedonic responses to acceptance than neural responses – all but six subjects rated feeling better after being accepted and worse after being rejected (by high-value peers). This would suggest that the relationship between neighborhood SES, response to peer acceptance/rejection, and negative affect may be more implicit than explicit.
The present study replicates a prior finding that lower SES is related to a more blunted brain response to acceptance (Rappaport et al., Reference Rappaport, Kujawa, Arfer, Pegg, Kelly, Jackson, Luby and Barch2024) but expands on this work. While the current study was comparable to this prior study in sample sizes and being oversampled for depression, the present study included: (1) a different social feedback task, (2) a different measure of SES (ADI vs. family-reported income-to-needs), (3) a younger sample (13–18-year-olds), and (4) data from two different, diverse metro areas. The current study also extended these findings by testing whether SES acts in combination with neurobiological patterns to predict affect outside of the lab. The use of ADI is a particularly notable advance in extending the findings to show that they reproduce with neighborhood-level SES rather than familial-reported SES.
Limitations
The results of the current study must also be considered in light of several limitations. First, although the ADI provides a rich measure of the neighborhood in which youth are currently living, it does not capture other aspects of adolescents’ environment such as where they spend significant time (e.g., school, after-school activities), or their specific family SES. Neighborhood measures are better at measuring environmental/community factors (e.g., crime or violence, access to community resources, residents’ shared values and norms, etc.) but may be worse at measuring individual/family factors such as ability to afford childcare or educational opportunities. Likewise, another limitation is that individual-level SES was not collected. Future studies measuring SES at both the individual and neighborhood level will clarify their relative impact (e.g., Tsai et al., Reference Tsai, Chung, Lee, Chou, Su, Shen, Lin and Chou2014). Second, we did not assess how long youth lived at the address used to determine ADI, although due to low upward mobility in the USA (Chetty et al., Reference Chetty, Hendren, Kline, Saez, Grusky and Hill2018) it is unlikely that SES dramatically changed. Third, we did not examine how the perceived race/ethnicity of the peer giving feedback during the task impacts brain responses. Half of the feedback came from peers that appear to be non-Hispanic White, while the other half came from peers perceived to be of another or multiple racial/ethnic identities. Thus, we were under-powered to test whether peer perceived race/ethnicity interacted with neural response to feedback. Fourth, we focused on brain response to acceptance residualized for rejection, rather than rejection residualized for acceptance. We did this because we were concerned that this would unnecessarily increase the number of statistical tests and not provide meaningful additional information. Future studies could consider including a neutral comparison condition (Pegg et al., Reference Pegg, Lytle, Arfer and Kujawa2022), however it remains an empirical question what constitutes “neutral” social feedback (Funkhouser et al., Reference Funkhouser, Auerbach, Kujawa, Morelli, Phan and Shankman2020). Fifth, the present study did not test mediational effects, such as whether brain responses to peer feedback mediate the relationship between neighborhood disadvantage and daily affect, given concerns about drawing conclusions about mediation from cross-sectional data (Maxwell et al., Reference Maxwell, Cole and Mitchell2011).
In conclusion, this study has clinical implications for the role of SES in mental health. Studies are beginning to elucidate the role and consequences of demographic factors on mental health symptoms (Correa et al., Reference Correa, Carrillo, Funkhouser, Shenberger and Shankman2022) as well as underlying neurobiological mechanisms (Barch et al., Reference Barch, Donohue, Elsayed, Gilbert, Harms, Hennefield, Herzberg, Kandala, Karcher, Jackson, Luking, Rappaport, Sanders, Taylor, Tillman, Vogel, Whalen and Luby2022; Palacios-Barrios & Hanson, Reference Palacios-Barrios and Hanson2019; Sheridan & McLaughlin, Reference Sheridan, McLaughlin, Asmundson and Afifi2020). Here, we showed that neighborhood SES is related to certain neurobiological patterns and that SES, in combination with neurobiological patterns, can explain significant variance in risk to adolescents’ mental health. Clinically, such findings may lead to a better understanding of who is at greatest risk, and more targeted intervention and prevention efforts. Several potentially fruitful neighborhood/community interventions exist, though with mixed support (Buechner et al., Reference Buechner, Toparlak, Ostinelli, Shokraneh, Nicholls-Mindlin, Cipriani, Geddes and Syed Sheriff2023). Increasing collective efficacy – i.e., a combination of collective regulation and trust within a community (Butel & Braun, Reference Butel and Braun2019; Ohmer et al., Reference Ohmer, Teixeira, Booth, Zuberi and Kolke2016) – is often a target of these interventions and may improve responsivity to peer acceptance given its emphasis on belonging and acceptance. More generally, in the absence of societal changes that lift youth out of poverty, understanding how SES interacts with individual vulnerabilities will be integral to addressing the growing youth mental health crisis.
Supplementary material
The supplementary material for this article can be found at https://doi.org/10.1017/S0954579426101722.
Data availability statement
Analysis code is available on Github (https://github.com/brappaport/BUDS-work.git). Data are available via the NIMH Data Archive (NDA).
Acknowledgments
The authors would like to thank all participants.
Author contributions
The authors made the following contributions. Brent I. Rappaport: Conceptualization, Formal analysis, Methodology, Writing–Original draft, Writing–review & editing; James E. Glazer: Methodology; Allison M. Letkiewicz: Writing–review & editing; Lilian Y. Li: Methodology, Writing–review & editing; Madeline M. McGregor: Data curation, Project administration, Writing–original draft; Sarah E. Sarkas: Data curation, Project administration; Aishwarya Sritharan: Data curation, Project administration; Lili A. Massac: Data curation, Project administration, Writing–original draft; Katherine Durham: Project administration; Randy P. Auerbach: Conceptualization, Funding acquisition, Investigation, Methodology, Resources, Supervision, Writing–review & editing; Stewart A. Shankman: Conceptualization, Funding acquisition, Investigation, Methodology, Resources, Supervision, Writing–review & editing.
Funding statement
This work was supported by the National Institute of Mental Health, including R01 MH119771 (RPA and SAS), T32 MH126368 (BIR), K23 MH129607 (AML), K99 MH133991 (LYL), and K23 MH136421 (BIR). RPA also received support through the Morgan Stanley Foundation. The content is solely the responsibility of the authors and does not necessarily represent the official views of the National Institutes of Health.
Competing interests
In the past 3 years, Dr. Auerbach has received funding from NIH/NIMH, the Morgan Stanley Foundation, and the Erick Shirley Foundation for Mental Health. He serves on the scientific advisory board for the Jake Collective and has received consulting fees and equity from Get Sonar, Inc. Dr. Auerbach also receives consulting fees from RPA Health Consulting, Inc. and Covington & Burling LLP, which is representing a social media company in litigation. No other authors have conflicts of interest to disclose.
Pre-registration statement
This study was not pre-registered because it was conducted as a secondary analysis developed after the initiation of the primary, grant-funded study.




 Open access

