Introduction
Low grade chronic inflammation is considered important for development of diabetic retinopathy (DR) (Tang & Kern, Reference Tang and Kern2011; Yu et al., Reference Yu, Chen and Su2015). TNF-α and IL-1β are upregulated in DR and genetic or pharmacologic inhibition of these cytokines prevents this disease (Krady et al., Reference Krady, Basu, Allen, Xu, LaNoue, Gardner and Levison2005; Vincent & Mohr, Reference Vincent and Mohr2007; Joussen et al., Reference Joussen, Doehmen, Le, Koizumi, Radetzky, Krohne, Poulaki, Semkova and Kociok2009; Yang et al., Reference Yang, Sun, Wu, Guo, Dou, Tso, Zhao and Li2009; Huang et al., Reference Huang, Gandhi, Zhong, Wei, Gong, Duh and Vinores2011). Upregulation of NOS2 and ICAM-1 with subsequent leukostasis also promotes DR (McLeod et al., Reference McLeod, Lefer, Merges and Lutty1995; Abu El-Asrar et al., Reference Abu El-Asrar, Desmet, Meersschaert, Dralands, Missotten and Geboes2001; Du et al., Reference Du, Smith, Miller and Kern2002; Joussen et al., Reference Joussen, Poulaki, Le, Koizumi, Esser, Janicki, Schraermeyer, Kociok, Fauser, Kirchlof, Kern and Adamis2004; Leal et al., Reference Leal, Manivannan, Hosoya, Terasaki, Cunha-Vaz, Ambrosio and Forrester2007; Zheng et al., Reference Zheng, Du, Miller, Gubitosi-Klug, Kern, Ball and Berkowitz2007 a). CD40 is a TNF receptor superfamily member that drives various inflammatory responses in the diabetic retina and is critical for development of DR (Portillo et al., Reference Portillo, Greene, Okenka, Miao, Sheibani, Kern and Subauste2014a ; Portillo et al. Reference Portillo, Lopez Corcino, Miao, Tang, Sheibani, Kern, Dubyak and Subauste2017). Notably, CD40 expression is increased in retinal endothelial cells, Müller glia and microglia of diabetic mice (Portillo et al., Reference Portillo, Greene, Okenka, Miao, Sheibani, Kern and Subauste2014a ). CD40 ligation induces increases in ICAM-1 expression in retinal endothelial cells and Müller glia, and upregulates NOS2 and nitric oxide production by Müller glia (Portillo et al., Reference Portillo, Greene, Okenka, Miao, Sheibani, Kern and Subauste2014a ; Portillo et al., Reference Portillo, Schwartz, Zarini, Bapputty, Kern, Gubitosi-Klug, Murphy, Subauste and Subauste2014b ). Diabetic CD40−/− mice are protected from upregulation of ICAM-1, TNF-α, IL-1β, CCL2 and NOS2 as well as from increased protein nitration in the retina. CD40−/− mice also exhibit reduced retinal leukostasis, and do not develop capillary degeneration compared to wildtype (WT) diabetics (Portillo et al., Reference Portillo, Greene, Okenka, Miao, Sheibani, Kern and Subauste2014a ; Portillo et al., Reference Portillo, Schwartz, Zarini, Bapputty, Kern, Gubitosi-Klug, Murphy, Subauste and Subauste2014b ; Portillo et al., Reference Portillo, Lopez Corcino, Miao, Tang, Sheibani, Kern, Dubyak and Subauste2017). A gain of function approach confirmed the critical role of CD40 in the development of inflammatory responses in the diabetic retina. Compared to diabetic transgenic mice that remained CD40−/−, diabetic transgenic mice with rescue of CD40 expression restricted to Müller glia developed upregulation of TNFα, IL-1β, ICAM-1 and NOS2 mRNA levels, leukostasis and capillary degeneration (Portillo et al., Reference Portillo, Lopez Corcino, Miao, Tang, Sheibani, Kern, Dubyak and Subauste2017). Taken together, these findings identified a critical role for CD40 signaling in the development of inflammation and the progression of DR.
Functional defects in the retina can be detected by electroretinography (ERG). Diabetic patients within 2 years of diagnosis exhibit abnormal components of the ERG, reduced contrast sensitivity and decreases in visual acuity (Roy et al., Reference Roy, Gunkel and Podgor1986; Di Leo et al., Reference Di Leo, Falsini, Caputo, Ghirlanda, Porciatti and Greco1990; Di Leo et al., Reference Di Leo, Caputo, Falsini, Porciatti, Greco and Ghirlanda1994; Antonetti et al., Reference Antonetti, Klein and Gardner2012). In rodent models of experimentally-induced diabetes, abnormal ERGs have been identified as early 2 weeks following the onset of hyperglycemia (Shinoda et al., Reference Shinoda, Rejdak, Schuettauf, Blatsios, Volker, Tanimoto, Olcay, Gekeler, Lehaci, Naskar, Zagorski and Zrenner2007; Simo et al., Reference Simo and Hernandez2012; Aung et al., Reference Aung, Kim, Olson, Thule and Pardue2013; Samuels et al., Reference Samuels, Bell, Pereira, Saxon and Peachey2015). The photoreceptor derived a-wave, bipolar cell dependent b-wave and light evoked responses of the retinal pigment epithelial cells (RPE) are each reduced (Kawasaki et al., Reference Kawasaki, Yonemura, Yokogawa, Saito and Kawakita1986; Phipps et al., Reference Phipps, Yee, Fletcher and Vingrys2006; Jackson & Barber, Reference Jackson and Barber2010; Aung et al., Reference Aung, Kim, Olson, Thule and Pardue2013). Moreover, reductions in OP amplitude and prolonged latencies are the most common ERG anomaly found as a result of diabetes (Yonemura et al., Reference Yonemura, Aoki and Tsuzuki1962; Hancock & Kraft, Reference Hancock and Kraft2004) (Phipps et al., Reference Phipps, Fletcher and Vingrys2004; Barile et al., Reference Barile, Pachydaki, Tari, Lee, Donmoyer, Ma, Rong, Buciarelli, Wendt, Horig, Hudson, Qu, Weinberg, Yan and Schmidt2005; Zheng et al., Reference Zheng, Howell, Hatala, Huang and Kern2007b ) and have been proposed to be predictive of progression to retinopathy in humans (Bresnick et al., Reference Bresnick, Korth, Groo and Palta1984). It has therefore been considered that retinal dysfunction is an early event in the pathogenesis of DR (Barber et al., Reference Barber, Lieth, Khin, Antonetti, Buchanan and Gardner1998; Barber, Reference Barber2003; Simo et al., Reference Simo and Hernandez2012).
The mechanisms that explain ERG abnormalities in diabetes have not been clearly identified. It has been proposed that these anomalies may be caused or exacerbated by the inflammatory response in the retina (Ozawa et al., Reference Ozawa, Kurihara, Sasaki, Ban, Yuki, Kubota and Tsubota2011; Tang & Kern, Reference Tang and Kern2011; Yu et al., Reference Yu, Chen and Su2015; Roy et al., Reference Roy, Kern, Song and Stuebe2017). Therefore, we examined the potential role of inflammation in the development of ERG defects associated with diabetes by testing whether diabetic CD40−/− mice (protected from retinal inflammation) display attenuated ERGs or exhibit light evoked responses similar to that of wildtype nondiabetic mice.
Materials and methods
Mice and induction of diabetes
C57Bl/6 (WT) and CD40−/− mice on a C57Bl/6 background (Jackson Laboratories, Bar Harbor, ME) were bred at Case Western Reserve University. Male WT and CD40−/− mice were made diabetic by administration of streptozotocin (STZ). Fasted mice of 20–25 g body weight received five daily intraperitoneal injections of STZ (55 mg/kg; MP Biomedicals, Solon, OH). Development of diabetes (blood glucose >250 mg/ml) was assessed beginning at 1 week following the final STZ injection. Blood glucose, glycated hemoglobin, and body weights were similar in all groups of diabetic mice. Studies adhered to the institutional guidelines for humane treatment of animals, “Principles of laboratory animal care” (NIH) and to the ARVO Statement for the Use of Animals in Ophthalmic and Vision Research. Studies were approved by the Institutional Animal Care and Use Committee of Case Western Reserve University.
ERG
After overnight dark adaptation, mice were anesthetized (80 mg/kg of ketamine and 16 mg/kg of xylazine), the cornea was anesthetized (1% proparacaine hydrochloride), and the pupils were dilated (1% tropicamide, 2.5% phenylephrine hydrochloride, and 1% cyclopentolate). Mice were placed on a temperature-regulated heating pad throughout each recording session. The protocol used to record ERG components generated by the outer neural retina has been described (Samuels et al., Reference Samuels, Sturgill, Grossman, Rayborn, Hollyfield and Peachey2010). In brief, responses of the outer retina were recorded with a contact lens electrode referenced to a needle electrode placed in the cheek in response to strobe-flash stimuli presented in the dark or superimposed on a steady 20 candela (cd)/m2 rod-desensitizing adapting field. The amplitude of the a-wave was measured 6 ms after flash onset from the pre-stimulus baseline. The amplitude of the b-wave was measured from the a-wave amplitude at 6 ms to the peak of the b-wave. As previously described (Samuels et al., Reference Samuels, Bell, Pereira, Saxon and Peachey2015), to measure the relative normalized a- and b-wave amplitudes, the a- and b-wave amplitude of each individual animal in response to the 1.4 log cd s/m2 stimulus was compared with the averaged control response and calculated as the relative amplitude. Relative diabetic amplitudes were then averaged and compared with the control average for statistical analysis. Oscillatory potentials were filtered from the averaged responses at 1.4 log cd s/m2, and peak amplitudes and latencies were measured as previously described (Hancock & Kraft, Reference Hancock and Kraft2004).
Real time quantitative PCR
Gene expression was assessed using cDNA, SYBR GREEN PCR Master Mix (Applied Biosystems, Foster City, CA), primers for TNF-α, IL-1β, NOS2, ICAM-1, or 18S rRNA and a 7300 Real Time PCR System (Applied Biosystems) as described (Portillo et al., Reference Portillo, Greene, Okenka, Miao, Sheibani, Kern and Subauste2014a ; Portillo et al., Reference Portillo, Lopez Corcino, Miao, Tang, Sheibani, Kern, Dubyak and Subauste2017). Each cDNA sample was run in triplicate. Samples were normalized according to the content of 18S rRNA.
Statistical analysis
Results were expressed as the mean ± s.e.m. Data was analyzed by ANOVA. Differences were considered statistically significant at P < 0.05.
Results
Diabetic CD40−/− mice are protected from upregulation of TNF-α, IL-1β, NOS2, and ICAM-1 in the retina
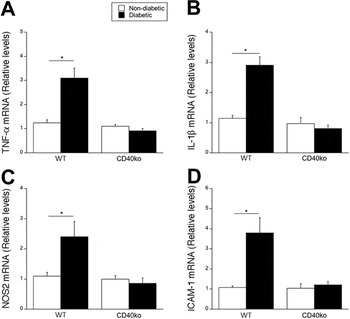
To investigate the contribution of inflammation to diabetes-induced disruption of the light evoked responses of the retina, we utilized WT and CD40−/− mice. CD40 is an upstream regulator of a broad range of inflammatory responses in the diabetic retina. Thus, we examined whether reduction in the expression of inflammatory molecules, due to the absence of CD40, decreases ERG changes in diabetic mice. WT and CD40−/− mice became diabetic within 1 week of the final STZ injection. Blood glucose concentration, HbA1c levels and body weights were similar in diabetic WT and CD40−/− mice (data not shown). As was previously reported (Portillo et al., Reference Portillo, Greene, Okenka, Miao, Sheibani, Kern and Subauste2014a ; Portillo et al., Reference Portillo, Lopez Corcino, Miao, Tang, Sheibani, Kern, Dubyak and Subauste2017), diabetic WT mice exhibited upregulation in TNF-α, IL-1β, NOS2, and ICAM-1 mRNA levels after 8 weeks of diabetes, while no change in the mRNA levels of these molecules was detected in diabetic CD40−/− mice at the same time point (Fig. 1).
Diabetic CD40−/− mice have impaired TNF-α, IL-1β, NOS2 and ICAM-1 upregulation. At 8 weeks of diabetes, retinas from diabetic WT and CD40−/− mice as well as from nondiabetic control animals of each cohort were collected and used for mRNA extraction. mRNA levels of TNF-α (A), IL-1β (B), NOS2 (C), and ICAM-1 (D), were assessed by real time quantitative PCR using 18S rRNA as the internal control. One nondiabetic WT mouse was given an arbitrary value of one and data are expressed as fold-increase compared to this animal. 6–10 mice per group. Data represent mean ± s.e.m. *P < 0.05 by ANOVA.

CD40−/− mice are not protected from diabetes-induced ERG changes
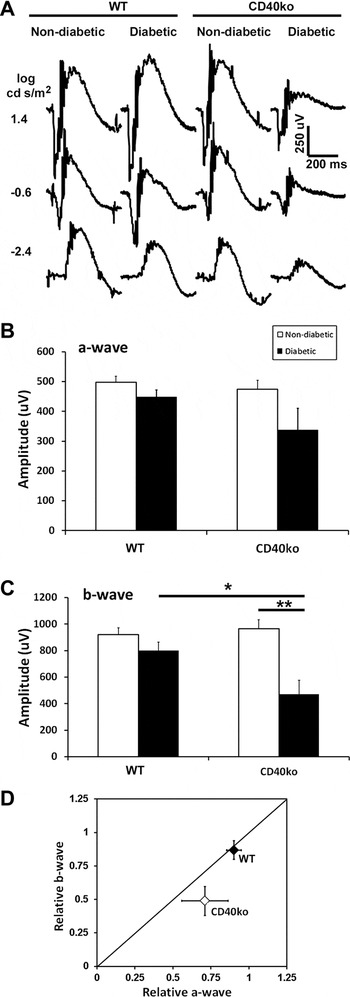
We performed strobe flash ERGs on non-diabetic and diabetic mice of each cohort at 8 weeks of diabetes. Representative waveform traces from low (−2.4 log cd s/m2) medium (−0.6 log cd s/m2) and high (1.4 log cd s/m2) flash stimuli of each group are depicted in Fig. 2A. Quantification of amplitudes and determination of statistical significance was performed for a- and b-wave amplitudes elicited in response to the 1.4 log cd s/m2 flash (Fig. 2B and 2C, respectively). We observed small reductions (P > 0.05) to the a- and b-wave amplitudes of diabetic WT mice at each flash intensity measured. However, diabetic CD40−/− mice exhibited significant reductions in the b-wave amplitude as compared to non-diabetic CD40−/− mice (Fig. 2C, **P = 0.002). Furthermore, the b-wave amplitude of diabetic CD40−/− mice was significantly lower than that of the diabetic WT mice (Fig. 2C, *P = 0.024).
Diabetic CD40−/− mice are not protected from diabetes-induced dark-adapted strobe flash ERG changes. (A) Representative strobe flash ERG responses recorded at increasing light intensities for each group. (B) Amplitude of the a-wave in response to the 1.4 log cd s/m2 stimulus. (C) Amplitude of the b-wave in response to the 1.4 log cd s/m2 stimulus. (D) Relative changes of the b-wave plotted as a function of the relative normalized amplitude of the a-wave. The diagonal line indicates an equivalent reduction in the a- and b-wave. For WT nondiabetic, n = 7; WT diabetic, n = 6, CD40ko nondiabetic, n = 4, CD40 diabetic, n = 4. Data represent mean ± s.e.m. Statistical analysis was performed using a one-way ANOVA followed by post hoc Tukey’s test. *P ≤ 0.01, **P ≤ 0.001.

The electroretinogram b-wave is generated secondary to the response of the rod photoreceptors. Therefore, in order to determine if the reduction to the b-wave was contributable to the a-wave reduction, we plotted the relative normalized b-wave amplitude as a function of the relative normalize a-wave (Fig. 2D). When points fall along the diagonal line, each parameter is reduced to an equivalent amount. When points fall below the diagonal line, the b-wave is affected to a greater extent than predicted by a reduction in the a-wave. We observe that the data point for the diabetic CD40−/− mice falls below the diagonal line (Fig. 2D, gray diamond). Therefore, for these mice, the b-wave is more significantly affected than that predicted by the a-wave reduction. In sum, these results indicate that (1) CD40-mediated inflammation does not drive ERG defects associated with experimentally induced diabetes, and (2) ERG defects due to diabetes are not mitigated by the absence of inflammatory cytokines.
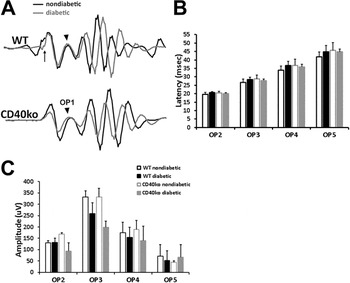
Oscillatory potentials (OPs), which are superimposed on the rise of the b-wave, reflect signaling between bipolar and amacrine cells (Wachtmeister, Reference Wachtmeister1998). Decreases in OP amplitude and increases in latency are common electroretinogram abnormalities as a results of diabetes (Bresnick et al., Reference Bresnick, Korth, Groo and Palta1984; Tzekov & Arden, Reference Tzekov and Arden1999; Shinoda et al., Reference Shinoda, Rejdak, Schuettauf, Blatsios, Volker, Tanimoto, Olcay, Gekeler, Lehaci, Naskar, Zagorski and Zrenner2007; Pescosolido et al., Reference Pescosolido, Barbato, Stefanucci and Buomprisco2015; Rajagopal et al., Reference Rajagopal, Bligard, Zhang, Yin, Lukasiewicz and Semenkovich2016). Changes to the latency and amplitude of oscillatory potentials due to diabetes have been found in both humans and animal models (Pardue et al., Reference Pardue, Ciavatta and Hetling2014b ). We also evaluated changes in OP amplitude and latency in each cohort of animals (Fig. 3). Representative traces of OP wavelets filtered from the light-evoked response of the strobe flash ERG are presented in Fig. 3A. Average latency (Fig. 3B) and amplitude (Fig. 3C) for OP wavelets 2–5 were calculated. The WT diabetic mice exhibited OPs with increased latency compared to nondiabetics of the same cohort, as predicted from other mouse models. However, diabetic CD40−/− mice displayed OPs of significantly smaller amplitude, but with decreased latency as compared to nondiabetic CD40−/− mice. These findings suggest that, as with the a- and b-wave amplitudes, changes in oscillatory potential latency and amplitude are not prevented by the loss of inflammatory molecules in diabetes.
Diabetic CD40−/− mice exhibit reduced oscillatory potential amplitudes but not increased latency. (A) Representative tracings of oscillatory potentials filtered from dark-adapted ERGs recorded in response to a 1.4 log cd s/m2 stimulus. Arrow indicates timing of light stimulus. Arrowheads denote OP1. (B) Average latency of each peak. For WT mice, latency of OP2–OP5 is slightly longer in diabetics compared to nondiabetics; for CD40−/− mice, latency is unchanged or shorter for diabetics as compared to non-diabetics. (C) Average amplitude of each peak. For WT mice, the average amplitude of OP2–OP5 is not statistically different from non-diabetics; however, for CD40−/− mice, OP3 was statistically smaller in diabetics as compared to non-diabetics. For WT nondiabetic, n = 7; WT diabetic, n = 6, CD40ko nondiabetic, n = 4, CD40 diabetic, n = 4. Data represent mean ± s.e.m. Statistical analysis was performed using a one-way ANOVA followed by post hoc Tukey’s test. *P ≤ 0.01, **P ≤ 0.001.

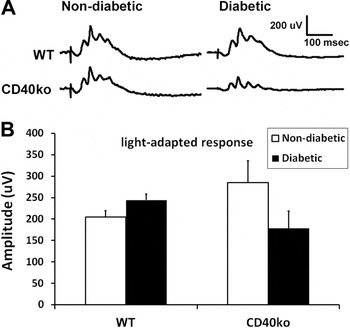
We further evaluated the light-adapted responses of the retina, which measure cone function, for each cohort of mice at 8 weeks of diabetes. Representative waveform traces are illustrated in Fig. 4A. Mean amplitude of the b-wave wave was calculated in response to the 1.4 log cd s/m2 flash stimulus (Fig. 4B). Although the response was lower in the CD40−/− diabetics as compared to the CD40−/− nondiabetics, no significant difference was found between groups.
Diabetic CD40−/− mice display normal light-adapted responses of the retina. (A) Representative ERG waveforms recorded in response to a 1.4 log cd s/m2 stimulus superimposed on a steady light adapting field after 10 min of light adaptation. (B). Average amplitude of the light adapted response for each group; for WT nondiabetic, n = 7; WT diabetic, n = 6, CD40ko nondiabetic, n = 4, CD40 diabetic, n = 4. Data represent mean ± s.e.m.

Discussion
Herein we demonstrate that diabetic CD40−/− mice exhibit ERG defects despite displaying reduced levels of pro-inflammatory cytokines. This finding supports the idea that changes in retinal function occur independent of the development of diabetes-induced inflammation, and are not reversed by the absence of an induction in pro-inflammatory molecules. It is well established that diabetic rodents exhibit reduced b-wave amplitudes (Li et al., Reference Li, Zemel, Miller and Perlman2002; Hancock & Kraft, Reference Hancock and Kraft2004; Phipps et al., Reference Phipps, Fletcher and Vingrys2004; Lai & Lo, Reference Lai and Lo2013; Bogdanov et al., Reference Bogdanov, Corraliza, Villena, Carvalho, Garcia-Arumi, Ramos, Ruberte, Simo and Hernandez2014; Pardue et al., Reference Pardue, Barnes, Kim, Aung, Amarnath, Olson and Thule2014a ). Indeed, we illustrate in Fig. 2 that diabetic WT and diabetic CD40−/− animals display reduced b-wave amplitudes.
Changes in contrast sensitivity as well as OP latency and amplitude, also occur at very early stages of DR (Yonemura et al., Reference Yonemura, Aoki and Tsuzuki1962; Kawasaki et al., Reference Kawasaki, Yonemura, Yokogawa, Saito and Kawakita1986; Roy et al., Reference Roy, Gunkel and Podgor1986; Tzekov & Arden, Reference Tzekov and Arden1999; Phipps et al., Reference Phipps, Yee, Fletcher and Vingrys2006; Shinoda et al., Reference Shinoda, Rejdak, Schuettauf, Blatsios, Volker, Tanimoto, Olcay, Gekeler, Lehaci, Naskar, Zagorski and Zrenner2007; Bronson-Castain et al., Reference Bronson-Castain, Bearse, Neuville, Jonasdottir, King-Hooper, Barez, Schneck and Adams2012; Boynton et al., Reference Boynton, Stem, Kwark, Jackson, Farsiu and Gardner2015; Pescosolido et al., Reference Pescosolido, Barbato, Stefanucci and Buomprisco2015; Samuels et al., Reference Samuels, Bell, Pereira, Saxon and Peachey2015; Rajagopal et al., Reference Rajagopal, Bligard, Zhang, Yin, Lukasiewicz and Semenkovich2016). In Fig. 3, we show that WT mice with only 8 weeks of diabetes exhibit small but not significant reductions in OP amplitude and similar small increases in latency of OP2-5. However, while CD40−/− mice diabetic for the same period also exhibit reduced OP amplitudes, they exhibit small decreases instead of increases in latency. This is likely explained by the fact that the b-wave is more severely affected in the diabetic CD40−/− mouse than the diabetic WT mouse (as shown in Fig. 2D). Because OPs are largely rod driven by white stimuli in the dark and the b-wave amplitude is reduced in the diabetic CD40−/− mouse but the rod-generated response of the a-wave remains intact, the OP latency is shorter when filtered from the waveform. It will be interesting to determine if significant decreases in OP latency are distinguishable with longer durations of diabetes in these animals.
CD40 has been detected at the protein level in various neuronal cells and neurons in the brain and retina (Tan et al., Reference Tan, Town, Mori, Obregon, Wu, DelleDonne, Rojiani, Crawford, Flavell and Mullan2002; Portillo et al., Reference Portillo, Okenka, Kern and Subauste2009). Neurons from CD40−/− mice are more susceptible to injury induced by serum or NGF-β withdrawal (Tan et al., Reference Tan, Town, Mori, Obregon, Wu, DelleDonne, Rojiani, Crawford, Flavell and Mullan2002). Moreover, neurons in the brains of adult CD40−/− mice show evidence of neuronal dysfunction (Tan et al., Reference Tan, Town, Mori, Obregon, Wu, DelleDonne, Rojiani, Crawford, Flavell and Mullan2002). It remains to be determined whether, in addition to ganglion cells (Portillo et al., Reference Portillo, Okenka, Kern and Subauste2009), other neurons in the retina express CD40. Our results that diabetic CD40−/− mice appear to display more significantly reduced ERG b-wave amplitudes than diabetic WT mice may be explained by the proposal that the absence of CD40 increases susceptibility to neuronal stress in vivo (Tan et al., Reference Tan, Town, Mori, Obregon, Wu, DelleDonne, Rojiani, Crawford, Flavell and Mullan2002).
Ample evidence demonstrates that inflammation plays a significant role in the development of DR (Barile et al., Reference Barile, Pachydaki, Tari, Lee, Donmoyer, Ma, Rong, Buciarelli, Wendt, Horig, Hudson, Qu, Weinberg, Yan and Schmidt2005; Tang & Kern, Reference Tang and Kern2011; Lee et al., Reference Lee, Li, Patel, Petrash, Benetz, Veenstra, Amengual, von Lintig, Burant, Tang and Kern2014). Yet, retinal dysfunction in mouse models of diabetes identified by ERG occurs extremely fast following onset of hyperglycemia and inhibition of various inflammatory molecules does not ameliorate retinal dysfunction in many of these mouse models. For example, inhibition of p38 MAPK and RAGE from the beginning of diabetes demonstrated no inhibition of reduced contrast sensitivity in mice at 8 months of diabetes (Lee et al., Reference Lee, Li, Patel, Petrash, Benetz, Veenstra, Amengual, von Lintig, Burant, Tang and Kern2014). Similarly, systemic absence of iNOS does not rescue b-wave defects (Zheng et al., Reference Zheng, Du, Miller, Gubitosi-Klug, Kern, Ball and Berkowitz2007a ), and loss of iNOS specifically from bone-marrow derived cells also did not change defects in spatial frequency (a surrogate of visual acuity) or contrast sensitivity (Lee et al., Reference Lee, Li, Patel, Petrash, Benetz, Veenstra, Amengual, von Lintig, Burant, Tang and Kern2014). Loss of Aldose reductase also did not protect 4 month diabetic mice from ERG defects (Samuels et al., Reference Samuels, Lee, Petrash, Peachey and Kern2012), although it did prevent capillary degeneration and superoxide generation in those mice (Tang et al., Reference Tang, Du, Petrash, Sheibani and Kern2013b ). Additionally, some anti-inflammatory treatments that affect one parameter of vision do not restore all aspects. Treatment of long-term diabetic mice with the dietary supplement metanx inhibited defects in retinal spatial frequency threshold and measures of oxidative stress and inflammation; however, it had no significant effect on contrast sensitivity or retinal capillary degeneration (Liu et al., Reference Liu, Tang, Lee and Kern2015).
Currently, the leading hypotheses for the progression of DR is that the high metabolic demand of the photoreceptors, either due to hypoxia or increased inflammation and oxidative stress contributes to the development of disease (Arden et al., Reference Arden, Wolf and Tsang1998; Arden et al., Reference Arden, Gunduz, Kurtenbach, Volker, Zrenner, Gunduz, Kamis, Ozturk and Okudan2010; Arden & Sivaprasad, Reference Arden and Sivaprasad2011; Arden et al., Reference Arden, Jyothi, Hogg, Lee and Sivaprasad2011; Tang et al., Reference Tang, Du, Lee, Talahalli, Eells and Kern2013a ; Saliba et al., Reference Saliba, Du, Liu, Patel, Roberts, Berkowitz and Kern2015; Liu et al., Reference Liu, Tang, Du, Saadane, Tonade, Samuels, Veenstra, Palczewski and Kern2016; Tonade et al., Reference Tonade, Liu and Kern2016; Roy et al., Reference Roy, Kern, Song and Stuebe2017). However, Newman and colleagues have shown that dim light adaptation, which reduces the metabolic demand of the photoreceptors, does not reduce the extent of ERG defects in an STZ-induced rat model of diabetes (Kur et al., Reference Kur, Burian and Newman2016). This finding and our data supports the idea that early retinal dysfunction is uncoupled from experimental diabetes induced inflammation and oxidative stress.
It is clear from our previous work that diabetic CD40−/− mice do not exhibit upregulation of inflammatory cytokines, ICAM-1 and CCL2 in the retina, increased retinal protein nitration, nor retinal leukostasis, and do not develop capillary degeneration (Portillo et al., Reference Portillo, Greene, Okenka, Miao, Sheibani, Kern and Subauste2014a ; Portillo et al., Reference Portillo, Schwartz, Zarini, Bapputty, Kern, Gubitosi-Klug, Murphy, Subauste and Subauste2014b ; Portillo et al., Reference Portillo, Lopez Corcino, Miao, Tang, Sheibani, Kern, Dubyak and Subauste2017). These data, juxtaposed with the findings here, support the notion that glucose itself must play a role in the development of ERG defects in diabetes. We have previously demonstrated that reductions in the ERG c-wave occur concurrently with elevated glucose levels but are protracted in periods of normoglycemia (Samuels et al., Reference Samuels, Bell, Pereira, Saxon and Peachey2015). However, ERG b-wave reductions that occur in the same time frame as hyperglycemia are irreversible if mice are returned to normoglycemia (Samuels et al., Reference Samuels, Bell, Pereira, Saxon and Peachey2015). Reductions in the fast oscillation component of the human electrooculogram in response to acute increases in glucose also demonstrates that hyperglycemia levels negatively impacts retina and RPE function (Schneck et al., Reference Schneck, Fortune and Adams2000). Furthermore, the use of multi-focal ERG has been effective in predicting the location of microaneurysm development in diabetic patients based on the location of decreased ERG responses (Bearse et al., Reference Bearse, Adams, Han, Schneck, Ng, Bronson-Castain and Barez2006), which has also been correlated with poor long-term glucose control (Lakhani et al., Reference Lakhani, Wright, Abdolell and Westall2010; Laron et al., Reference Laron, Bearse, Bronson-Castain, Jonasdottir, King-Hooper, Barez, Schneck and Adams2012).
In sum, these data indicate that diabetes-induced acute ERG defects are refractory to reduced inflammation. However, while the initial damage to the function of retinal neurons may therefore not respond to approaches that reduce retinal inflammation, the progression to chronic inflammation that induces hallmarks of retinopathy may be responsive to anti-inflammatory treatment.
Acknowledgments
We would like to thank Chieh Allen Lee for technical assistance and mouse maintenance. This study was supported by the National Institute of Heath grant R01 EY 019250 (C.S.S), Department of Veterans Affairs I01 BX002754-01A2 (I.S.S.), Foundation Fighting Blindness and Research to Prevent Blindness.