INTRODUCTION
Most regions of intensive agriculture in the world are confronted with water pollution by nitrates and related issues for drinking water supplies or coastal eutrophication. This has been attributed to the consequences of the generalized specialization of agricultural regions due to economic drivers (Krugman Reference Krugman1998; Grizzetti et al. Reference Grizzetti, Bouraoui and De Marsily2008; Bagoulla et al. Reference Bagoulla, Chevassus-Lozza, Daniel and Gaigné2010). National or trans-national regulations (i.e., the Water Frame Directive in Europe) have led to implement mitigation plans, including a large variety of measures mostly derived from lists of good management practices (Schoumans et al. Reference Schoumans, Chardon, Bechmann, Gascuel-Odoux, Hofman, Kronvang, Litaor, Lo Porto, Newell and Rubaek2011).
It is helpful to distinguish the measures aiming at optimizing the agrosystem without changing it markedly, i.e. preserving scenarios, in the typology suggested by Börjeson et al. (Reference Börjeson, Höjer, Dreborg, Ekvall and Finnveden2006) from those that involve a real transformation of the agrosystem (transforming scenarios). The preserving scenarios include fertilization adjustment, catch crop introduction, or setting up buffer systems of small extension (hedges, buffer strips); the transforming scenarios include changes in fodder systems (e.g., from silage maize-soya bean to grass based systems) or in stocking rates, conversion to organic farming, or setting up large buffer zones (e.g., riparian forests or unfertilized wet meadows, referred to in the current paper as riparian buffers). Given the cost and efforts required to implement these plans (even the preserving ones), there is a strong need to evaluate ex ante whether the planned measures (combined or not) are likely to reach the targeted reduction of nitrate concentrations in groundwater or streams. The response depends strongly on the context, i.e. the present level of nitrate concentrations, the type of agrosystem (land use, agricultural practices, crop distribution, etc.), the hydrological setting, the climatic conditions, the soil types and distribution, and the sensitivity of the water bodies (Gascuel-Odoux et al. Reference Gascuel-Odoux, Aurousseau, Durand, Ruiz and Molenat2010). Among the different methods available (Cherry et al. Reference Cherry, Shepherd, Withers and Mooney2008), agro-hydrological models are probably the most comprehensive and versatile, provided they are well adapted to the context and simulate properly the processes which are affected by the measures tested.
In the last two decades, significant research efforts have been put into understanding and quantifying the nitrogen (N) cycle in catchments and models have been developed and implemented to simulate a large variety of scenarios to assess the efficiency of different mitigation options in different contexts (Vaché et al. Reference Vaché, Eilers and Santelmann2002; Chaplot et al. Reference Chaplot, Saleh, Jaynes and Arnold2004; Arheimer et al. Reference Arheimer, Lowgren, Pers and Rosberg2005; Maringanti et al. Reference Maringanti, Chaubey and Popp2009; Yang & Wang Reference Yang and Wang2010; Morari et al. Reference Morari, Lugato, Polese, Berti and Giardini2012). Among this international effort, a particular set of modelling exercises has been carried out and applied in the context of Brittany, a 34 000 km2 peninsula of Western France, where water quality problems are particularly acute (Ruiz et al. Reference Ruiz, Abiven, Martin, Durand, Beaujouan and Molénat2002; Durand Reference Durand2004; Viaud et al. Reference Viaud, Durand, Merot, Sauboua and Saadi2005; Chambaut et al. Reference Chambaut, Bordenave, Durand, Fourrié and Laurent2008; Oehler et al. Reference Oehler, Durand, Bordenave, Saadi and Salmon-Monviola2009; Gascuel-Odoux et al. Reference Gascuel-Odoux, Aurousseau, Durand, Ruiz and Molenat2010; Salmon-Monviola et al. Reference Salmon-Monviola, Durand, Ferchaud, Oehler and Sorel2012; Ferrant et al. Reference Ferrant, Durand, Justes, Probst and Sanchez-Perez2013). This region is highly specialized in animal production, with a large livestock population of dairy cows, pigs and poultry associated with crop systems based on successions of maize, winter cereals, temporary grassland and vegetables. The climate is oceanic, the soils are shallow and free-draining and shallow groundwater circulation in the crystalline bedrock is the main pathway for nitrate movement from the soils to the rivers (Molénat et al. Reference Molénat, Durand, Gascuel-Odoux, Davy and Gruau2002). Most of the rivers are relatively short, making up a succession of small catchments flowing directly towards indented coastal areas. As a result, nitrate pollution has been a major environmental issue in the region since the late 1980s, both because the acceptable standard for drinking water of 11·3 mg/l is often exceeded and because of coastal eutrophication, with algal blooms (‘green tides’) or toxic cyanobacteria. These cases are occurring above very different thresholds of N concentration in the streams. Many mitigations plans have been designed and funded both at local and regional levels, and although the regional mean nitrate concentration has started to decline in the last decade, the cost-effectiveness of these plans is questionable, as pointed out regularly by the French National Court of Auditors.
The aim of the current paper is to summarize and discuss the general lessons to be learned from this experience, based on a selection of modelling results in two contrasting situations. The first objective is to analyse the impact of the measures tested, in order to assess their relative efficiency. The second objective is to discuss the importance of the model setting and of the criteria used to assess this efficiency. The third objective is to consider the operational implications of this exercise.
MATERIALS AND METHODS
Study sites
Two catchments were selected based on their contrasting characteristics. The first one (Kervidy-Naizin, K) is a small intensive farming catchment included in an Environmental Research Observatory with long-term and high-frequency monitoring. The second (Yar catchment, Y) is a larger site where agriculture is less intensive but green algae blooms on highly sensitive coastal area led to the implementation of mitigation plans to restore the quality of water. Basic monitoring was performed by local and regional authorities.
The Kervidy-Naizin catchment is located in western France (central Brittany: 48°N; 3°W). It is a 4·82 km2 headwater catchment, out of which flows a stream of 2nd Strahler order, which can dry out in summer. The catchment is part of the ORE AgrHys (Observatory for research in the environment), which belongs to the French network of observatories SOERE RBV (http://rnbv.ipgp.fr/). Many soil, hydrological and biogeochemical studies have been performed (Molénat et al. Reference Molénat, Durand, Gascuel-Odoux, Davy and Gruau2002, Reference Molénat, Gascuel-Odoux, Aquilina and Ruiz2013; Durand Reference Durand2004; Payraudeau et al. Reference Payraudeau, Van Der Werf and Vertès2007; Benhamou et al. Reference Benhamou, Salmon-Monviola, Durand, Grimaldi and Merot2013; Aubert et al. Reference Aubert, Gascuel-Odoux, Gruau, Akkal, Faucheux, Fauvel, Grimaldi, Hamon, Jaffrézic, Lecoz-Boutnik, Molénat, Petitjean, Ruiz and Merot2013) and all data, metadata and scientific papers about the catchment are available on the ORE-AgrHys website (http://www.inra.fr/ore_agrhys). The catchment lies on Upper Proterozoic schist covered by a layer of weathered material up to 30 m thick. A shallow-groundwater table develops in this unconsolidated layer. The soils are silty loams. Soils on the hillslopes are well-drained and consist of Alocrisols and Luvisols (brown soils). Soils in the lowest zones, often saturated by shallow water rising up to ground level, consist of un-weathered and weathered Luvisol-Reduxisols. The topography is moderate, with slopes no steeper than 0·05. Elevation ranges from 98 to 140 m a.s.l. The climate is temperate, with a mean daily temperature of 11·2 °C (1994–2000). Mean annual rainfall is 814 mm/year, with the maximum and minimum monthly mean reached in November (100 mm) and in June (38·5 mm), respectively. The annual stream-specific discharge is approximately 350 mm/year.
Twenty three farms have fields in this catchment. Agriculture is mainly intensive livestock farming: animal production includes pigs (about 35 000 head/year), poultry (40 500 head) and dairy and beef cows (3000 head). Animal production is essentially indoors, with a density of about 13 LSU/ha (livestock units, i.e. the equivalent of an average dairy cow). In 2010, land use included 0·20 cereals, 0·30 maize and 0·20 temporary or permanent pastures, the remaining 0·30 being dedicated to minor agricultural crops, woods and hedges and all infrastructure (roads, pig and hen houses, other buildings). In 2010, a detailed survey estimated the total N (N) surplus to about 200 kg/ha of agricultural area (AA) (Dalgaard et al. Reference Dalgaard, Bienkowski, Bleeker, Dragosits, Drouet, Durand, Frumau, Hutchings, Kedziora, Magliulo, Olesen, Theobald, Maury, Akkal and Cellier2012). Mean concentration of nitrates (NO3-N) in water is 16·5 mg NO3-N/l.
Discharge has been continuously monitored at the outlet since 1993 with a gauging station including a float-operating sensor and a data logger (Thalimedes OTT™, OTT Hydromet, Kempten, Germany). The weather station at Kervidy-Naizin (Cimel Enerco™ 516i, Paris, France) is located approximately 1 km away from the outlet. Stream water was manually sampled fortnightly from 1993 to 1999, then daily since 2000 at approximately the same hour, without specific sampling during storm events. Samples were immediately filtered (0·2 μm) and stored in the dark at 4 °C. Major anion concentrations (nitrate, chloride and sulphate) were measured by ion chromatography (DIONEX™ DX 100, Sunnyvale, CA, USA).
The Lieue de Grève catchment (48·5°N; 3·5°W) is located 70 km north-west from the Naizin catchment. The climate is slightly more humid with a mean annual rainfall of 950 mm varying with distance to the coast from 750 to 1200 mm and a mean annual temperature of 11·7 °C. The site area is 120 km2, of which 85 km2 are used for agriculture, and is comprised of five sub-watersheds corresponding to the five coastal rivers feeding the bay. The largest sub-watershed, the Yar, occupies 0·51 of the total area and accounts for 0·59 of nitrate loads to the bay. At the Yar outlet, daily stream discharge data have been recorded by local authorities since 1996, while nitrate concentration data are available weekly to biweekly since 1997. The mean annual concentration decreased from 6·7 mg NO3-N/l in 1997 to 5·9 mg NO3-N/l in 2007. The bay has been affected by green tides every spring and summer for 40 years. Drastic reduction in nitrate fluxes was identified as the only efficient way to control algal blooms (Ménesguen & Piriou Reference Ménesguen and Piriou1995), and Ménesguen (Reference Ménesguen and Merceron1999) suggested that a value as low as 2 mg NO3-N/l in the stream must be reached to halve algal bloom frequency.
Three main landscape units were identified based on geomorphology and land use (Mabon et al. Reference Mabon, Raimbault, Moreau, Devienne, Delaby, Durand, Ruiz and Vertes2009): (i) a coastal area, with small narrow valleys on metamorphic formations, (ii) a lowland area on loess, with deep loamy soils favourable to cash crops; and (iii) a granitic area, with steep slopes and shallow brown soils, where grasslands dominate. Most of the AA in the whole territory is devoted to ley-arable rotations on small to medium fields or to cash crop rotations in larger fields. Poorly drained soils in the valley bottoms occupy 0·16 of the area (half of them covered with pasture, the remaining with semi-natural vegetation), while woods cover the steepest slopes. In 2007, 194 farms had all or part of AA on the catchment (165 cattle farms, 8 intensive poultry or pig farms and 21 mixed animal–crop farms). In the Yar catchment, mainly situated on granite, AA comprises 0·64 of total area, mainly occupied by grassland (0·45 of the AA), and followed by wheat (0·24 AA) and maize (0·19 AA). The N surplus has not been estimated for the catchment, but Moreau et al. (Reference Moreau, Ruiz, Mabon, Raimbault, Durand, Delaby, Devienne and Vertes2012a) computed farm gate budgets varying between 65 and 110 kg/ha for all farms operating in the area.
Models
The Topography-based Nitrogen Transfer and Transformation model (TNT2) is an agro-hydrological model constructed by coupling a raster-based hydrological model (mostly based on assumptions from the rainfall-runoff model TOPMODEL, see Beaujouan et al. Reference Beaujouan, Durand, Ruiz, Aurousseau and Cotteret2002) and a crop model (adapted from the crop model Simulateur mulTIdiscplinaire pour les Cultures Standard (STICS), described in Brisson et al. Reference Brisson, Gary, Justes, Roche, Mary, Ripoche, Zimmer, Sierra, Bertuzzi, Burger, Bussière, Cabidoche, Cellier, Debaeke, Gaudillère, Hénault, Maraux, Seguin and Sinoquet2003). The main features added to the coupled model, compared with the component models, are its ability to simulate spatially the soil–shallow groundwater interactions and their influence on N transfer and processes (e.g., plant uptake and denitrification in valley bottoms of nitrate leached in upslope soils) and the adaptation of the crop model to simulate non-agricultural areas (hedges, grassland etc.). The TNT2 model has been thoroughly tested and is now used for research and operational studies on N cycling at the landscape scale (Viaud et al. Reference Viaud, Durand, Merot, Sauboua and Saadi2005; Chambaut et al. Reference Chambaut, Bordenave, Durand, Fourrié and Laurent2008; Oehler et al. Reference Oehler, Durand, Bordenave, Saadi and Salmon-Monviola2009; Ferrant et al. Reference Ferrant, Durand, Justes, Probst and Sanchez-Perez2013). Detailed descriptions of the model can be found elsewhere (Beaujouan et al. Reference Beaujouan, Durand, Ruiz, Aurousseau and Cotteret2002; Oehler et al. Reference Oehler, Durand, Bordenave, Saadi and Salmon-Monviola2009; Ferrant et al. Reference Ferrant, Oehler, Durand, Ruiz, Salmon-Monviola, Justes, Dugast, Probst, Probst and Sanchez-Perez2011, Reference Ferrant, Durand, Justes, Probst and Sanchez-Perez2013; Benhamou et al. Reference Benhamou, Salmon-Monviola, Durand, Grimaldi and Merot2013). The model applies more specifically to small rural catchments (typically < 100 km2) in the temperate zone, with shallow groundwater systems. The model is fully distributed, with different levels of spatial sub-division: pixels (computing units), soil units (soil and hydrological parameters), fields (agricultural management data and operations), climatic zones (from meteorological data) and catchment or sub-catchment (discharge and N concentration calculation). In particular, agricultural practices are input as a succession of individual management operations (sowing, fertilizer spreading, harvesting, etc.) for individual fields. In practice, for this model, a scenario will consist of a set of spatially distributed management practices, applied for a given period of time under given climatic conditions.
Constructing new scenarios with TNT2 consists of changing the management practices at the field level. The logic of crop succession and management operation is preserved. However, it is much more difficult to preserve the consistency of the farm system, since the farm level is not explicitly considered in the model. This is particularly critical for mixed farming systems, where the cropping and breeding systems are often closely linked, both for fodder production and for manure spreading. In other terms, when important changes of the cropping system are simulated, there is no guarantee in the scenario that enough forage will be produced for animals, or that the amount of manure applied will match the amount of manure produced. To solve this problem, a new model (CASIMOD'N, for Catchment and Agricultural Systems Integrated MODel for N) was built by coupling TNT2 with two other existing models that simulated parts of a farmer's strategy, namely Tournesol and Fumigene (Moreau et al. Reference Moreau, Ruiz, Vertès, Baratte, Delaby, Faverdin, Gascuel-Odoux, Piquemal, Ramat, Salmon-Monviola and Durand2013a). Tournesol determines the annual choice of crops in the fields of a farm given a set of constraints (surface, soil type and distance to farmstead of each field, forbidden crop successions, feed requirements of the livestock, etc.) and a set of preferences (strategy for livestock management, buying and selling options, etc.). Fumigene calculates the optimal way of distributing the manure produced in the farm on the different fields, and the amount of mineral fertilizer required, given another set of constraints (regulatory period and location of ban, plant requirements, distance to field, etc.). Therefore, instead of inputting individual management operations at the field level as in TNT2, constructing a scenario with CASIMOD'N involves defining the different set of constraints and preferences at the farm level for each farm operating in the catchment. Both models run continuously at a daily time step, for multiple year simulations.
Scenario implementation and assessment
The scenarios tested in the current study encompass the main types of mitigation measures designed and implemented to reduce diffuse nitrate pollution (Schoumans et al. Reference Schoumans, Chardon, Bechmann, Gascuel-Odoux, Hofman, Kronvang, Litaor, Lo Porto, Newell and Rubaek2011). They have different operational meanings in the two sites. In Kervidy-Naizin, a scenario can be viewed as a virtual experiment and its possible implementation is not considered, since no specific action is implemented there. On the contrary, in the Yar catchment the scenarios have been discussed with the stakeholders and are potentially part of an action plan to reduce nitrate pollution. Moreover, targeted concentrations in water are 2 and 11·3 mg NO3-N/l for Yar and Kervidy-Naizin, respectively, which makes a huge difference in terms of constraints on agricultural management.
Preserving scenarios
The most common optimization step is to decrease crop fertilization, assuming that nitrate leaching is due mainly to N excess at the field level. Two different scenarios have been tested, corresponding to the situations in the two catchments.
- In the Yar catchment, where mitigation plans have been applied in recent decades, a decrease in fertilization has been actually observed and documented since 1997, so the first scenario tested is basically the transcription in the model of these observations (YF scenario).
- In the Kervidy-Naizin catchment, where reductions in fertilization have not been documented, the scenario was constructed by reducing the amount of mineral fertilizer used to match the standards used for farmer advice in the area (KF scenario). The amount of manure spread was kept nearly constant in this scenario (even for some situations where the amount of organic N could exceed the standards) to avoid any implicit change in the animal production system, i.e. keeping it a strictly preserving scenario.
Another common mitigation measure is to introduce catch crops (CC) when possible to take up the N remaining after harvest and produced by mineralization in autumn and winter, thus limiting N leaching compared to bare soil (Shepherd & Webb Reference Shepherd and Webb1999; Justes et al. Reference Justes, Beaudoin, Bertuzzi, Charles, Dürr, Constantin, Hermon, Joannon, le Bas, Mary, Mignolet, Montfort, Ruiz, Sarthou, Souchère, Tournebize, Savini and Réchauchère2012; Premrov et al. Reference Premrov, Coxon, Hackett, Kirwan and Richards2014). In the Yar catchment, the YF scenario includes the minimal regulatory introduction of catch crops between winter cereals and maize. Further, all the options of CC introduction have been systematically explored and tested with TNT2, including different dates of sowing and destruction, different options of residue management, etc. Full results were published by Moreau et al. (Reference Moreau, Ruiz, Raimbault, Vertès, Cordier, Gascuel-Odoux, Masson, Salmon-Monviola and Durand2012b), and only the most efficient scenario in terms of stream nitrate flux reduction is presented in the current paper, i.e. the one where catch crops have the longest period of implantation, the largest extension and where the residues are removed from the field (denoted herein as YFCC). No corresponding scenario was tested in the Kervidy-Naizin catchment, where the mandatory catch crops have been introduced in all scenarios.
Preserving scenarios can also consist of attempts to optimize the buffering capacity of the areas not used for cropping. In many farming areas, fields and pastures used to be surrounded by hedgerows, a landscape type called ‘bocage’ in western France. Most of these hedges have been removed since the 1960s to increase the size of fields and facilitate the mechanization of agriculture. In the Kervidy-Naizin catchment, hedgerow density has decreased from 140 m/ha in 1952 (as derived from aerial photographs) to 48 m/ha in 2000. Many studies have highlighted the beneficial role of hedgerows for water quality, mainly as a barrier against erosion, but also, more recently, as a potential biogeochemical filter. After implementing a specific module to simulate the functioning of hedgerows in TNT2, Benhamou et al. (Reference Benhamou, Salmon-Monviola, Durand, Grimaldi and Merot2013) tested a scenario with the 1952 hedgerow network and present-day land use in the catchment, and the results of this scenario are used in the present paper (denoted as KH). Whether it is a ‘preserving’ scenario is questionable, since the size of the field obtained would be hardly compatible with today's agricultural practices. Nevertheless it was considered here as ‘preserving’ because all management practices were kept constant, even though there was a slight decrease of 3% in the total AA. Although not realistic, this scenario gives an idea of the maximum beneficial effect of such a mitigation measure.
Riparian buffer zones are often considered as an efficient way to reduce nitrate delivery due to their high denitrification activity and primary production. In the Yar catchment, this measure was added to the scenario that includes increased grassland (YFG: see below), by converting all the fields with poorly drained soils into unfertilized cut permanent grasslands (YFGW scenario). In Kervidy-Naizin this measure was included as also included as an option of the scenario increasing grassland area (KFGW, see below).
In both catchments all these scenarios were implemented using TNT2.
Transforming scenarios
Apart from overfertilization, nitrate leaching in the cropping systems of Brittany has three main causes:
- Leaching of the N mineralized during autumn and winter: high mineralization rates are observed due to the wet and mild climate, to high soil organic matter and high manure use over recent decades. Neither winter cereals nor catch crops sown in late autumn after maize are able to take up this entire amount of mineralized N.
- Leaching of the N mineralized after grassland cultivation in ley-arable systems. Common rotations consist in grass for 4–6 years, maize for 1–2 years and winter cereal for 1 year. About 250–400 kg N/ha is mineralized in the 2 years after grass leys are ploughed (Vertés et al. Reference Vertés, Hatch, Velthof, Taube, Laurent, Loiseau, Recous, De Vliegher and Carlier2007), which increases significantly the risk described above, although it is partially taken into account in fertilizer recommendations for the subsequent crop.
- Grassland management. In some intensive dairy systems, fields near the buildings are kept as grazed grassland, sometimes highly fertilized and receiving large amounts of N as animal excreta. This results in an overload of N in urine patches and increased risks of leaching during grassland life and after ploughing up. Local references (unpublished) suggest a surplus of 100 kg N/ha and sometimes much more.
Consequently, the conversion of part of the cropping area into long ley-arable rotations or permanent grasslands that results in a decrease of the annual crops and bare soil areas, together with a decrease of stocking rate in pastures, are likely to decrease the nitrate leaching risk significantly. Increasing the proportion of grassland in the catchment would result in a dramatic change in agricultural production system, i.e. moving from feeding cows on maize silage to grazing, increasing the area of cut grassland, adapting animal management (yield per animal, concentrates, herd replacement rate, etc.) or even switching from pigs (poultry) and cash crop farms to grass (or alfalfa) production.
In the Yar catchment, these changes have been simulated in three ways. In a first step, the TNT2 model was used to simulate a catchment-wide implementation of the Système Fourrager Econome en Intrants (SFEI: low input fodder systems) incentive, which limits the amount of total N and organic N applied at 170 and 140 kg/ha, respectively, and promotes the use of grass instead of silage maize (herein denoted as YFG: see Moreau et al. Reference Moreau, Ruiz, Mabon, Raimbault, Durand, Delaby, Devienne and Vertes2012a for more details). This has been done only by changing the crop proportions and fertilization to comply with these conditions at the catchment level, without taking into account consequences at the farm level (especially in terms of animal nutrition and excretion), which hindered appropriation of the results by stakeholders. In a second step, the CASIMOD'N model was built (Moreau et al. Reference Moreau, Ruiz, Vertès, Baratte, Delaby, Faverdin, Gascuel-Odoux, Piquemal, Ramat, Salmon-Monviola and Durand2013a) to ensure system consistency and used to test the same SFEI incentive, this time at the farm level and taking into account the characteristics of each farm (YFGca). In a third step, an alternative system change was co-constructed with local stakeholders to adapt to the specific context of the catchment. This is also a conversion to more grass-based dairy production system, namely an increase of grassland area to 0·64 AA and a maximum stocking rate of 1·4 LSU/ha of grassland (YGca scenario) at the farm level. The main difference with the SFEI incentive is that these objectives are compatible with maintaining constant on-farm milk production and allowing farmers to find alternative ways to comply. Indeed, changes towards these objectives were tested in nine pilot dairy farms of the catchment.
In the Kervidy-Naizin catchment, where grass-based systems are less likely to be acceptable given that most of the farms produce pigs or poultry, the increase of grassland area to 0·55 AA was simply tested using TNT2, without simulating the consequences for the farm systems. In combination with the scenario of reduced fertilization, two types of localization of the new grassland where tested, corresponding to two different logics. From the farmers’ standpoint, the logic would be to locate the new grassland fields close to animal buildings (KFG scenario); from the environmentalist standpoint, the most likely to give the better N retention is to locate them preferentially in the valley bottoms (KFGW).
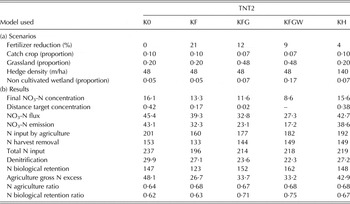
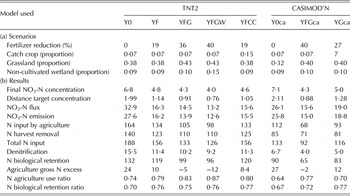
Tables 1 and 2 summarize the main features of the different scenarios.
(a) Main features of the scenarios for the Kervidy-Naizin catchment and (b) corresponding results (All values in kg/ha/year except concentrations in mg/l N-NO3 and dimensionless ratios. See the text for details)

TNT2, Topography-based Nitrogen Transfer and Transformation model; K0, reference scenario; KF, reduced fertilization scenario; KFG, KF + increased grassland area near farmsteads; KFGW, KF + increased grassland area in valley bottoms; KH, increased hedgerow density scenario.
(a) Main features of the scenarios for the Yar catchment and (b) corresponding results (All values in kg/ha/year except concentrations in mg/l N-NO3 and dimensionless ratios. See the text for details)
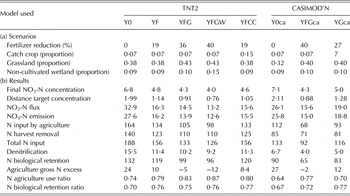
TNT2, Topography-based Nitrogen Transfer and Transformation model; CASIMOD'N, Catchment and Agricultural Systems Integrated MODel for Nitrogen; Y0, reference scenario; YF, reduced fertilization scenario; YFG, increased grassland and less milk production; YFGW, YFG + unmanaged grassland in valley bottoms; YCC, YF + catch crop in all arable lands; Y0ca, reference scenario with CASIMOD'N; YFGca, YFG: increased grassland area and less milk production simulated with CASIMOD'N; YGca, increased grassland area and constant milk production.
Simulation procedure
These scenarios have previously been implemented for different studies, with different model versions and parameter sets. In the present study, for the sake of homogeneity, they have all been simulated again with the latest parameter sets and version of the models.
In Kervidy-Naizin, the model ran for calibration-validation over an 8-year period with observed data (1998–2007, K0 scenario), followed by 8 years of simulation of the scenarios (2008–2015). In Yar, the calibration-validation period was also 1998–2007, but the first part (1998–2001) only is the Y0 scenario, the second part (2002–2007) being the YF1 scenario. Since the CASIMOD'N model used different input data, the simulation of the calibration period was different, and the present state (2005–2008) of the catchment (2005–2008) simulated by this model and used as a reference for the YGca scenario was called Y0ca. The scenarios for this catchment were then also run for 8 years. In all cases, the models were first run for 3 years to ‘spin up’ (i.e., reach equilibrium from the initial state). The results of the scenarios are the means for the last 3 years of the simulation, to account for variations due to climate and, to a certain extent, to the response time of the system (see also the definitions of indices used).
In both catchments, the climate sequence used for the scenarios (except YF) was a repetition of an average climatic year constructed month by month using average observed data (i.e., observed months with temperature and rainfall close to the inter-annual monthly means).
Performance indices
These scenarios are expected to decrease the N flux and concentrations at the outlet of the catchments, but also to change the N cycling and agricultural production. All N transformation rates and fluxes from soil to groundwater and from groundwater to soil, as well as soil and groundwater stores, have been calculated. To calculate the efficiency of the measures modelled by the scenarios, two integrated performance indices are defined:
- D tc (distance to targeted concentration), to assess the degree of success in matching the objective, calculated as follows:
If C s > C t:
 $${D_{{\rm tc}}} = ({C_{\rm s}} - {C_{\rm t}})/{C_{\rm t}}\,\,{\rm Else}\,\,{D_{{\rm tc}}} = 0$$
This index is computed differently for the Kervidy-Naizin and the Yar catchments because the targets are different: in the Kervidy-Naizin catchment, where the objective is to comply with the Nitrate Directive, Cs is the 90th percentile of the stream nitrate concentration for the last 3 years of the scenario, and Ct is the target concentration of 11·3 mg NO3-N/l. In the Yar catchment, where the objective is to reach a mean concentration of 2·3 mg NO3-N/l to obtain significant control of green tides, C s is the mean annual nitrate concentration in the stream for the last 3 years of the scenario.
- N emissions as NO3 in water, defined here as the mean annual NO3-N flux in streams plus the mean annual variation of NO3-N stored in groundwater during the scenario, i.e. a depletion of the NO3 store in groundwater is considered to represent a reduction in catchment water pollution, even if its effect on stream NO3 fluxes is delayed. This allows the response time of the systems due to hydrological lag times to be taken into account.
These performance indices have been plotted against three indices reflecting the importance of the changes induced by the mitigation measures or their effects on N cycling:
- N total input, defined here as the total amount of N added on fields: i.e., agricultural input (mineral fertilizers + manure spreading + animal excreta during grazing) + N fixation by legumes + atmospheric N deposition. Atmospheric deposition was estimated from the EMEP/MSC-W model (http://www.emep.int/mscw/index_mscw.html). It is noteworthy that some scenarios may not change N input (e.g., catch crop introduction), or may even increase it (e.g., when replacing maize by pasture).
- Variations of N harvest removal. Performing a cost–benefit evaluation of the scenario was beyond the scope of the current study, especially because the transforming scenarios have complex implications on the economy of the farms and of local agricultural operators. The impact of scenarios on production was estimated by computing the N harvest removal by crops and grass (from simulated yields and N content of harvested parts). To facilitate the comparison between the simulations, this was expressed as the relative variation of N harvest removal between a scenario and the reference (K0, Y0 or Y0ca):
- N biological retention (Nbr). In the catchment, N is taken up not only by crops but also by perennial vegetation (trees in hedges, woodlots, etc.). It can also be stored as organic N in soils. The sum of these processes represents the amount of N that is not directly emitted to the environment but stored as organic N. For some authors, biological retention of N also includes denitrification, but this process was treated separately. The part of N emitted as N2O during denitrification can be very significant in this type of system (Oehler et al. Reference Oehler, Bordenave and Durand2007), so its environmental significance is quite different from sequestration as organic N. Since the model calculates total denitrification only, it is provided in a distinct line, and Nbr was calculated as:
(2) $$\eqalign{{\rm Nbr} = & {\rm N}\,{\rm harvest}\,{\rm removal} \cr & + {\rm N}\,{\rm removal}\,{\rm by}\,{\rm perennial}\,{\rm vegetation} \cr & + {\rm \Delta Norg}}$$
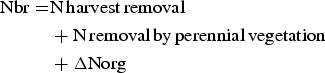
where ΔNorg is the variation of organic N in soils: total organic N in soils is an output of the model, and the variation can be either positive (built up) or negative (soil mining).
To complete these graphs, several other indices have been computed:
- agricultural gross excess N: agricultural input (mineral fertilizers + manure spreading + animal excreta during grazing) minus harvest removal;
- nitrogen biological retention ratio: Nbr/total N input;
- nitrogen use ratio by agriculture: N harvested/total N input;
- nitrogen biological retention ratio: Nbr/total N input.
RESULTS
The performance of the TNT2 and CASIMOD'N models to simulate observed behaviour of the two study catchments and other similar systems have been detailed in previous studies (Oehler et al. Reference Oehler, Durand, Bordenave, Saadi and Salmon-Monviola2009; Ferrant et al. Reference Ferrant, Oehler, Durand, Ruiz, Salmon-Monviola, Justes, Dugast, Probst, Probst and Sanchez-Perez2011; Moreau et al. Reference Moreau, Ruiz, Raimbault, Vertès, Cordier, Gascuel-Odoux, Masson, Salmon-Monviola and Durand2012b, Reference Moreau, Ruiz, Vertès, Baratte, Delaby, Faverdin, Gascuel-Odoux, Piquemal, Ramat, Salmon-Monviola and Durand2013a; Benhamou et al. Reference Benhamou, Salmon-Monviola, Durand, Grimaldi and Merot2013; Salmon-Monviola et al. Reference Salmon-Monviola, Moreau, Benhamou, Durand, Merot, Oehler and Gascuel-Odoux2013). Moreover, a detailed sensitivity analysis of TNT2 has been performed recently (Moreau et al. Reference Moreau, Viaud, Parnaudeau, Salmon-Monviola and Durand2013b). In brief, the models simulate correctly the daily discharge of water and the daily N fluxes at the outlet (Nash-Sutcliffe criteria >0·8 for calibration and 0·76 for validation in Kervidy-Naizin, and >0·82 for calibration and validation in Yar). The mean nitrate concentrations in stream water and their major trends are also simulated correctly, although the simulation of the daily variations are less accurate (RMSE of 24 and 16% of the mean for Kervidy-Naizin and Yar, respectively), which is often the case for this type of model (Ferrant et al. Reference Ferrant, Oehler, Durand, Ruiz, Salmon-Monviola, Justes, Dugast, Probst, Probst and Sanchez-Perez2011). The ability of the models to simulate the order of magnitude and variations of the other major processes has also been checked, based on available experimental data or local references. There is no difference between TNT2 and CASIMOD'N in their ability to predict water and nitrate fluxes. The main differences are in their ability to simulate the distribution of management practices in the catchments, as discussed in Moreau et al. (Reference Moreau, Ruiz, Vertès, Baratte, Delaby, Faverdin, Gascuel-Odoux, Piquemal, Ramat, Salmon-Monviola and Durand2013a).
The results of all scenarios are presented in Tables 1 and 2 and their graphical analysis is provided in Figs 1–4.
Efficacy of the mitigation measure tested
Of all mitigation measures tested, few reached the objectives at Kervidy-Naizin and none for the Yar catchment, where the objective is very ambitious. Limited changes such as reducing fertilization or introducing catch crops would decrease the mean NO3-N concentration to 5 and 14 mg/l in the Yar and Kervidy-Naizin catchments, respectively. In Kervidy-Naizin, the increase of grassland area from 0·30 to 0·60 of AA reduced mean NO3-N concentration to <11·3 mg/l when the grasslands were located in valley bottoms. In the Yar catchment, the combination of reduced fertilization and increased grassland area decreased NO3-N losses more than the other scenarios, but it is likely that setting more land aside from agricultural production would be necessary to control coastal eutrophication in this sensitive environment.
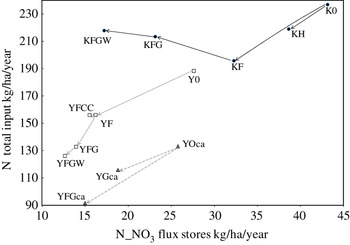
Nitrate emissions in water and nitrogen input relationships
The NO3 emissions in water were strongly related to N input (Fig. 1), and the scenarios with lower N inputs tended to produce lower emissions, as expected. However, increasing the grassland area in Kervidy-Naizin had the lowest NO3 emissions (KFG and KFGW scenarios) although N input increased because the pastures received more N than the annual crops. In the Yar catchment, the increase of grassland area did not increase N input for two reasons: first, since grassland already dominates the agricultural land, the increase in area introduced in the scenarios is much smaller (increasing from 0·50 to 0·65 of total AA) than in Kervidy-Naizin (increasing from 0·30 to 0·60 AA); second, in this catchment, all the scenarios included a constraint on total N inputs (Table 2).
Graphical scenario analysis 1: Total N input v. NO3 emissions in water. The arrows illustrate the type of change, i.e. solid line: fertilization reduction; dotted line: grassland area increase; dashed line: catch crop or buffer introduction.

Comparing the results obtained with TNT2 and CASIMOD'N illustrates the importance of the way the scenarios are built: with CASIMOD'N, the implementation of the SFEI incentive resulted in decreased N inputs of c. 44 kg/ha and decreased NO3-N emissions of 11 kg/ha (from Y0ca to YFGca), whereas with TNT2, N inputs decreased by 23 kg/ha and the NO3-N emissions decreased by 2 kg/ha (from YF to YFG).
The NO3-N emission is the sum of N flux in stream water plus the variation of the N groundwater store as computed by the model. The importance of the last term depends on the amount of nitrate in this store (i.e., its concentration and volume) as well as on its internal dynamics (distribution of velocities and residence times). In the Yar catchment, this term is relatively small, because (i) concentrations in groundwater are low and (ii) the transfer times as estimated by the model are shorter than the 8 years of simulation. In the Kervidy-Naizin catchment, the estimated N variations of the groundwater are highly significant, representing up to 30% of NO3-N flux in stream water, corroborating other studies on the importance of this compartment in this catchment (Molénat et al. Reference Molénat, Durand, Gascuel-Odoux, Davy and Gruau2002, Reference Molénat, Gascuel-Odoux, Aquilina and Ruiz2013).
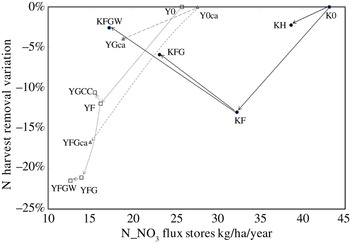
Nitrate-N emissions v. crop nitrogen export
Reducing N fertilization always resulted in a decrease of crop N export (Tables 1 and 2 and Fig. 2). Strong reduction of fertilization while keeping the production system unchanged resulted in larger crop N reduction than change to N flux. This is particularly clear when comparing the changes between Y0 and YF (decrease of 11 kg/ha of NO3-N emissions and of 17 kg/ha of export) and between YF and YFG (−2 kg/ha of NO3-N emissions and −13 kg/ha of export). In contrast, increasing the grassland area increased N export while reducing NO3-N emissions to water, as modelled in Kervidy-Naizin. This is also true, to a much lesser extent, for the catch crop scenario: in the YFCC scenario N export increased a little with a slight decrease of NO3-N emissions.
Graphical scenario analysis 2: N harvested v. NO3 emissions in water. The arrows illustrate the type of change, i.e. solid line: fertilization reduction; dotted line: grassland area increase; dashed line: catch crop or buffer introduction.

Nitrate input v. nitrogen biological retention
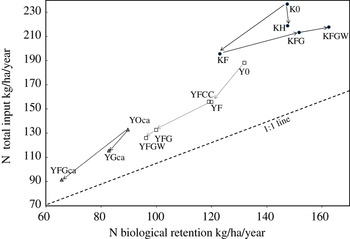
Figure 3 provides further explanations of the trends described above. The Nbr reflects overall productivity of the system, also taking the organic N balance of soil into account (i.e., ‘soil mining’ will decrease Nbr N), and therefore the soil inertia to management changes. Globally, Nbr increases with N input, which appears as the main driver. The scenarios closer to the 1:1 line exhibited systems where a higher proportion of the N input is retained within the catchment (i.e., higher Nbr ratio).
Graphical scenario analysis 3: N biological processing v. NO3 emissions in water. The arrows illustrate the type of change, i.e. solid line: fertilization reduction; dotted line: grassland area increase; dashed line: catch crop or buffer introduction.

On the whole, in the Yar catchment, with lower N input and more grassland, the Nbr ratio reached 0·77 as opposed to 0·68 in the Kervidy-Naizin catchment, due to more efficient N use. Potentially, a lower proportion of N input is emitted into the environment, although the wetter and cooler climate should enhance transfer at the expense of transformations. In a first step, reducing N input led to a decrease of the overall productivity of the system, but increased the retention capacity slightly. Introducing hedges or, to a lesser extent, catch crops, tended to increase the retention capacity without significant effect on productivity. Increasing the grassland area without controlling the N input enhanced the productivity without changing the retention capacity (from KF to KFG or KGW), whereas a more controlled change of the production system towards milk production based on grazed grassland increased the Nbr ratio of the system (from YF to YFG or from Y0ca to YFGca or YGca).
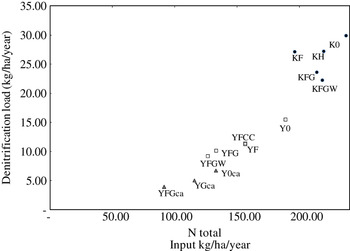
It is noteworthy that the scenarios aimed at enhancing riparian retention did not increase denitrification. This is illustrated in Fig. 4 and suggests that denitrification depended strongly on N input, and was less for the two ‘riparian buffer scenarios’ KGFW and YFGW as compared to the scenarios of same input: since it seemed mostly to be limited by NO3 availability, reducing management and fertilization in the riparian zones decreased the denitrification rate. Consequently, the decrease of NO3-N emissions obtained with these scenarios was due mostly to the increase of plant uptake and the limitation of N leaching by permanent cover, and not to an increase of denitrification, which is probably more secure for the environment (reducing N2O emissions). However, these conclusions need to be taken with caution, since (1) artificial drainage was not simulated, especially because information on area concerned is not easily available, (2) modelling denitrification, particularly at the landscape level, is highly uncertain and (3) the physiology of plants (crops, grass) under waterlogged conditions is also probably poorly simulated.
Graphical scenario analysis 4: Denitrification rate v. total N input. The arrows illustrate the type of change, i.e. solid line: fertilization reduction; dotted line: grassland area increase; dashed line: catch crop or buffer introduction.

DISCUSSION
This compilation of scenario simulations in two contrasted catchments raises important operational and scientific questions. The results show that the two main factors controlling the losses of nitrate to the aquatic environment, in this particular context, are the total input of N in the system and the proportion of annual crops in the catchment area. Although this result is already well known from geographical studies relating land use factors to N pollution (Johnson et al. Reference Johnson, Myers and Patil2001; Evans Reference Evans2002), it is important to place it in the context of assessing the efficiency of mitigation measures. In many situations important reductions of N losses will not be achieved without both decreasing the N loading and proportion of arable farming in the catchment.
Optimizing fertilizer use is a first step in producing significant N losses reduction, as shown by comparing K0 and Y0 with KF and YF scenarios, respectively. In the Yar catchment this has been achieved mainly through agricultural stewardship actions (Mabon et al. Reference Mabon, Raimbault, Moreau, Devienne, Delaby, Durand, Ruiz and Vertes2009; Moreau et al. Reference Moreau, Ruiz, Raimbault, Vertès, Cordier, Gascuel-Odoux, Masson, Salmon-Monviola and Durand2012b). The efficiency of reducing fertilizers and the possibility of achieving this via farmer advice and information have been widely demonstrated (Kay et al. Reference Kay, Edwards and Foulger2009, Reference Kay, Grayson, Phillips, Stanley, Dodsworth, Hanson, Walker, Foulger, McDonnell and Taylor2012; Oenema et al. Reference Oenema, Witzke, Klimont, Lesschen and Velthof2009; Blackstock et al. Reference Blackstock, Ingram, Burton, Brown and Slee2010; Barnes et al. Reference Barnes, Toma, Willock and Hall2013; Buckley & Carney Reference Buckley and Carney2013).
However, it is important to notice that reducing fertilization without changing land use is efficient only if it does not impact too much on harvest removal, i.e. as long as there is enough N available in soils to meet plant requirements. Beyond this point, a change of land use (i.e., increase of perennial vegetation) is required if further reductions of nitrate losses are required, otherwise the harvest removal will decrease faster than the losses. Although this result is well documented at the field level, some authors (Chaplot et al. Reference Chaplot, Saleh, Jaynes and Arnold2004) simulated steady decreases of N losses with large fertilizer reductions at the catchment scale. Other mechanisms such as soil organic N and groundwater NO3 variations also act to both delay and reduce the effects of changes in management practices on stream water NO3 concentrations and fluxes, as highlighted with the indicators used in the current study.
All these results may, in part, explain why the effects of N directive implementation in vulnerable zones are sometimes tenuous or even unobservable (Barnes et al. Reference Barnes, Willock, Hall and Toma2009; Worrall et al. Reference Worrall, Spencer and Burt2009; Velthof et al. Reference Velthof, Lesschen, Webb, Pietrzak, Miatkowski, Pinto, Kros and Oenema2014): when the changes in land use or management practices are not substantial (Barnes et al. Reference Barnes, Willock, Hall and Toma2009; Buckley Reference Buckley2012) and the hydrological and/or biogeochemical ‘inertia’ of the catchment is high, the variability of concentrations due to climate variations may well be higher than the decrease due to mitigation measures.
In the scenarios studied in the present paper, other measures such as introducing catch crops or buffer zones (riparian zones or hedges) seem to be interesting, but mainly as complementary measures. Whatever the mitigation measure considered, the area actually affected by the measure is a critical point: for example, the small effect of the catch crop scenario in the Yar catchment is mainly due to the relatively small area concerned. Since increasing this area is not possible due to the structure of crop rotations, the result is similar with different catch crop management options (see Moreau et al. Reference Moreau, Ruiz, Raimbault, Vertès, Cordier, Gascuel-Odoux, Masson, Salmon-Monviola and Durand2012b for a complete discussion). In this particular catchment, the same is true with riparian zones. Since already most of the valley bottoms are not cultivated, the conversion to riparian buffers of the remaining part has little effect on the stream water NO3 fluxes.
The high efficiency of riparian buffers in reducing NO3 pollution has been widely documented worldwide (Fisher & Acreman Reference Fisher and Acreman2004; Hoffmann et al. Reference Hoffmann, Kronvang and Audet2011; Verhoeven Reference Verhoeven2014). However, the current study and others (Haag & Kaupenjohann Reference Haag and Kaupenjohann2001) suggest that they may not be sufficient to reach very low nitrate concentrations in an intensive agriculture catchment. This is due mainly to hydrological settings that do not allow optimal retention (Haag & Kaupenjohann Reference Haag and Kaupenjohann2001; Dahl et al. Reference Dahl, Nilsson, Langhoff and Refsgaard2007), i.e.: (1) low hydraulic conductivity of the hydromorphic soils, (2) steep hydraulic gradients often observed due to impervious bedrock and steep slopes and (3) high hydraulic loads in winter coinciding with lower retention capacity.
Alternatively, constructed wetlands or bioreactors could be used in some places where ‘hotspots’ of N pollution are clearly identified, but less adapted to landscapes where agriculture land use is homogenous and non-point sources are dominant (Kovacic et al. Reference Kovacic, David, Gentry, Starks and Cooke2000; Tanner et al. Reference Tanner, Nguyen and Sukias2005; Blankenberg et al. Reference Blankenberg, Haarstad and Sovik2006; Brix et al. Reference Brix, Schierup and Arias2007; Healy et al. Reference Healy, Ibrahim, Lanigan, Serrenho and Fenton2012). Despite the interest of decision makers in this type of solution in the Brittany region, very few ecological engineering projects have been realized, especially due to difficulties in finding appropriate locations and disappointing results of pilot experiments.
Important reductions of N losses are particularly necessary in sensitive environments or where the present situation is one of very high N concentrations in streams and/or groundwater. In the case studies presented in the present paper, the problem is particularly acute due to high livestock densities and high N excess for at least four decades, occurring in a physiographical context where N is poorly retained and where the coastal areas are sensitive to eutrophication. In other regions, lower rainfall in winter, deeper soils or deeper groundwater, denitrifying soils or aquifers, efficient riparian zones, can help meeting the Water Framework Directive without much change in agriculture (Fenton et al. Reference Fenton, Richards, Kirwan, Khalil and Healy2009, Reference Fenton, Healy, Henry, Khalil, Grant, Baily and Richards2011; Baily et al. Reference Baily, Rock, Watson and Fenton2011; Hoffmann et al. Reference Hoffmann, Kronvang and Audet2011; Huebsch et al. Reference Huebsch, Horan, Blum, Richards, Grant and Fenton2013). Successful mitigation plans in these sensitive areas should trigger important changes on the majority of farms in a given area, which is a fairly ambitious objective. Lowering N inputs and decreasing annual crops in large areas imply dramatic transformations of production systems (involving decrease of crop and/or animal production) that farmers are, in general, not willing or able to undertake. The distrust of farmers, the lack of flexibility due to economic and structural constraints, and sometimes the lack of reliable knowledge on the effects of changes are strong impediments to change, especially at the territory scale where collective actions are required. Although the regulations on water quality are numerous and strict, it is clear that they are not sufficient to make a whole territory move towards a land use compatible with the target, which would involve converting a proportion of the AA to forest or to unmanaged grassland. The resulting reduction of the agriculture production of the area would have social and economic costs that should be put in perspective with respect to the expected environmental benefits.
Another important result is that the scenario analyses are very sensitive to the way the operational question (e.g., what is the impact on N losses of increasing grassland area?) is translated within the modelling process. The importance of this step (sometimes referred to as ‘experiment specification’) has already been stressed in studies analysing modelling approaches for water resources management (Caminiti Reference Caminiti2004; Eriksen et al. Reference Eriksen, Askegaard and Kristensen2004; Jakeman et al. Reference Jakeman, Letcher and Norton2006; Leenhardt et al. Reference Leenhardt, Therond, Cordier, Gascuel-Odoux, Reynaud, Durand, Bergez, Clavel, Masson and Moreau2012). In the present study, depending on the tools and hypotheses used to implement the scenario, the results are quite different, especially if they are analysed not only in a water pollution perspective but also considering the effect on the whole N cycle and their acceptability for stakeholders. This is particularly critical when the mitigation measures tested would involve dramatic changes of the agricultural systems.
CONCLUSION
By putting together the results of scenario analyses coming from two contrasting catchments and using two different models, the current paper stresses the importance of considering the operational objective in designing and evaluating mitigation plans and the sensitivity of the simulated efficiency of the given measure to the hypotheses used to construct the scenario and to the initial conditions of the system. It also points out the magnitude of the changes in agriculture required to reach low nitrate levels in streams. The quantitative assessment of the efficiency of mitigation measures for N pollution requires at the same time a good modelling tool (or, preferably, the combination of different models), a good knowledge of the hydrological and biogeochemical functioning of the area, and a thorough understanding of agricultural systems and of stakeholders’ constraint and objectives. The precision and reliability of the models’ predictions still need to be improved, particularly for testing transforming scenarios. Multidisciplinary approaches combining, at the same scale, biophysical models with social and economic analyses are necessary to help stakeholders finding acceptable compromises in sensitive environments.
This work was funded by the French National Research Agency (ACASSYA program, ANR-STRA-08-01-01) and the Lannion-Tregor Distric Council. The authors are grateful to the local authorities and the farmers for their cooperation to this project.