Implications
Despite the fact that sire-specific genetic effects are typically ignored in genetic evaluation models, their real impact remains almost unknown in livestock species. Both Y chromosome-related effects and paternal imprinting effects were evaluated on birth and weaning weight (WWT) in the Bruna dels Pirineus beef cattle breed. Whereas Y chromosome effects influenced both traits and accounted for ∼2% and 6% of the phenotypic variance, respectively, paternal imprinting effects restricted to WWT (∼13% of the phenotypic variability). Our results highlighted the relevance of these sire-specific sources of variation in beef cattle, and provided relevant information to optimize genetic evaluation models for weight traits.
Introduction
Quantitative genetic studies in beef cattle typically rely on the direct infinitesimal polygenetic effect (Henderson, Reference Henderson1973) and sometimes on maternal genetic effects (Quintanilla et al., Reference Quintanilla, Varona, Pujol and Piedrafita1999). These additive genetic effects derive from the contribution of both parents on the offspring's genome, although parent-of-origin-specific effects have been previously suggested in beef cattle (Bünger et al., Reference Bünger, Renne, Dietl and Pirchner1995; Goodall and Schmutz, Reference Goodall and Schmutz2007). Focusing on sire-specific variability, both the influence of genes from the non-autosomal region of the Y chromosome and the effect of paternal imprinting must be anticipated as potential sources of non-Mendelian inheritance. Nevertheless, little is known about the impact of these genetic mechanisms on productive traits in beef cattle.
Contradictory results about the impact of the Y chromosome on carcass traits in Simmental cattle were provided by Reinsch et al. (Reference Reinsch, Engellandt, Schild and Kalm1999) and Neugebauer et al. (Reference Neugebauer, Räder, Schild, Zimmer and Reinsch2010), although large effects were discarded. However, in mice, Schwenker and Maxon (Reference Schwenker and Maxon1986) and Bünger et al. (Reference Bünger, Renne, Dietl and Pirchner1995) reported significant influences from the Y chromosome on growth, BW and testis weight. A similar scenario was found for the imprinting phenomenon in beef cattle where available results restricted to original researches conducted on German Gelbvieh (Engellandt and Tier, Reference Engellandt and Tier2002) and Simmental cattle (Neugebauer et al., Reference Neugebauer, Räder, Schild, Zimmer and Reinsch2010); imprinting variability was revealed on several carcass traits. Furthermore, some imprinted quantitative trait loci have been detected in livestock species for growth and fatness traits (De Koning et al., Reference De Koning, Rattink, Harlizius, Groenen, Brascamp and Van Arendonk2001a and Reference De Koning, Harlizius, Rattink, Groenen, Brascamp and Van Arendonk2011b).
Given the shortage of results on the contribution of paternal genetic effects in beef cattle, this manuscript focused on the Bayesian modeling of two sire-specific additive genetic variances on birth weight (BWT) and weaning weight (WWT) traits in the Bruna dels Pirineus beef cattle breed.
Material and methods
Animal Care and Use Committee approval was not obtained for this study because analyses were performed on existing data obtained under standard management from commercial farms. Both productive and reproductive data were collected by the stockbreeders themselves and managed by the Bruna dels Pirineus Breed Society (FEBRUPI; http://www.brunadelspirineus.org) within the context of its Yield Recording Scheme.
Population and data source
This study was performed on field data from the Bruna dels Pirineus breed, an autochthonous beef cattle breed located in the mountainous areas of Catalonia (Northeastern Spain). The Bruna dels Pirineus is a medium-sized cattle breed (bulls, 950 to 1400 kg of live BW; cows, 550 to 950 kg of live BW) with an approximate census of 30 000 cows (FEBRUPI, personal communication). This breed is reared under extensive conditions for the production of beef calves; they reach an average carcass weight at slaughter of 330 kg (∼12.5 months; Serra et al., Reference Serra, Gil, Gispert, Guerrero, Oliver, Sañudo, Campo, Panea, Olleta, Quintanilla and Piedrafita2004).
Raw data from purebred calves were recorded between 1985 and 2010 in 12 herds participating in the Yield Recording Scheme of the Bruna dels Pirineus breed. This study focused on BWT and 185 day-standardized WWT, following the guidelines from the Beef Improvement Federation (1986). Herds were chosen on the basis of their genetic connectedness following Tarrés et al. (Reference Tarrés, Fina and Piedrafita2010). Calves lighter than 20 kg or heavier than 70 kg at birth were removed from the final data set, as well as those calves with WWT smaller than 120 kg or larger than 400 kg. Moreover, calves with unknown paternity were discarded in order to prevent disturbances in the analysis of the effect of sire lineage (see below). After editing, only those herds contributing a minimum of 100 calves with BWT or WWT data were included in the analyses. Final data sets consisted of 8130 BWT records and 1245 WWT records from 12 and 2 herds, respectively. Note that these two herds contributing WWT data were also involved in the analysis of BWT.
Pedigree file for BWT included 10 266 animals with 230 sires and 2671 dams, whereas WWT pedigree had 1799 individuals, 97 and 565 of them being bulls and cows with registered offspring, respectively. As Y chromosome effects are inherited from father to sons without changes, it was important to identify every sire lineage where this effect was shared. For each male offspring, the origin of its Y chromosome was traced back to the oldest male ancestor in the pedigree. This study included 47 sire lineages for BWT and 34 for WWT.
Statistical analyses
Operational model
For both weight traits, data (y) were analyzed under four different models. Nevertheless, only the most complex model (i.e. full model) will be described in detail in order to avoid redundancies in the manuscript. In addition to the systematic (b), permanent and genetic effects outlined below, the full model (model YI) accounted for the Y chromosome permanent genetic effect (s) and the paternal imprinting additive genetic effect (i). The three remaining models assumed the same structure of model YI; however, they excluded Y chromosome effects (model IN), paternal imprinting effects (model YN) or both Y chromosome and paternal imprinting effects (model NN). Focusing on model YI, it was stated as
 $$y\, = \,\bf Xb\, + \,{{Z}_{\rm{1}}}{\rm{a}}\,{\rm{ + }}\,{{Z}_{\rm{2}}}{\rm{i}}\,{\rm{ + }}\,{{Z}_{\rm{3}}}{\rm{d}}\,{\rm{ + }}\,{{Z}_{\rm{4}}}{\rm{h}}\,{\rm{ + }}\,{{Z}_{\rm{5}}}s\,{\rm{ + }}\,e$$
where a was the vector of direct additive infinitesimal genetic effects, d was the vector of dam-specific permanent environmental effects, h was the vector of herd-year-season permanent environmental effects, e was the vector of residual terms and X, Z1, Z2, Z3, Z4 and Z5 were appropriate incidence matrices. Systematic effects accounted for the age of the dam at calving with six categories as defined by Casellas and Piedrafita (Reference Casellas and Piedrafita2002), birth type (single or twins), and sex of the calf (male or female).
Bayesian inference
All models were analyzed under a Bayesian approach. The joint posterior distribution of all unknown parameters in model YI was proportional to
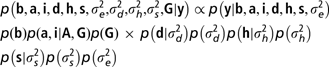 $${ & p\left( {{\bf {{b}}},{\bf {{a}}},{\bf {{i}}},{\bf {{d}}},{\bf {{h}}},{\bf {{s}}},\sigma _{e}^{{\rm{2}}} {\rm{,}}\sigma _{d}^{{\rm{2}}} {\rm{,}}\sigma _{h}^{{\rm{2}}} {\rm{,}}\sigma _{s}^{{\rm{2}}} {\rm{,}}{\bf {{G}}}|{\bf {{y}}}} \right) \propto {{p\left( {{\bf {{y}}}|{\bf {{b}}},{\bf {{a}}},{\bf {{i}}},{\bf {{d}}},{\bf {{h}}},{\bf {{s}}},\sigma _{e}^{{\rm{2}}} } \right)}} \cr & p\left( {\bf {{b}}} \right)p\left( {{\bf {{a}}},{\bf {{i}}}\left| {{\bf {{A}}},{\bf {{G}}}} \right.} \right)p\left( {\bf {{G}}} \right)\,\times \,p\left( {{\bf {{d}}}|\sigma _{d}^{{\rm{2}}} } \right)p\left( {\sigma _{d}^{{\rm{2}}} } \right)p\left( {{\bf {{h}}}|\sigma _{h}^{{\rm{2}}} } \right)p\left( {\sigma _{h}^{{\rm{2}}} } \right) \cr & p\left( {{\bf {{s}}}|\sigma _{s}^{{\rm{2}}} } \right)p\left( {\sigma _{s}^{{\rm{2}}} } \right)p\left( {\sigma _{e}^{{\rm{2}}} } \right) $$
where A was the numerator relationship matrix (Wright, Reference Wright1922) with genetic groups (Westell et al., Reference Westell, Quaas and Van Vleck1988). Following Casellas et al. (Reference Casellas, Piedrafita and Varona2007), BWT analyses accounted for 28 genetic groups, 25 for unknown sires and 3 for unknown dams, whereas WWT analyses accounted for 6 genetic groups, 5 for unknown sires and 1 for unknown dams. In a Bayesian setting, the joint a priori distribution of a and i effects was assumed multivariate normal,
 $$p\left( {{\bf {{a}}},{\bf {{i}}}|{\bf {{A}}},{\bf {{G}}}} \right)\, = \,MVN\,\left( {0,\,{\bf {{G}}}\, \otimes \,{\bf {{A}}}} \right)$$
where G was the additive genetic (co)variance matrix with structure  $$)(--><$>{\bf {{G}}}\, = \,\left[ {<!\begin{array}{*{20}c}>{ {\sigma _{a}^{2} } \quad {{{\sigma }_{a,i}}}\atop{{{\sigma }_{a,i}}} \quad {\sigma _{i}^{2} } \\\end{array}}} \right]<$><!--$$, and
 $$)(--><$>\sigma _{a}^{{\rm{2}}} <$><!--$$,
 $$)(--><$>\sigma _{i}^{{\rm{2}}} <$><!--$$ and
 $$)(--><$>{{\sigma }_{ai}}<$><!--$$ were the direct additive genetic variance, paternal imprinting variance and the genetic covariance, respectively. A priori distributions for random permanent effects were also assumed multivariate normal,
 $$\openup 3pt{ p\left( {{\bf {{d}}}|\sigma _{d}^{{\rm{2}}} } \right)\, = \,MVN\left( {0,{{{\bf {{I}}}}_d}\sigma _{d}^{2} } \right) \cr p\left( {{\bf {{h}}}|\sigma _{h}^{{\rm{2}}} } \right)\, = \,MVN\left( {0,{{{\bf {{I}}}}_h}\sigma _{h}^{2} } \right) \cr p\left( {{\bf {{s}}}|\sigma _{s}^{{\rm{2}}} } \right)\, = \,MVN\left( {0,{{{\bf {{I}}}}_s}\sigma _{s}^{2} } \right) \cr p\left( {{\bf {{e}}}|{\rm{\sigma }}_{e}^{{\rm{2}}} } \right)\, = \,MVN\left( {0,{{{\bf {{I}}}}_e}\sigma _{e}^{2} } \right) $$
where Id, Ih, Is and Ie were identity matrices with dimensions as the number of elements stored in d, h, s and e, respectively. Note that  $$)(--><$>\sigma _{d}^{{\rm{2}}} <$><!--$$ was the permanent environmental variance,
 $$)(--><$> \sigma _{h}^{{\rm{2}}} <$><!--$$ was the herd-year-season variance,
 $$)(--><$> \sigma _{s}^{{\rm{2}}} <$><!--$$ was the Y chromosome genetic variance and
 $$)(--><$> \sigma _{e}^{{\rm{2}}} <$><!--$$ was the residual variance. Flat priors were assumed for p(b),
 $$)(--><$> p\left( {\sigma _{d}^{{\rm{2}}} } \right),\,p\left( {\sigma _{h}^{{\rm{2}}} } \right),p\left( {\sigma _{s}^{{\rm{2}}} } \right)\,{\rm{and}}\;p\left( {\sigma _{e}^{{\rm{2}}} } \right) <$><!--$$.
Markov chain Monte Carlo (MCMC) sampling
Marginal posterior distributions of all unknowns were estimated by using the Gibbs sampling algorithm (Geman and Geman, Reference Geman and Geman1984). After exploratory analyses, we launched three independent chains with 5 050 000 iterations for each analysis (i.e. model within phenotypic trait) and the first 50 000 were discarded as burn-in (Raftery and Lewis, Reference Raftery and Lewis1992). A total of 100 000 samples of model parameters were saved from each chain with a lag interval of 50 iterations; samples from all three chains were used to characterize the posterior distribution of each model parameter invoking the ergodic property of the chains (Gilks et al., Reference Gilks, Richardson and Spiegelhalter1996). The effective chain length of the MCMC process was calculated by Geyer (Reference Geyer1992).
Model comparison
The within-trait statistical performance of models YI, NI, YN and NN was compared by the deviance information criterion (DIC; Spiegelhalter et al., Reference Spiegelhalter, Best and Carlin1998 and Reference Spiegelhalter, Best, Carlin and Van der Linde2002). This statistic measures model performance in two different ways, the posterior expectation of the Bayesian deviance (i.e. model fit) and the effective number of parameters (i.e. model complexity). A smaller value of DIC indicates a better fit of the model and a lesser degree of complexity. Note that reductions of three or more DIC units are typically considered as statistically relevant (Spiegelhalter et al., Reference Spiegelhalter, Best, Carlin and Van der Linde2002).
Results
Phenotypic and genealogic summary
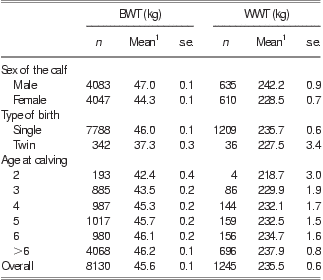
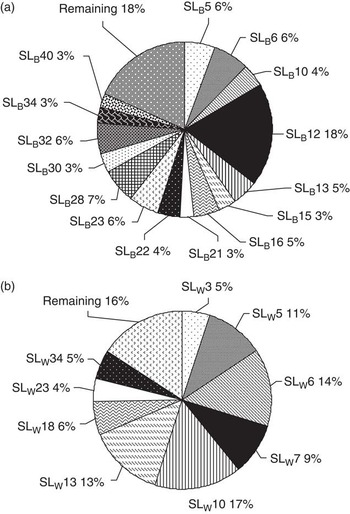
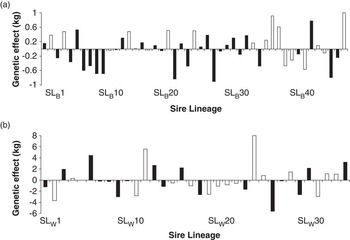
A phenotypic summary of BWT and WWT in the Bruna dels Pirineus beef cattle breed is shown in Table 1. Calves contributing to our analyses averaged 45.6 ± 0.1 kg at birth and reached 235.5 ± 0.6 kg at weaning, although there were remarkable phenotypic differences linked to sex, birth type and age of the dam. Focusing on genealogical data, all individuals derived from 47 founder bulls which became the origin of the 47 sire lineages included in our analyses for BWT. In order to characterize the persistence and contribution of the different sire lineages in current generations, we focused on male calves born during the last 5 years (i.e. 2006 to 2010). Only 30 sire lineages contributed male calves since 2006 (Figure 1a), whereas there were no offspring from 17 sire lineages, which could be extinct from our beef cattle population (36.2%). It is important to highlight that the contribution of the different sire lineages was highly heterogeneous. A unique sire lineage contributed 18% of male calves born during the last 5 years (lineage SLB12), whereas there were 15 minority lineages with a joint contribution of 18% too (each one contributed <3% of male calves; Figure 1a). The remaining sire lineages generated between 3% and 7% of male calves.
Number of records (n), mean and standard error (s.e.) of BWT and WWT for sex, type of birth and age of the dam at calving in the Bruna dels Pirineus beef cattle breed
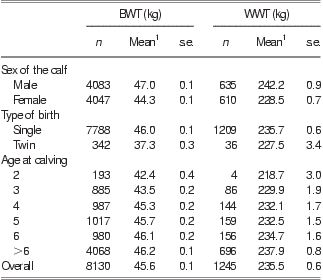
BWT = birth weight; WWT = weaning weight.
1Raw means from phenotypic data.
Sire lineages contributing offspring during the last 5 years (2006 to 2010) and percentage of male calves with phenotypic data for birth weight (a) and weaning weight (b).

In a similar way, the pedigree for WWT included 97 sires, 49 of them contributing calves with phenotypic data. Given that the analyses was restricted to two herds, only 34 sire lineages were identified and 18 of them (52.9%) contributed offspring during the last 5 years (52.9%). Four lineages individually contributed more than one-tenth of male calves (SLW5, SLW6, SLW10 and SLW13) and 50% of the lineages had residual contributions smaller than 3% of the individuals (Figure 1b).
Model comparison
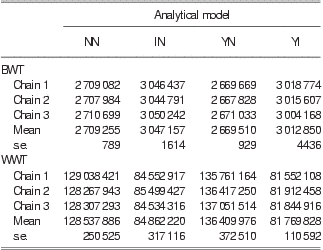
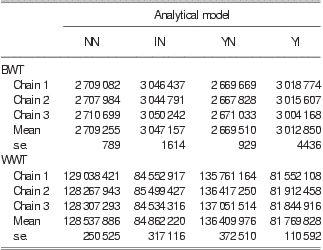
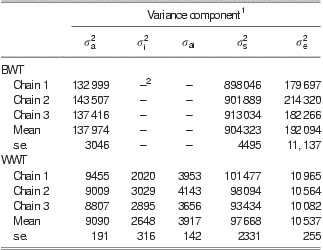
Models were compared by the DIC statistic (Table 2). It is important to highlight that despite launching very long MCMC chains with 5 million iterations there were substantial departures across chains from the same model and phenotypic trait. Nevertheless, this variability did not contradict the final conclusions derived from average DIC estimates. This statistic clearly favored model YN for BWT and left model NN in the second position, with a DIC penalization exceeding 39 000 units. These results suggested that only Y chromosome-related effects could be reported for BWT, whereas there were no statistical evidences of paternal imprinting. On the other hand, model YI was clearly preferred for WWT, suggesting the influence of both sire-related sources of additive genetic variability, Y chromosome effects and paternal imprinting effects. The average DIC estimate for the model YI in the WWT analysis was more than 2.8 million DIC units smaller than any other model implemented for this trait in the current manuscript (Table 2). From now on, estimates from the analysis of BWT and WWT will refer to the ones obtained under models YN and YI, respectively. The effective length of MCMC for genetic and residual variances is shown in Table 3.
DIC for BWT and WWT traits under the four competing models including effects from the Y chromosome (models YI and YN) and paternal imprinting (models YI and IN) or excluding both effects (model NN)
DIC = deviance information criterion; BWT = birth weight; WWT = weaning weight.
Note that three independent Monte Carlo Markov chains were launched for the Bayesian analysis of each analytical model.
Effective chain size for the Bayesian analysis of BWT and WWT under models YN and YI, respectively
BWT = birth weight; WWT = weaning weight.
Note that three independent Monte Carlo Markov chains were launched for the Bayesian analysis of each analytical model.
1 $$)(--><$>\sigma _{a}^{2} <$><!--$$ =additive genetic variance;
 $$)(--><$> \sigma _{i}^{2} <$><!--$$ = paternal imprinting variance;
 $$)(--><$> {{\sigma }_{ai}} <$><!--$$ = covariance between direct and paternal imprinting effects;
 $$)(--><$> \sigma _{s}^{2} <$><!--$$ = Y chromosome variance;
 $$)(--><$> \sigma _{e}^{2} <$><!--$$ = residual variance.
2Note that the model for WWT included both paternal imprinting and the effect of the Y chromosome, whereas the model for BWT did not account for paternal imprinting.
Genetic variance components and sire lineage estimates
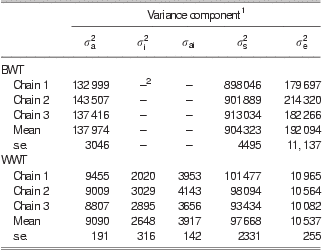
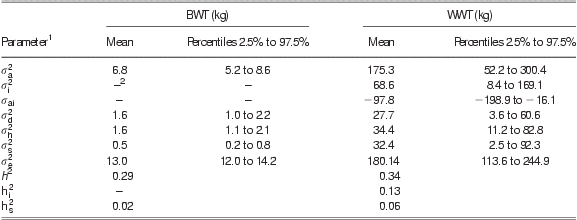
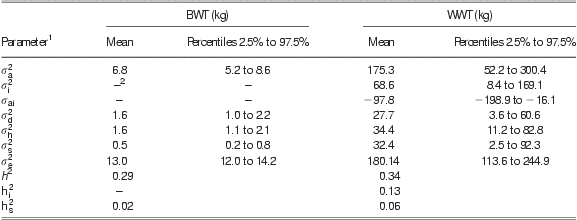
Additive genetic variance components and heritabilities for BWT and WWT were presented in Table 4. Direct heritabilities for BWT and WWT were 0.29 and 0.34, respectively, and paternal imprinting for WWT accounted for ∼13% of the phenotypic variance; note that paternal imprinting was discarded for BWT. Although restricted to WWT, it is important to highlight that the genetic covariance between direct and paternal imprinting effects was −97.8, with a credibility interval (CI; percentiles 2.5% and 97.5%) ranging from −198.9 to −16.1. Note that this covariance led to a negative genetic correlation between direct and parental imprinted effects of −0.89. Moreover, these estimates were statistically relevant, with their CI excluding the null estimate in all cases. Focusing on Y chromosome effects, their variance for BWT was 0.5 kg2, with the CI ranging between 0.2 and 0.8 kg2. These effects generated a variance of 32.4 kg2 in WWT (CI: 2.5 to 92.3 kg2). It is important to highlight that Y chromosome effects accounted for ∼2% of the total phenotypic variance of BWT and ∼6% of WWT. The average estimates for the different sire lineages are shown in Figure 2. There was an important degree of heterogeneity for both traits, with maximum absolute contributions of ∼1 kg for BWT and up to 8 kg for WWT.
Variance components for BWT and WWT in the Bruna dels Pirineus beef cattle
BWT = birth weight; WWT = weaning weight.
1 $$)(--><$>\sigma _{a}^{2} <$><!--$$ = additive genetic variance;
 $$)(--><$> \sigma _{i}^{2} <$><!--$$ = paternal imprinting variance;
 $$)(--><$> {{\sigma }_{ai}} <$><!--$$ = covariance between direct and paternal imprinting effects;
 $$)(--><$> \sigma _{d}^{2} <$><!--$$ = maternal permanent environmental variance;
 $$)(--><$> \sigma _{h}^{2} <$><!--$$ = herd-year-season permanent environmental variance;
 $$)(--><$> \sigma _{s}^{2} <$><!--$$ = Y chromosome variance;
 $$)(--><$> \sigma _{e}^{2} <$><!--$$ = residual variance;
 $$)(--><$> {{h}^2} <$><!--$$ = heritability of the trait;
 $$)(--><$> h_{i}^{2} <$><!--$$ = imprinting effect heritability;
 $$)(--><$> h_{s}^{2} <$><!--$$ = Y chromosome effect heritability.
2Note that the model for WWT included both paternal imprinting and the effect of the Y chromosome, whereas the model for BWT did not account for paternal imprinting.
Average of the posterior distribution of the sire lineage effect for birth weight (a) and weaning weight (b). Black bars highlight sire lineages contributing calves during the last 5 years (2006 to 2010) and white bars are for the remaining sire lineages.

Discussion
Bruna dels Pirineus data set
Analyses were performed on the Bruna dels Pirineus beef cattle breed, which is a representative example of meat-producing cattle population under a Mediterranean extensive production system. This is an autochthonous beef cattle breed reared under a traditional valley-mountain grazing in the Pyrenees Mountains of Catalonia (Northeastern Spain). In order to put into context the Bruna dels Pirineus and to highlight the relevance for the beef cattle industry of the analyses performed in this breed, it is important to link its phenotypic performances with other beef cattle breeds. Average BWT (45.6 kg) and WWT (235.5 kg) were close to ones reported by Casellas and Piedrafita (Reference Casellas and Piedrafita2002) and Quintanilla et al. (Reference Quintanilla, Varona, Pujol and Piedrafita1999) in the same breed and similar to the performances reported in other Spanish beef cattle breeds such as Asturiana de los Valles (Menéndez-Buxadera et al., Reference Menéndez-Buxadera, Carleos, Baro, Villa and Cañón2008) and Pirenaica (Villalba et al., Reference Villalba, Casasús, Sanz, Estany and Revilla2000). Focusing on international and worldwide distributed beef breeds, our weight phenotypes were comparable with the averages reported in Charolais (Mujibi and Crews, Reference Mujibi and Crews2009), Limousin (Tinker et al., Reference Tinker, Frahm and Buchanan1988) and Hereford (Eriksson et al., Reference Eriksson, Näsholm, Johansson and Philipsson2004). It is well known that pedigree losses are usual in extensive beef cattle populations where paternity information can be difficult to register and the acquisition of foreign animals, mainly bulls, becomes common. Nevertheless, our percentage of missing data in the pedigree file was moderate (14.3% for BWT and 16.1% for WWT) and close to the one reported by Golden et al. (Reference Golden, Bourdon and Snelling1994) in the Angus breed.
Several sire lineages were identified to study the impact of the non-autosomal region of the Y chromosome on beef traits. Although 47 sire lineages contributed data to BWT analyses, only 30 of them were present during the last 5 years. In a similar way, only 18 of the 34 original sire lineages for WWT contributed offspring during the last 5-year period (Figure 1). These values suggested the loss of multiple sire lineages, as well as their specific genetic background on BWT and WWT. Both the reduced number of breeding bulls and current selection program for these two weight traits could be the main reasons for this loss of genetic variability in the Bruna dels Pirineus breed. Note that these losses could be of special relevance if they had a substantial and positive effect on the different weight production traits.
Model comparison
Given the potential impact of the model on predicted breeding values and other parameters, making comparisons between candidate models becomes a topic of major interest in research oriented to animal breeding programs. Within this context, the DIC was calculated to elucidate the most appropriate model for BWT and WWT when accounting for sire-specific genetic variances. Average DIC values favored model YN for BWT, suggesting the incidence of Y chromosome effects while discarding paternal imprinting. On the other hand, both Y chromosome and paternal imprinting effects were postulated for WWT given the DIC outcome provided by model YI and competing models (Table 2). Although the inclusion of additive genetic terms (a and i) in the model implied a relevant increase in model parameterization, DIC suggested a sufficient compensation in terms of model fit for WWT data. Note that DIC estimates evidenced substantial departures when comparing independent chains from the same analysis (Table 2), although this variability did not contradict the final conclusions derived from average DIC estimate, and its standard error was smaller than 1% of the average DIC in all cases (Table 2). Moreover, the smallest effective chain lengths for genetic and residual variances were comparables to the values provided by other studies on sire-specific genetic variability in beef cattle (Reinsch et al., Reference Reinsch, Engellandt, Schild and Kalm1999).
In contrast to other studies focusing on traits at adult ages (e.g. Neugebauer et al., Reference Neugebauer, Räder, Schild, Zimmer and Reinsch2010) where the influence of the maternal environment must be almost null, we focused our analyses on weight traits that were clearly influenced by the permanent environment provided by the cow (Quintanilla et al., Reference Quintanilla, Varona, Pujol and Piedrafita1999). Within this context, the current parameterization for paternal imprinting could not be generalized to the maternal component because maternal imprinting and direct maternal effects were confounded and the final model was not identifiable. Indeed, we preferred to accumulate all maternal contributions into the d vector assuming that, if existed, maternal effect through milk and both maternal imprinting and effects from the mitochondrial DNA would accumulate there (Neugebauer et al., Reference Neugebauer, Räder, Schild, Zimmer and Reinsch2010).
Variance components and sire lineage estimates
The analysis of BWT revealed that ∼2% of the phenotypic variance was accounted for by  $$)(--><$>\sigma _{s}^{2} <$><!--$$, whereas this percentage increased up to ∼6% for WWT. These results partially agreed with those reported by Engellandt and Tier (Reference Engellandt and Tier2002) and Neugebauer et al. (Reference Neugebauer, Räder, Schild, Zimmer and Reinsch2010) in Gelbvieh and Simmental cattle, respectively, although contradictory results were also available (Reinsch et al., Reference Reinsch, Engellandt, Schild and Kalm1999). The influence of the Y chromosome was previously highlighted by Kieffer and Cartwright (Reference Kieffer and Cartwright1968) and Schoeman (Reference Schoeman1989), who reported that even the morphology of this chromosome (i.e. acrocentric v. submetacentric) was associated with variations in the BWT of Brahman, Angus and Tuli calves. Note that Bos taurus and Bos indicus trunks differed in the Y chromosome, which is submetacentric and acrocentric, respectively (Potter and Upton, Reference Potter and Upton1979). Nevertheless, Bruna dels Pirineus breed must be free from genetic influences from the B. indicus bovine trunk. As a consequence,
 $$)(--><$>\sigma _{s}^{2} <$><!--$$ should not be related to the shape of the Y chromosome but to polymorphisms located on the non-psuedo-autosomal region of the Y chromosome, as suggested by Maxon (Reference Maxon1990) and Bünger et al. (Reference Bünger, Renne, Dietl and Pirchner1995) in other mammalian species. In laboratory species, Maxon (Reference Maxon1990) and Sluyter et al. (Reference Sluyter, Van Oortmerssen, De Ruiter and Koolhass1996) found influences due to the Y chromosome on the aggressive behavior and Bünger et al. (Reference Bünger, Renne, Dietl and Pirchner1995) described influences on growth.
The effect of each sire lineage in the Bruna dels Pirineus population was shown in Figure 2. Note that black bars characterized sire lineages contributing offspring during the last 5 years, whereas white bars showed probably extinct sire lineages. While discarding these non-contributing sire lineages, it is important to highlight the heterogeneity inherent to the different sire lineage effects (Figure 2). These estimates must be viewed as a direct contribution for the Bruna dels Pirineus breeding scheme in which higher BWT is prevented because the incidence of dystocia and sires contributing average and smaller BWTs becomes preferable (VanRaden and Klaaskate, Reference VanRaden and Klaaskate1993), mainly for heifers. In a similar way, sire lineages for WWT also revealed a substantial degree of heterogeneity, providing a new and relevant source of genetic variability for the selection program.
Paternal imprinting effects were discarded for BWT, whereas they accounted for ∼13% of the phenotypic variance for WWT. Note that we lack comparable results about the possibility of imprinting at early ages, whereas results from the WWT analysis would be comparable to the significant imprinting variances reported by Engellandt and Tier (Reference Engellandt and Tier2002) and Neugebauer et al. (Reference Neugebauer, Räder, Schild, Zimmer and Reinsch2010) on fatness and carcass traits at older ages. Indeed, one of the main examples of paternally imprinted genes in livestock is the Igf2, which is systematically linked to muscle mass and fat deposition (Jeon et al., Reference Jeon, Carlborg, Törnsten, Giuffra, Amarger, Lundström and Andersson1999; Nezer et al., Reference Nezer, Moreau, Brouwers, Coppieters, Detilleux, Hanset, Karim, Kvasz, Leroy and Georges1999); note that fat is scarce at birth and the deposition of both tissues increases with age during the growing period, with Igf2 being typically associated with carcass traits at older ages (Goodall and Schmutz, Reference Goodall and Schmutz2007). Although there are no evidences of segregating Igf2 polymorphisms in the Bruna dels Pirineus breed, this kind of biological backgrounds could be a suitable example for the differential contribution of paternal imprinting at birth and at weaning.
Conclusions and final remarks
In order to assess the relevance of sire-specific genetic variability on productive traits of interest for the beef industry, the contribution of both paternal imprinting and the Y chromosome was analyzed on weight traits in the Bruna dels Pirineus breed. Both sources of genetic variability contributed relevant genetic variability with the only exception of paternal imprinting on BWT. Indeed, ∼19% of the phenotypic variance for WWT was accounted for by these sire-specific effects that must be addressed in further genetic evaluations. These results allow for a better characterization of the genetic background of weight traits in beef cattle and must be viewed as an appealing starting point to decipher the genetic architecture of these imprinting and Y chromosome effects. Moreover, they must be accounted for in the current breeding scheme of the Bruna dels Pirineus beef cattle breed.
Acknowledgments
This research was supported by a contract with the Departament d'Agricultura, Ramaderia, Pesca, Alimentació i Medi Rural of the Generalitat de Catalunya (Barcelona, Spain). The authors are indebted to FEBRUPI associates for their collaboration during data collection. The research contract of J. Casellas was partially funded by the Ministerio de Ciencia e Innovación of the Spain's government (reference RYC-2009-04049).