Introduction
In this article we analyze the evolution of interpersonal violence in Chile from the 1880s to the 2010s, taking as a proxy the rate of homicides.Footnote 1 Interpersonal violence is an important indicator of a society’s well-being (Baten et al. Reference Baten, Bierman, Foldvari, Van Zanden, Van Zanden, Jörg Baten, Rijpma, Smith and Timmer2014; OECD 2011), and it is typically developing countries that lack data on welfare before the 1950s. Interpersonal violence is an important variable to assess economic development because in highly violent societies, social capital is typically lower, while higher rates of violence are often associated with lower human capitalFootnote 2 (Gust and Baten Reference Gust and Baten2019). Highly violent societies allocate resources for conflict resolution rather than for public provision, and are characterized by mistrust and uncertainty. Violent crime impacts negatively and directly on quality of life because it reduces personal safety and property security. These factors damage economic development (Fajnzylber et al. Reference Fajnzylber, Lederman and Loayza1998, Reference Fajnzylber, Lederman and Loayza2002b; Gust and Baten Reference Gust and Baten2019). More importantly, personal security reflects another crucial component of well-being: well-being is higher if people do not fear becoming victims of crime, in particular of a serious crime such as homicide. Feeling insecure limits daily activities and functioning: fear of violent crime is as important as crime itself (Baten et al. Reference Baten, Bierman, Foldvari, Van Zanden, Van Zanden, Jörg Baten, Rijpma, Smith and Timmer2014; OECD 2011).
One negative consequence of higher interpersonal violence is that gender inequality increases, leading to less female autonomy (Gust and Baten Reference Gust and Baten2019). Homicide rates are also important because they are usually negatively correlated with GDP per capita—the richer a country, the lower the level of homicides, although there are important exceptions, such as the United States (a rich country with high homicide rates) or Nigeria (the opposite to the United States), which means that in some cases personal security has a limited influence on economic growth (Baten et al. Reference Baten, Bierman, Foldvari, Van Zanden, Van Zanden, Jörg Baten, Rijpma, Smith and Timmer2014).Footnote 3
Thus, our aim in this article is to analyze how the rate of intentional homicide has varied over time in Chile and to identify the main reasons for these changes. When analyzing secular trends in homicides, a broader perspective is needed, taking into account a wide range of variables, such as changes in the social structures of power, legislation, mentality, age composition of the population, and cultural and economic conditions such as income inequality and poverty rates (Eisner Reference Eisner, Heitmeyer and Hagan2003b; Gurr Reference Gurr1981; Mares Reference Mares2009).
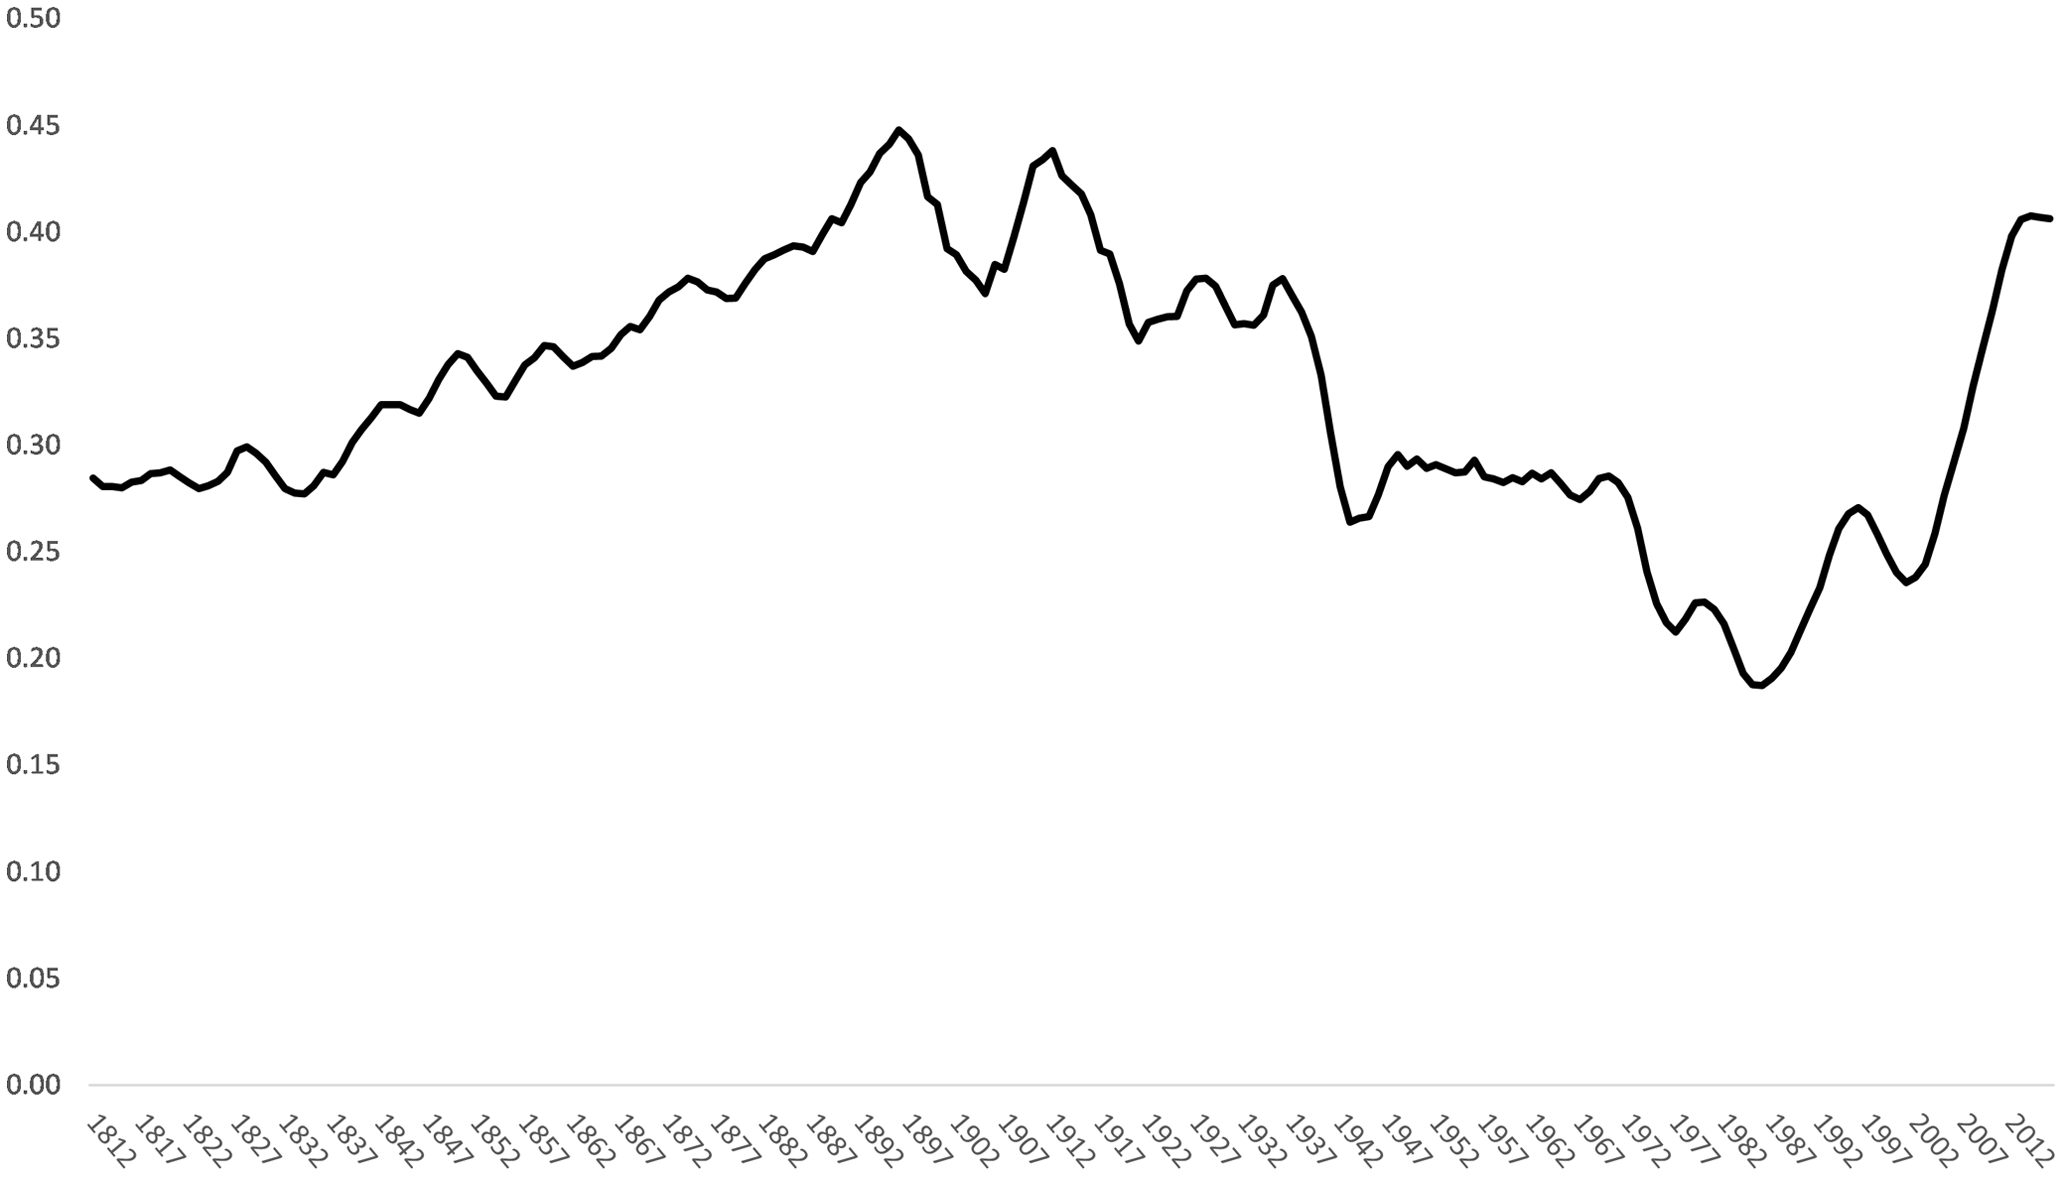
We also wanted to compare the Chilean experience to that of the countries enjoying the lowest homicide rates in the world, as well as analyzing Chile’s position within Latin America. Although there is an important body of literature on violent crime in developed Western societies from the medieval period onward (e.g., Baten et al. Reference Baten, Bierman, Foldvari, Van Zanden, Van Zanden, Jörg Baten, Rijpma, Smith and Timmer2014; Eisner Reference Eisner2003a, Reference Eisner2008, Reference Eisner2011, Reference Eisner, Kortüm and Heinze2013; Gurr Reference Gurr1981, Reference Gurr and Gurr1989; Mares Reference Mares2009; Roth Reference Roth2001, Reference Roth2011; Thome Reference Thome2001), and despite the advances made by social science historians in our understanding of patterns in the history of homicide rates, some countries, such as Chile, have been largely ignored. Chile in turn has many peculiarities that deserve a study on its own. For example, most criminological research has focused on the increase in violent crime from the second half of the twentieth century onward, neglecting earlier periods (Mares Reference Mares2009), while also neglecting those countries that did not experience an increase in violent crime from the 1960s (like Chile). Chile, in turn, is a very unequal society but interpersonal violence is low, which is puzzling. Likewise, some authors have tried to connect the evolution of interpersonal violence to the timing of the Great Divergence (Gust and Baten Reference Gust and Baten2019). Yet, in the case of Chile, from independence in the 1810s until the end of the nineteenth century, Chilean per capita GDP converged toward the levels of the United Kingdom and the United States, but homicide rates remained high during this period. Furthermore, this per capita GDP convergence process was truncated, which seems to be the fate of all Latin American countries. Most of the twentieth century is best described as a divergence period, until the 1990s, when a new convergence trend started (figure 1). However, when Chile’s per capita GDP diverged from that of the leading world economies, its homicide rates improved, at least during the 1940s–1960s. All in all, the evolution of homicides rates in Chile does not add meaningful evidence to the timing of the Great Divergence. It would be, therefore, useful to fill in these blank spaces (Baten et al. Reference Baten, Bierman, Foldvari, Van Zanden, Van Zanden, Jörg Baten, Rijpma, Smith and Timmer2014; Eisner Reference Eisner2003a).
Ratio of Chilean per capita GDP to US per capita GDP, 5-year moving average, 1812–2014. Source: Own elaboration from Maddison Project Database, version 2018. Bolt et al. (2018), “Rebasing ‘Maddison’: New Income Comparisons and the Shape of Long-Run Economic Development.”

The rate of homicides per 100,000 inhabitants is an important indicator of economic development in and of itself, and its long-term evolution and key determinants are worthy of analysis. It is also relevant to compare it with the evolution of other variables such as per capita GDP, despite the shortcomings previously mentioned. Chile enjoys one of the lowest homicide rates within Latin America, combined with the highest GDP per capita, although the highest global homicide rates are recorded in Latin America (Fajnzylber et al. Reference Fajnzylber, Lederman and Loayza1998, Reference Fajnzylber, Lederman and Loayza2002a; OECD 2011). Furthermore, even though global crime rates have been increasing since the 1960s–1970s (Fajnzylber et al. Reference Fajnzylber, Lederman and Loayza1998; Gurr Reference Gurr1981; Thome Reference Thome2001),Footnote 4 in Chile they have remained stable or declined during the 1970s, 1980s, and 1990s; Argentina is the only other South American country where homicides rates have declined during recent decades, although there was no accompanying increase in GDP.
Building on previous works by Fajnzylber et al. (Reference Fajnzylber, Lederman and Loayza1998, Reference Fajnzylber, Lederman and Loayza2002a) and Baten et al. (Reference Baten, Bierman, Foldvari, Van Zanden, Van Zanden, Jörg Baten, Rijpma, Smith and Timmer2014), we have also analyzed the evolution of some explanatory variables usually associated with violent crime: income inequality (measured through the Gini index),Footnote 5 poverty rates,Footnote 6 penalties associated with committing violent crimes (e.g., the death penalty),Footnote 7 availability of police in the country (i.e., number of police personnel per 100,000 inhabitants), average number of years of schooling (as a measure of human capital), the growth of GDP (as a proxy for employment and economic opportunities in general), percentage of young males in the population, as the rate of participation in crime for males within this age range is higher than for any other group (we used two ranges, those aged 15–29 and those aged 20–34),Footnote 8 and the rate of urbanization.Footnote 9 We have correlated these variables with the rate of homicides per 100,000 inhabitants.
We have also complemented our data on homicides per 100,000 inhabitants with three other violent death variables. First, inspired by those colleagues who have collected data on regicide (e.g., Eisner Reference Eisner2011; Gust and Baten Reference Gust and Baten2019), we collected data on what could be called “elite homicides,” taking as a proxy homicides of high-profile public servants (or former public servants) and other famous politicians. Because Chile is not a monarchy, we collected data on homicides of current (or former) presidents, members of parliaments, ministers, high-ranking civil servants, and high-ranking military officers. Elite homicide is another indicator of the rate of violent crime in a society, therefore checking its frequency and how it has changed over time is a valuable enterprise (Eisner Reference Eisner2011).
Second, we also collected data on deaths from military conflicts, as some of the underlying causes of wars, such as the polarization of society, are the same as those applied to “ordinary” or apolitical violent crime (Fajnzylber et al. Reference Fajnzylber, Lederman and Loayza2002a). Wars pose important threats to personal security or the perception of it (Baten et al. Reference Baten, Bierman, Foldvari, Van Zanden, Van Zanden, Jörg Baten, Rijpma, Smith and Timmer2014), one of the most important variables. Civil wars have been detrimental to the growth of per capita GDP, in particular during the last half century (ibid.). Third, we collected data on deaths following periods of social unrest or workers’ strikes in Chile.
This article is divided into four more sections. First sources and methodology are discussed. Then the general trends of homicide rates in Chile from the late 1880s to the late 2010s (at a national and provincial level) are analyzed, followed by a regression analysis of some determinants of homicide rates.
Sources and Methodology
We have taken as a proxy of interpersonal violence the rate of intentional homicides per 100,000 inhabitants, a standard procedure in the literature. Intentional homicide is usually defined as an unlawful death deliberately inflicted on one person by another person, excluding casualties from interstate wars’ and civil wars (Baten et al. Reference Baten, Bierman, Foldvari, Van Zanden, Van Zanden, Jörg Baten, Rijpma, Smith and Timmer2014; Cantor and Cohen Reference Cantor and Cohen1980; Eisner Reference Eisner2008; OECD 2011).Footnote 10 Why the reliance on homicide rates? When assessing personal security in a country, the rate of homicides is usually preferred to alternative crimes such as robberies because data on robberies is less reliable than data on homicides: a large portion of robberies are neither reported nor recorded (Fajnzylber et al. Reference Fajnzylber, Lederman and Loayza2002a; Gurr Reference Gurr1981; Mares Reference Mares2009; OECD 2011). Other serious crimes such as sexual violence or violence against children are also underreported.
In contrast, because it is (arguably) the most serious of all crimes, intentional homicide is the crime that is most effectively recorded in most countries (Eisner Reference Eisner, Heitmeyer and Hagan2003b; Gurr Reference Gurr1981; Monkkonen Reference Monkkonen2005; United Nations 2010). Homicide statistics suffer less from underreporting than robberies because corpses are more difficult to ignore than loss of property; homicides are less likely to go undetected (Fajnzylber et al. Reference Fajnzylber, Lederman and Loayza2002b; Mares Reference Mares2009); and less prone to statistical manipulation given the grievous nature of the crime (Cantor and Cohen Reference Cantor and Cohen1980).Footnote 11 Homicides are also better recorded than other alternative measures of interpersonal violence such as violence against children or intimate partner violence. There is general agreement that homicide records are perhaps the only crime figure that provide a consistently accurate measure of serious crime levels (Gurr Reference Gurr1981; OECD 2011), and that allow us to conduct comparative analysis across countries and over long periods (Eisner Reference Eisner, Heitmeyer and Hagan2003b, Reference Eisner2008). Homicide, as a crime, has always attracted attention from all institutions of power in all societies, while its significance (for authorities) has remained stable over the course of the last centuries (Eisner Reference Eisner, Heitmeyer and Hagan2003b).
Homicide is also preferred to other variables of interpersonal violence because it has more severe and long-lasting negative effects on well-being (OECD 2011). Furthermore, it is well defined, enjoying a lower degree of measurement error, and it is highly correlated with other violent crimes, especially as far as long-term trends are concerned (Eisner Reference Eisner2008). For example, there is a strong correlation between the rate of homicides and the rate of people who have reported being assaulted (Baten et al. Reference Baten, Bierman, Foldvari, Van Zanden, Van Zanden, Jörg Baten, Rijpma, Smith and Timmer2014; OECD 2011). For Eisner (Reference Eisner, Heitmeyer and Hagan2003b), homicides are the only form of interpersonal violence for which meaningful judgments on long-term developments can be made. Perhaps the only drawback to using homicide statistics is that there are often low rates of homicide in society, but that is why it is expressed as a rate per 100,000 inhabitants (OECD 2011).
To produce the series of homicides in Chile we have used two major sources. First, from 1911 onward, the number of homicides in Chile have been available from the Institute of National Statistics (a printed source), which provides annual counts of homicides, based on causes of death statistics, better known as mortality statistics.Footnote 12 They are based on information provided by the National Register Office, which in turn is based on death certificates, usually provided by medical examiners. Statistics on causes of death are the best way of making comparisons across countries because they are based on standardized classifications of medically confirmed causes of death (Eisner Reference Eisner, Heitmeyer and Hagan2003b).
Second, for the period before 1911, we collected the same information, but directly from the death record books at the National Register Office of Chile, which are available for the whole country from 1887 only,Footnote 13 also based on death certificates or causes of death statistics provided by civil servants, and verified by doctors or witnesses. This information is available in manuscripts, rather than printed texts. The main difficulty of working with this type of source relates to the nature of the certificates, which were mostly provided by witnesses, resulting in a wide variety of causes of death. However, because we wanted to identify intentional homicides, the description provided by witnesses did not pose a problem.Footnote 14 In addition to the deaths explicitly recorded as “homicide” and “murder,” we also included those clearly identifiable cases of unlawful death deliberately inflicted on one person by another between 1887 and 1908. For example, we included cases in which a victim was “stabbed to death.” To the best of our knowledge, we are the first research team to have been given access to the death records of Chile from 1887 to 1910, after signing a confidentiality agreement (not to disclose information on any particular case). Approximately 1.3 million files containing all deaths in Chile from 1887 to 1910 were consulted, to identify all homicides (around 5,700 for the years we entered the data).
To complete our homicide rates per 100,000 inhabitants, population data was obtained from Díaz et al. Reference Díaz, Lüders and Wagner2016, the most trustworthy source for this variable on an annual basis because it relies on extrapolated official census data. Because accurate population data is needed for reliable estimates of homicide rates (Gurr Reference Gurr1981), it is worth stressing that Chile was a pioneer Latin American country in the compilation of national statistics, from the early nineteenth century onward (Estefane Reference Estefane2004, Reference Estefane2019). The first full national census was taken in 1835, and from then on censuses were taken regularly almost every 10 years. Despite the usual problems and drawbacks of any census, Chilean demographic data is regarded as high quality. From the second half of the century onward, there was centralized data collection for all censuses, following the creation of the National Statistics Centre in 1843, which improved the quality and coverage of the data. From 1907 in particular, further improvements were introduced (Loveman Reference Loveman2014; Pérez Reference Pérez2010; Ventresca Reference Ventresca1995).
Other type of sources used to collect data on homicides are police statistics, conviction statistics, and judicial statistics, although the most reliable are the ones used here: mortality statistics (Eisner Reference Eisner2008; Baten et al. Reference Baten, Bierman, Foldvari, Van Zanden, Van Zanden, Jörg Baten, Rijpma, Smith and Timmer2014). There was no available data from conviction records in Chile, except for the period 1880–86 (Oficina Central de Estadísticas, 1880–88), which we used to complete our series on mortality statistics from the beginning of that decade, and which were close to the data based on mortality rates for the rest of the 1880s.Footnote 15 We accepted them as good quality; excluding them would not have changed our conclusions. Police statistics were also elusive, while judicial records are incomplete for the period before 1880 (these are available only for certain locations), so we preferred not to use them (on the difficulties of working with criminal proceedings files, see Eisner Reference Eisner, Heitmeyer and Hagan2003b).Footnote 16 Additionally, searches within manuscript judicial records are extremely time consuming.
Data on elite homicides, deaths by agents of the state during periods of social unrest or workers’ strikes, and deaths from military conflicts were obtained from a careful review of relevant secondary published works. Data on robberies (only used to test its correlation with homicides) was gathered from the UN World Crime Surveys from 1970 and for earlier periods from Chile’s Attorney General.Footnote 17 From Díaz et al. (Reference Díaz, Lüders and Wagner2016) came the series on average numbers of years of schooling, GDP growth rates and urbanization rates, while income inequality was taken from Rodríguez Reference Rodríguez2017. The poverty rate was taken from Prados de la Escosura (Reference Prados de la Escosura, Hatton, O’Rourke and Taylor2007) and the World Bank (for the most recent years), while police numbers came from the same UN World Crime Surveys and other national official sources, such as the Statistical Yearbook of the Office of National Statistics. The age structure of the population was obtained from the censuses of the republic and the demographic yearbooks.
When assessing the evolution of homicide rates across long periods, and across regions, it is important to be aware of potentially distorting factors. First, consider improvements in medical knowledge, which Eisner has defined as technologies of healing. Why is this important? Many of those who died from a wound before the twentieth century could have been saved with modern medical technology, including the increased use of antibiotics from the 1940s onward (Eisner Reference Eisner2003a, Reference Eisner2008; OECD 2011). Improvements in transport and communications, which reduced the time until an emergency team attended, also reduced the lethality of violence during the twentieth century (Baten et al. Reference Baten, Bierman, Foldvari, Van Zanden, Van Zanden, Jörg Baten, Rijpma, Smith and Timmer2014; Eisner Reference Eisner2008). These changes affected urban and rural areas in different ways. However, modern weapons are increasingly dangerous (OECD 2011).Footnote 18 This factor has led to what Eisner (Reference Eisner2008) has defined as improvements in technologies of killing. Technologies of healing and technologies of killing do affect homicide trends in the long run, although it is difficult to estimate the precise net impact.
This article is the first academic work to analyse the evolution of intentional homicides in Chile. Previous important works have dealt with social and political violence in Chile, in particular for the twentieth century.Footnote 19 There are also some relevant general works on crime and criminology in Chile.Footnote 20 Yet, despite the importance of these works, none of them has provided a comprehensive approach to the evolution of interpersonal violence for a sustained period.
General Trends in Homicide Rates in Chile, 1880s–2010s
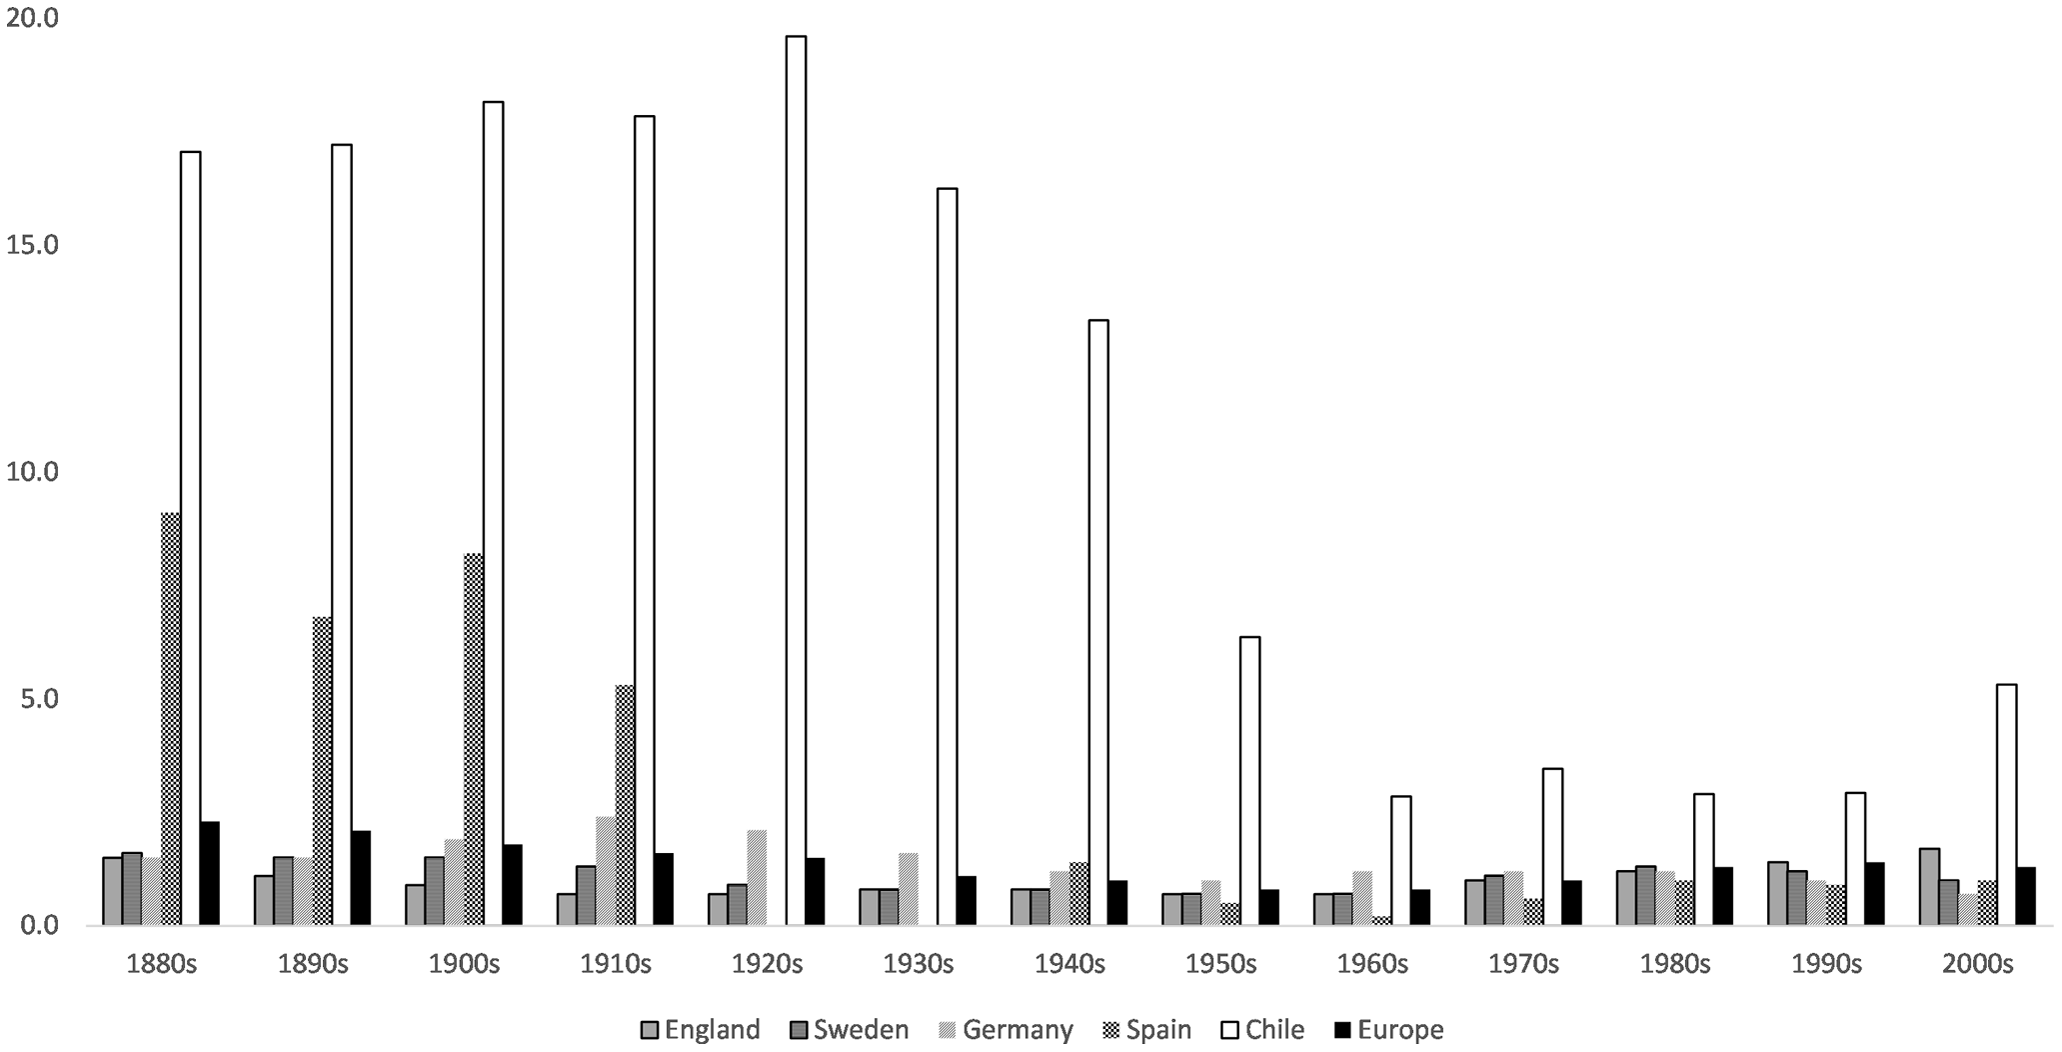
We have produced a 140-year series on homicide for Chile, adding around 75 years to the previously available series from the Clio Infra Project,Footnote 21 thus making an important contribution to the study of trends in interpersonal violence in Chile. What did we find? In decadal annual averages, the number of homicides per 100,000 inhabitants in Chile was high during the late nineteenth century and the early decades of the twentieth century (between 16 and 19 between the 1880s and the 1930s), with an increasing trend between the 1880s and the 1920s, as seen in figure 2. These high rates were slightly below the homicide rates in the notably violent environment of medieval England and at a similar level to those of the Netherlands in the sixteenth century (Eisner Reference Eisner, Heitmeyer and Hagan2003b).
Average homicide rates in Chile and selected European countries, 1880s–2000s. Source: Authors for Chile data; Eisner (Reference Eisner2008) for all others.

Yet, if these figures are put into international perspective, the equivalent ratio in Western Europe (by now a society characterized by low levels of interpersonal violence) was 2.5 and 2.4 for the last two decades of the nineteenth century (Baten et al. Reference Baten, Bierman, Foldvari, Van Zanden, Van Zanden, Jörg Baten, Rijpma, Smith and Timmer2014). By the early 1880s, most countries in Western Europe already had low homicide levels (Eisner Reference Eisner2008): the transition to a less violent society had been made.Footnote 22 Chilean society, however, remained subject to widespread violence.
It took some time for Chilean society to change: the “civilizing process” referred to by Elias, Spierenburg, Thome, Eisner, Mares, and other authors trying to explain the downward trend in homicide rates in Western Europe, belatedly arrived in Latin America.Footnote 23 Chilean homicide rates remained high during the 1880s–1920s, declining moderately during the 1930s. However, in the 1940s they declined to 13.3, and the 1950s witnessed the most dramatic decline in homicide rates in Chile; the rate of the previous decade was more than halved; there were 4.9 homicides per 100,000 inhabitants, a rate comparable to that in the United States at the time (Mares Reference Mares2009). During the 1960s this ratio nearly halved again, reaching 2.7, and remained at a similar level until the 1990s.Footnote 24
By the 1990s Chile had reached low levels of homicide by international standards, even if compared to developed nations. Between the 1930s and the 1960s Chilean homicide rates converged with the average levels in Europe, which had the lowest global homicide levels. In the 1920s homicide rates in Chile were 12 times higher than in Europe; during the 1980s–1990s they were only slightly more than twice as high. Homicide rates have increased during the last two decades (slightly above 4 per 100,000 inhabitants during the 2000s–2010s).
This increase may be due to the rise of organized crime and to the increase in drug trafficking in Chile. The average ratio of drug offenses (per 100,000 people) increased from 12 and 16 in the 1980s and 1990s, respectively, to 60 and nearly 120 in the 2000s and 2010s, respectively. There is also a perception of growing disparity between the rich and the poor, as the October 2019 riots have evidenced, leading to a decline in the legitimacy of the state, which often triggers violence (Mares Reference Mares2009). This was a period when the macro-economy did well, but the lower strata of society felt more frustrated. In such a situation, people are more likely to commit violent acts because the poorest become increasingly aware of their low status and their lack of social mobility (Gurr Reference Gurr1981).
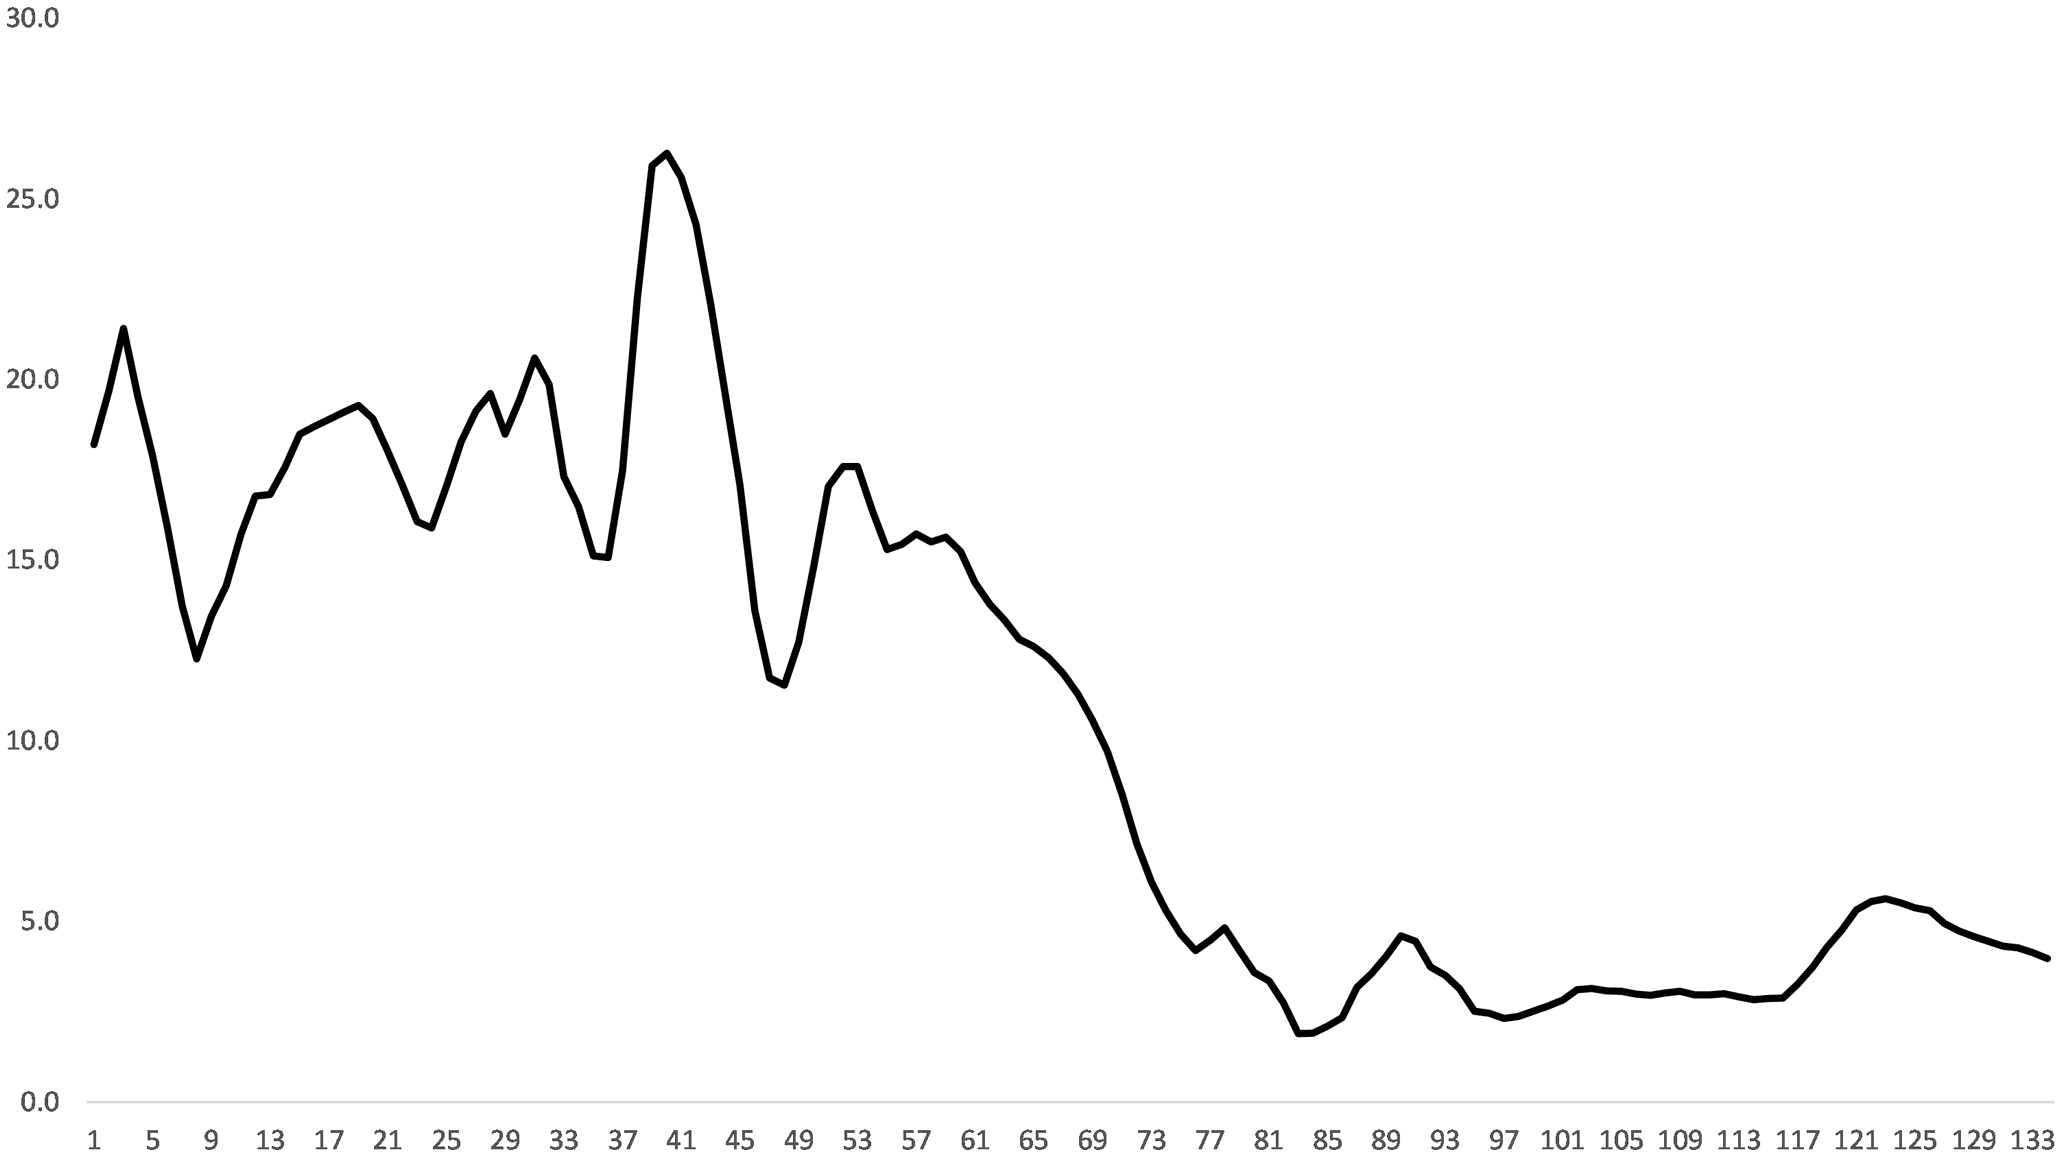
The annual series in five-year moving averagesFootnote 25 shows that the lowest level of homicide rates in Chile was achieved during the mid-1960s, and for a few years the rate fell below 2.0 (figure 3).Footnote 26 As a reference point, that figure is roughly the current average of OECD countries (OECD 2011), while the lowest worldwide level of interpersonal lethal violence was attained during the 1950s by some Western European countries, at about 0.4–0.6 homicides per 100,000 inhabitants (Eisner Reference Eisner2003a).
Number of homicides per 100,000 inhabitants: Chile, 1880–2017 (5-year moving average). Source: Authors.

The transition toward low crime rates started in Chile comparatively late, in the early 1940s (figure 2). Developed countries such as the United Kingdom achieved similar rates in the second half of the eighteenth century, while Germany, the Netherlands, Belgium, and Switzerland followed suit during the earlier part of the nineteenth century. From the 1840s in particular, there was a sustained decline in criminal violence across Europe (Eisner Reference Eisner2003a, Reference Eisner2008), a century earlier than in Chile. In some southern European countries this process took longer, but, by the early 1940s, even countries such as Spain, which clearly lagged behind the European average, already had homicide rates below 2 (figure 2).
What needs explanation here is why homicide rates declined so significantly in Chile during the 1930s–1960s, and then again during the 1980s and 1990s. Chile was a special case; Eisner (Reference Eisner, Heitmeyer and Hagan2003b) found “an almost universal increase in homicide rates from the late 1950s to the early 1990s,” while for most of this period Chile’s homicide rates were declining or, at worst, remained stagnant. In the following section we document the results of regression conditioning on some important quantitative variables available to us. We regress homicide rates against some of these variables. There are other important variables that may be nonmetric, may not be statistic, and may not be linear, but that are equally important (Thome Reference Thome1995).
Following Mares (Reference Mares2009) and Thome (Reference Thome1995), it is important to look at the economic development of the country and at changes of large scale social structures during this period. The 1930s–1960s coincides with the period of inward looking development, or industrialization led by the state (Bértola and Ocampo Reference Bértola and Ocampo2012). There was a profound economic change in the country, characterized by greater intervention by the state in economic affairs, increasing investments in public works, and the promotion of national industrialization. State institutions grew in number, while many policies of social incorporation were promoted, leading to the emergence of a welfare state (Arellano Reference Arellano1985). The poverty rate of the country declined from 52 percent in the 1920s to 32 percent in the 1960s. The governmental social expenditure in per capita (real) terms increased nearly fivefold between the 1920s and the 1960s, while social mobility improved. Education and health care also improved; the average number of years children spent in school increased from 6.3 in the 1920s to more than 9 by the early 1970s. These changes probably triggered a greater degree of restraint in interpersonal behavior, lowering interpersonal violence and promoting internal pacification.
Another related development is the evolution of suffrage. Historians of crime should pay attention not only to the process of state modernization but also to the process of democratization of the country under analysis (Thome Reference Thome1995). In Chile between the 1810s and the 1870s, only a minority of the population was able to vote, while the government controlled most elections. In 1842, for example, only 2 percent of the population was able to vote (Urzúa Reference Urzúa1992; Valenzuela and Valenzuela Reference Valenzuela and Valenzuela1983).Footnote 27 During the 1880s and 1890s some reforms were introduced (increasing the share of the population able to vote), but electoral fraud persisted and political power remained within the same hands. The 1920s and 1930s brought about a radical change. The franchise was extended; women were now able to vote (from 1934 in the council elections, and from 1949 in all elections), while new political parties emerged, including the socialist and communist parties. In 1932 only 7 percent of the population voted; by 1973 more than a third did so (Campos Reference Campos1984). So important was this transformation that according to Valenzuela and Valenzuela (Reference Valenzuela and Valenzuela1983), by the 1960s Chile was one of the most democratic countries on earth, despite being a developing nation. This is important because when the state transfers some power back to citizens, fostering political legitimacy, interpersonal violence decreases: the state monopoly of force gains further legitimacy (Mares Reference Mares2009). This process was taking place when homicide rates were declining most sharply in Chile.
The rise of bureaucratic state structures is also linked with a decline in violence because the state is regarded as a pacifying institution, which monopolizes violence (Baten et al. Reference Baten, Bierman, Foldvari, Van Zanden, Van Zanden, Jörg Baten, Rijpma, Smith and Timmer2014; Eisner Reference Eisner2003a). Societies that experience a modernization process are less prone to high levels of criminality (Thome Reference Thome1995). In Chile from the late nineteenth century onward there emerged a strong bureaucratic state structure that encompassed the modernization of legal institutions, the reform of ministries, the creation of a modern prison system, the emergence of social security, the ordering of public finances, and general improvement in the regulation of social activities. These institutions were further improved during the following decades. Carabineros de Chile (the national police force) was created in 1927 and modernized thereafter (Barría Reference Barría2015; Cleaves Reference Cleaves1974; Faúndez Reference Faúndez2007; Henríquez Reference Henríquez2014; Islas Reference Islas2017; López Reference López2013, Reference López, Jaksic and Rengifo2017; Silva Reference Silva2008; Urzúa Reference Urzúa1970; Urzúa and García Reference Urzúa and García1971).
Another variable worth examining is the country’s level of alcoholism, and in particular the state’s attempts to decrease it. It has been widely established that alcohol consumption is one of the main determinants of crime. It is believed that both drugs and alcohol fuel violent crime and higher levels of interpersonal violence in general (Cea et al. Reference Cea, Ruiz and Matus2006; Ensor and Godfrey Reference Ensor and Godfrey1993; Gerson and Preston Reference Gerson and Preston1979; Lightowlers et al. Reference Lightowlers, Pina-Sánchez and McLaughlin2021; Murdoch and Ross Reference Murdoch and Ross1990). Alcohol consumption has been used as an important predictor of violent crime (Saridakis Reference Saridakis2004, Reference Saridakis2011). A study by Fundación Paz Ciudadana (1999) has shown that 59 percent of murderers in Chile consumed alcohol before committing homicide. Therefore, lower rates of alcohol consumption lead to a reduction in aggressive behavior; the adoption of humanistic values leads to less interpersonal violence.
For Chile in particular, during the late nineteenth century and early twentieth century many contemporaries linked the high consumption of alcohol to high levels of criminality in the country (in particular to homicides): most criminals were either alcoholics or were drunk when committing a serious crime. Alcoholism was perceived as a “social plague,” exacerbating violent behavior (Revista Médica de Chile Reference Médica de Chile1892; Zilleruelo Reference Zilleruelo1909). The year 1902 saw the passing of the first Alcohol Law to regulate taxation and consumption. Its aim was to increase alcohol prices to lower consumption, and at the same time to increase fiscal revenues, part of which went to finance campaigns against alcoholism (Fernández Reference Fernández2006). Subsequently, all presidents of the republic have announced other measures to combat alcoholism in Chile, including the construction of sports facilities, gyms, and cultural establishments, in particular in low-income neighborhoods (ibid.).
Salvador Allende, appointed minister of health in 1939, was an early and eloquent voice in the campaign against alcoholism. The government of the 1930s was one of the first to understand the importance of treating alcoholism as a serious social disease, that needed an integral and holistic treatment, rather than seeing it solely as a public order issue, as previous governments had done. The Ministry of Health implemented several policies to tackle alcoholism, aiming to improve the country’s human capital, social stability, and general well-being, and these helped to reduce the rate of homicide. However, this is a topic that calls for further research. There are many substantial gaps in the data on per capita alcohol consumption in Chile, for example.
We also wanted to provide a chronology of death penalty legislation in Chile, given the acknowledged deterrent effect of capital punishment on murder (Cantor and Cohen Reference Cantor and Cohen1980), and of the legislation on homicides. In Chile, the death penalty was established in 1874, when the first penal code of the country was promulgated; it applied to homicides, parricides, and infanticides.Footnote 28 In the case of parricide, its application was automatic. In the case of other homicides, the minimum penalty was 10 years in prison, and the maximum the death penalty. Yet, it took a decade and a half before the death penalty was first applied in Chile, in 1890. Capital punishment has never been widely implemented in Chile; although it remained legal for more than a century, until 2001Footnote 29 (the last execution was in 1985).
Some changes were made to the penalties for homicide between 1874 and 2001. While the death penalty had previously been automatically awarded for parricide, in 1970 the sentencing options were changed to between 15 and 20 years of jail as a minimum or the death penalty as a maximum; in the same year, the highest penalty for homicide was changed from execution to a life sentence, which after 20 years could be waived, while the minimum penalty was between 10 and 15 years of jail. Between 1890 and 1985 the death penalty was applied only 57 times (Baeza Reference Baeza2016),Footnote 30 roughly once every two years. Although it was in operation for almost the whole of our period of study, for the next section we created a dummy variable for the period when the death penalty was applied to most homicides, 1890–1969 (excluding parricides); and another for 1890–1985 (including parricides), rather than for the entire period it was legal (1875–2001). Whether the abolition of the death penalty in 2001 contributed to the rising homicide rates of the last two decades remains uncertain.
What is puzzling, though, is that Chile’s convergence toward low homicide rates took place when its per capita GDP was diverging in comparison to the leading world economies. In figure 1 we provided evidence of the relative positions of Chile and the United States only, but these could have been paralleled with those of other leading economies such as the United Kingdom or Germany. However, despite this divergence, Chilean per capita GDP did increase during this period, while inequality decreased (Rodríguez Reference Rodríguez2017). In decadal average, real per capita GDP increased 25 percent, 17 percent, and 17 percent in the 1940s, 1950s, and 1960s, respectively, if compared to the previous decade.
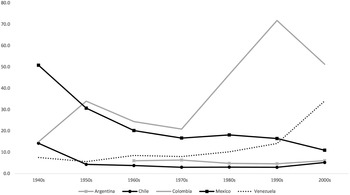
Chile’s position during the last half century has improved dramatically, being now close to those countries with the lowest homicide rates worldwide, an exemplary case of convergence within developing countries. In Latin America, Chile, Argentina, and Uruguay are notable for their comparatively low homicide rates (figure 4). The average homicide rates for the region during the 1960s–1970s were around 12, increasing to 17 and 21 during the 1980s and 1990s–2000s, respectively (Baten et al. Reference Baten, Bierman, Foldvari, Van Zanden, Van Zanden, Jörg Baten, Rijpma, Smith and Timmer2014), between four and eight times higher than in Chile. It is yet to be seen if after the social unrest that started in October 2019 these rates will remain at that comparatively low level.
Homicide rates in some selected Latin American countries. Source: Authors for Chile data. For all others, Clio Infra Project (https://clio-infra.eu/).

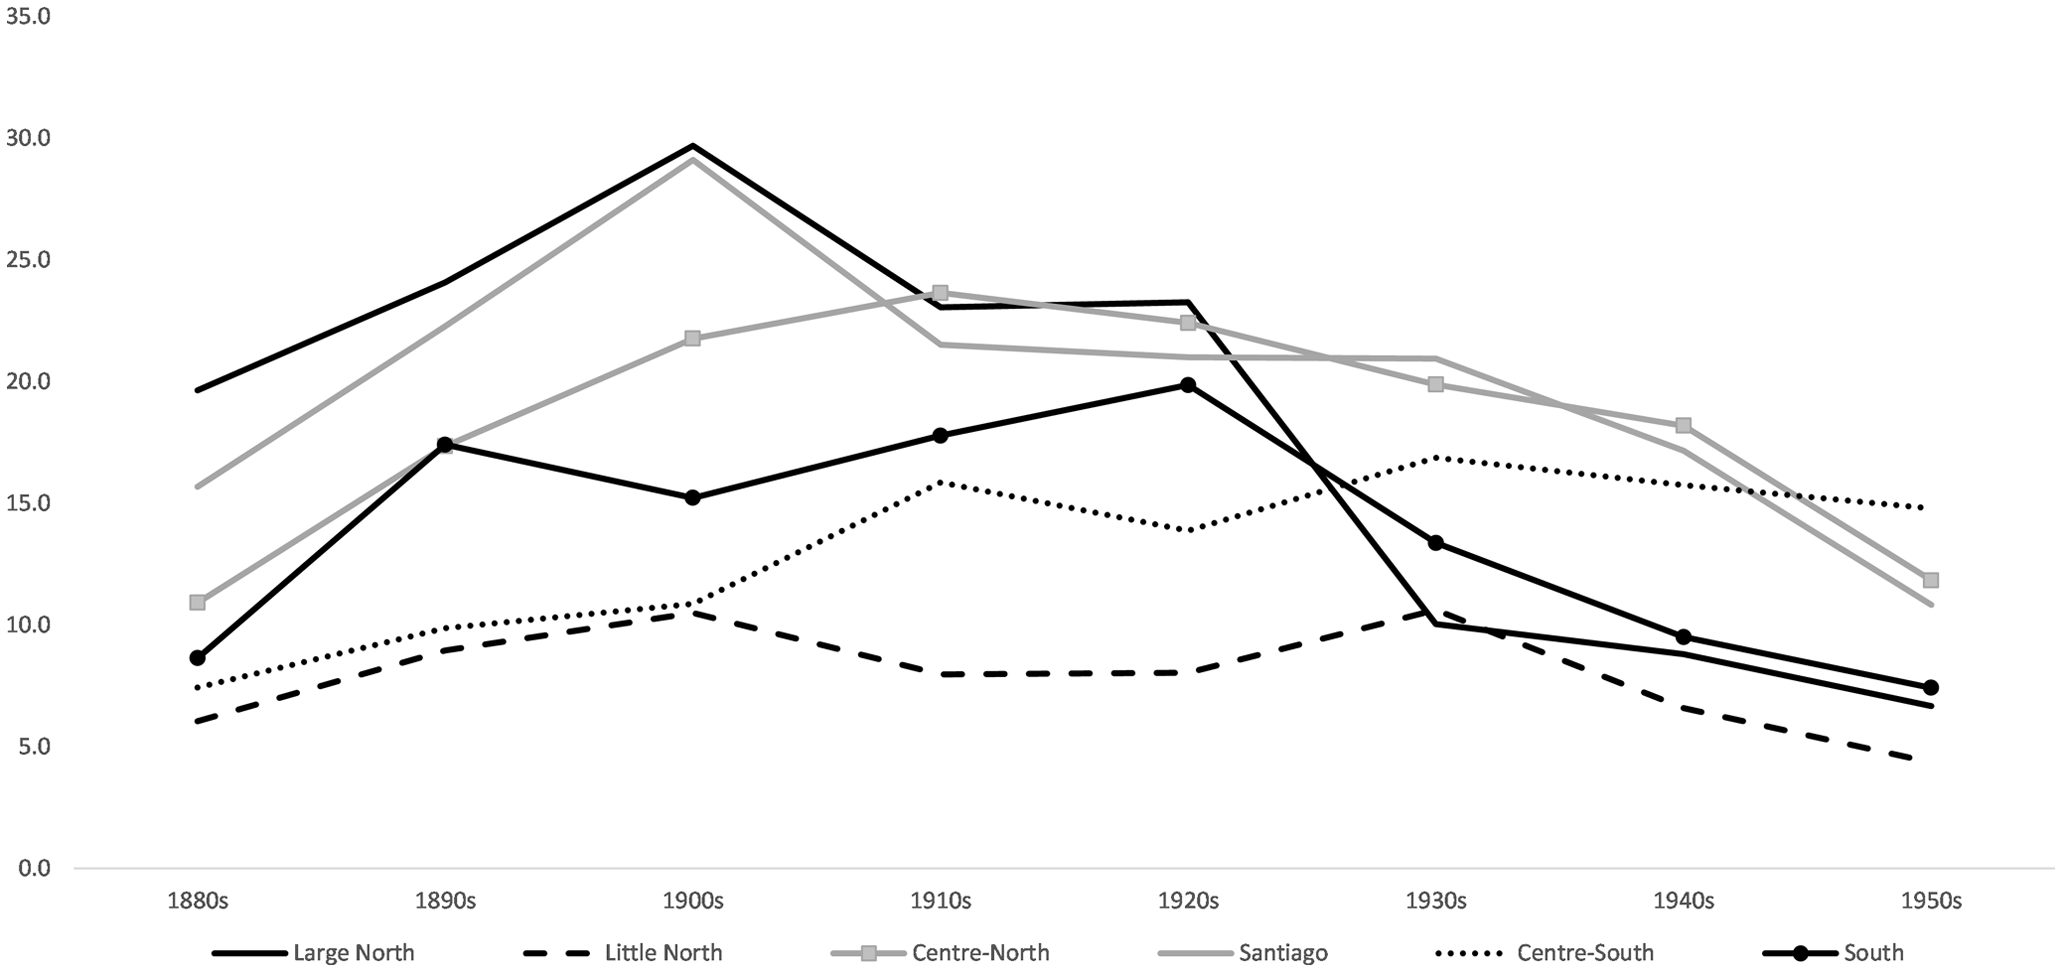
When dissecting the national figures at a regional level, we managed to find data for the 1880s–1950s only. We have gathered information for the seven large regions of Chile,Footnote 31 shown in figure 5, excluding the Extreme South. There is a huge variation between regions. This is not unusual: it has always been acknowledged that homicide rates can vary importantly across provinces within a country (Gurr Reference Gurr1981). The Extreme South was not included in the figure for ease of visual exposition; homicide rates were too high in this region (reaching 68 and 51 during the 1890s and 1900s, respectively) compared to all others (the South was sparsely populated at that time). Other regions suffering from high rates of interpersonal violence were the Large North and the capital, Santiago. These were the two regions with the most concentrated urban populations in the country. At the opposite extreme, the Little North enjoyed the lowest rate of homicides. During the 1940s and 1950s all regions experienced a decline in homicide rates, as was to be expected, and this decline started a decade earlier in many regions (the Large North, Centre-North, Santiago, South, and Extreme South).
Homicide rates across Chilean regions, 1880s–1950s. Note: The 1880s contain data for 1887–89 only; the 1890s for 1890–94 only, the 1900s, for 1900, 1902, 1904, 1906, 1908; the 1910s, for 1913, 1913, 1915–1918; the 1920s for all years except for 1920; the 1930s and 1940s for all years; while the 1950s contain data only for 1950–51 and 1953.

Descriptive Regression Analysis of Lethal Violence in Chile
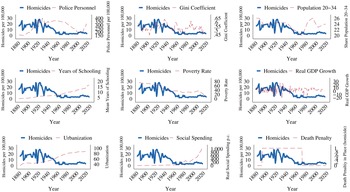
We consider how observed homicides described in this article move with other determinants mentioned previously. Given the longitudinal nature of these data, as well as the possibility for additional confounding factors or reverse causalities, we note that this analysis is correlational and exploratory, allowing us to observe how independent variation of a number of factors of interest predicts rates of homicide, as well as to examine whether leads of key socioeconomic factors predict future rates of homicides. To aim to minimize concerns related to reverse causality, we first consider contemporaneous movements between independent variables and homicides, before examining lags of these independent measures, which are entirely predetermined with respect to homicides. We provide descriptive plots of all variables, as well as how these track alongside homicide rates, in appendix 1. To undertake this analysis we estimate models of the following form:
 $$\matrix{
{log{{\left( {Homicides} \right)}_t}}{ = {\beta _0} + {\beta _1}Polic{e_t} + {\beta _2}Gin{i_t} + {\beta _3}Pop20 - {{34}_t}} \cr
{}{ + {\beta _4}Schoolin{g_t} + {\beta _5}Povert{y_t} + {\beta _6}GDPgrowt{h_t}} \cr
{}{ + {\beta _7}Urbanizatio{n_t} + {\beta _8}SocialSpendin{g_t}} \cr
{}{ + {\beta _9}DeathPenalt{y_t} + {\varepsilon _t}} \cr
} $$
where the independent variable of interest (the natural logarithm of the homicide rate per 100,000 inhabitants) at time t is allowed to depend on a number of covariates also measured at time t. The data used in this article are a time series of homicides, socioeconomic, and social outcomes with a single national-level average for more than 100 years. Given the time-series nature of this data, subnational fixed effects cannot be included in conditional regression models. The covariates included in equation 1 (listed in order) are the rate of police personnel per 100,000 inhabitants, the Gini coefficient based on personal income, the proportion of population aged between 20 and 34 years, the average years of schooling in the country, the poverty rate, the rate of real GDP growth, urbanization, social spending per capita in real terms, and an indicator for whether the death penalty was in place for all homicides. Here we estimate the linear coefficients β 1 to β 9 and the constant term β 0 by Ordinary Least Squares (OLS). The ϵ t term is an unobserved stochastic component, and standard errors for each estimate are robust to heteroscedasticity. In this specification, we use the natural logarithm of the homicide rate so that each coefficient can be interpreted as the approximate percentage change in rates of homicide with a one unit increase in the independent variable of interest.
To address concerns that independent variables may move in response to homicide rates rather than vice versa, we augment the prior specification to include lags of each variable. Namely, call Determinants t the full set of righthand side variables in the preceding model (a vector of variables). Similarly, Determinants (t-1) is the lagged realization of each measure, and Determinants (t-k) is the kth lag of each variable. We thus additionally estimate:
 $$\matrix{
{log{{\left( {Homicides} \right)}_t} = \;\alpha + {{\boldsymbol \beta} ^\prime }Determinant{s_t} + {{\boldsymbol \gamma} ^\prime }{\mkern 1mu} Determinant{s_{(t - 1)}}} \cr
{ + {{\boldsymbol \delta} ^\prime }{\mkern 1mu} Determinant{s_{(t - 2)}} + {\eta _t}} \cr
} $$
where β, γ, and δ are parameter vectors corresponding to contemporaneous measures, the first lag of these measures, and the second lag of these measures, respectively. Once again, we will estimate this model by OLS, η t is a stochastic error term, and standard errors are robust to arbitrary forms of heteroscedasticity. Here, we restrict lags to two years for each determinant considered. In practice, adding additional temporal lags has relatively little impact on higher order coefficients. Formal tests of prediction error based on the Akaike information criteria and Schwarz’s Bayesian information criteria suggest optimal lag lengths of between 1 and 3 lags when considering the natural logarithm of the rate of homicides.
Finally, we will address potential uncertainty in measurement by taking entirely predetermined five-year moving averages of each independent variable of interest. This consists of taking averages for each variable listed in the above models over the five years preceding each moment t and regressing the homicide rate in period t on these moving averages.
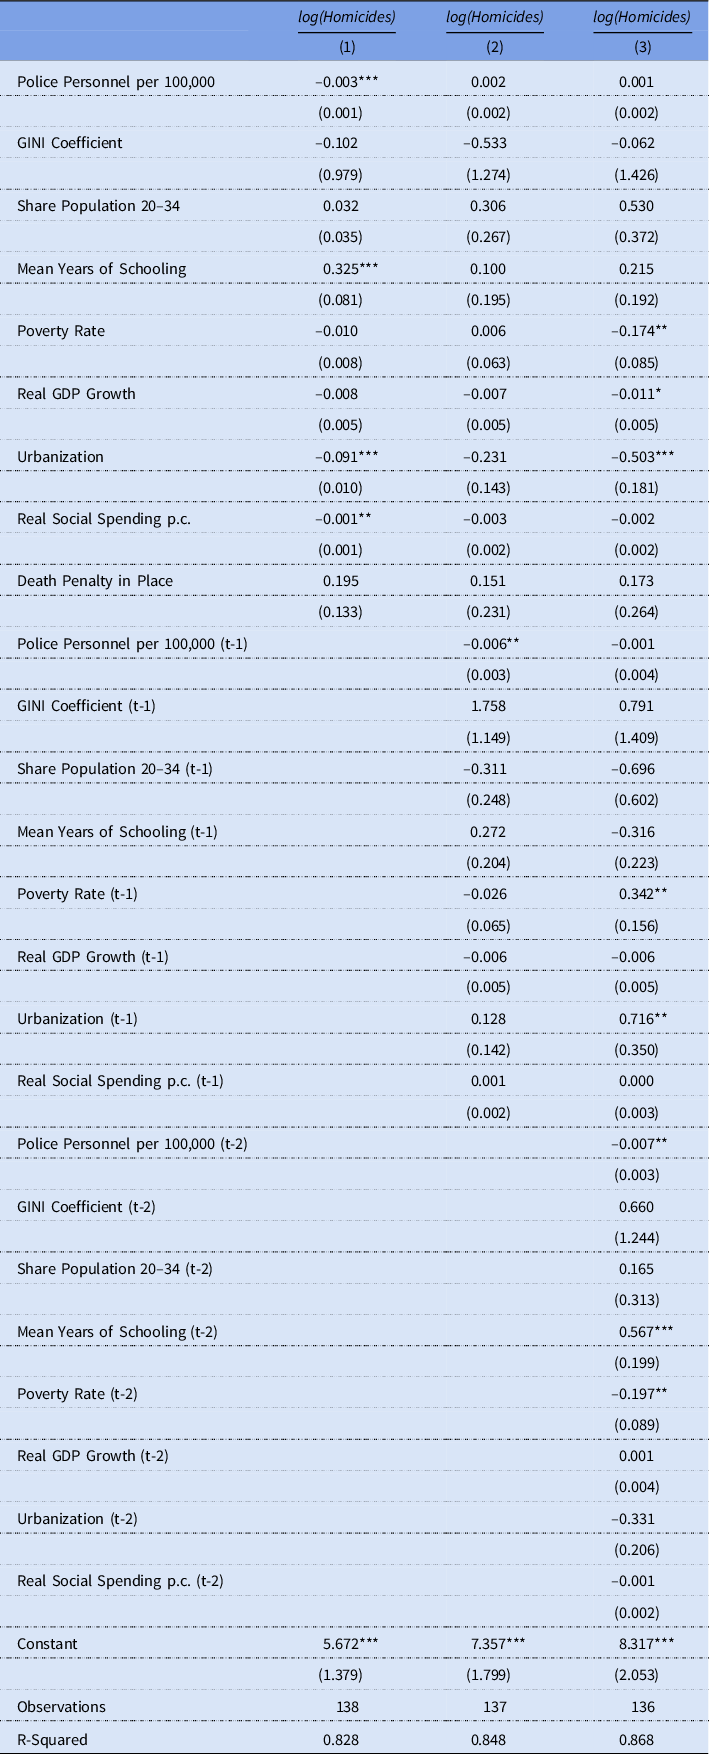
In table 1 we present correlational evidence from equations 1 and 2. In column 1, we first display equation 1, progressively including additional lags in columns 2 and 3. In column 1 we observe that police personnel per capita, urbanization, and real social spending per capita are all inversely related to the homicide rate. In the case of police personnel, for every 1 unit increase per 100,000 inhabitants, we estimate a reduction in 0.3 percent in the homicide rate. Surprisingly, in this model we note a positive relationship between schooling and rates of homicide, though return to this relationship below when we examine its stability over time.
Correlational evidence on long trends in homicide rates

In columns 2 and 3 we add additional lags of each measure, where equation 2 is presented in column 3. In this specification where full lags are included for each relevant measure we now observe that both present and past rates of poverty are negatively related with homicides, and observe some evidence that growth in real GDP is also negatively correlated with homicides (increases in real GDP are conditionally correlated with falling rates of homicides).Footnote 32 Of interest, now police personnel is still negatively correlated with homicide rates, however this obtains principally in lagged models, suggesting some feedback process between additional police presence, and future rates of homicide. For example, a 1 unit increase per 100,000 inhabitants in period t-2 is estimated to be associated with a 0.7 percent decline in homicides in period t.
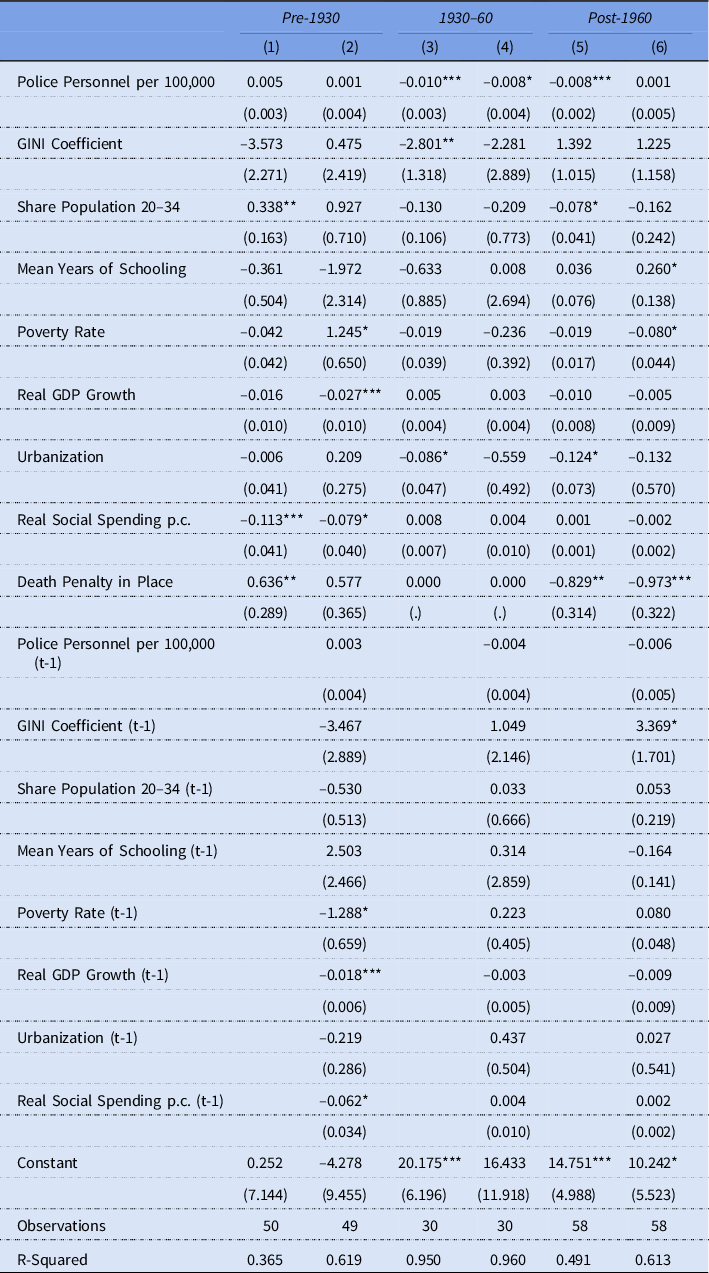
In table 2 we examine these relationships by period, both prior to, during, and posterior to the sharp reduction in homicides observed between the 1930s and the 1960s. Columns 1 and 2 present regression results for only the pre-1930 period both with and without lagged outcomes and suggest a negative correlation between homicides and each of GDP growth, the rate of poverty, and social spending. Interestingly, this relationship appears to lessen over time. Indeed, in the period of sharp reduction in homicides (1930s–1960s), the only robust correlation obtains when considering police personnel. In this case, we observe that for each additional member per 100,000 inhabitants, rates of homicide are approximately 1 percent lower. This relationship is similarly observed in the post-1960 period.
Correlational findings by period

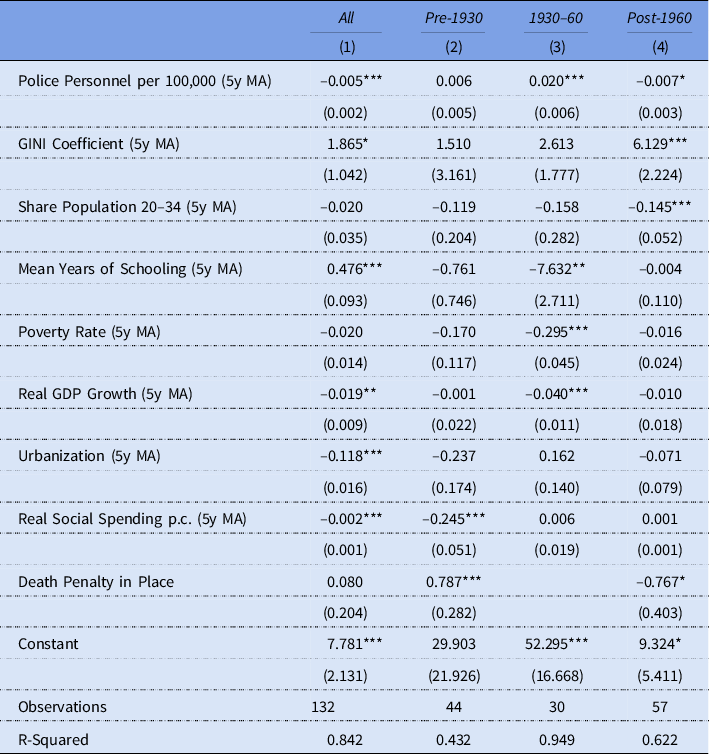
Finally, in table 3 we examine an alternative measure of the independent variables available, namely taking predetermined five-year moving averages of each measure. In general, these similarly point to the changing nature of determinants over time, as observed with regressions in table 2. For example, when taking longer period moving averages, we observe relatively consistent correlations between (higher) inequality as measured by the Gini coefficient and reductions in rates of homicide. We similarly observe relatively consistent correlations between higher social spending and reductions in homicide, particularly in the pre-1960 period, as well as higher GDP growth and reduced rates of homicide. However, correlations between years of schooling and rates of police personnel do not exhibit such stability, limiting our ability to comment on the sign of correlations at least when longer moving average estimates are employed.
Homicide rates and predetermined 5-year moving averages of correlates

Conclusions
Our main conclusion is that the number of homicides per 100,000 inhabitants in Chile was very high during the late nineteenth century and the early decades of the twentieth century. However, from the 1930s homicide rates started to decline, initially gradually, but sharply during the 1950s–1960s, remaining at similar (low) levels until the 1990s. During the 1960s–1990s the country’s homicide rates were low by international standards. The 1930s–1960s was a key period in the evolution of interpersonal violence of Chile. There was a sustained decline in Chile’s homicide rates: a clear turning point in interpersonal violence in Chile, and an accelerated decline by international standards. The most important characteristic of this period is Chilean convergence toward the homicide rates of Europe. Interpersonal relationships in Chile changed for the better during these decades, in both public and private places: there was a major cultural shift in attitudes toward violence.
This phase coincides with a period in Chilean economic history of inward looking development, led by the state. After the Great Depression of 1929, the state was increasingly interventionist in economic affairs. During this period all governments implemented policies of social welfare, reducing poverty rates from 65 percent in the 1910s to around 36 percent during the 1950s–1960s, which probably led to a more favorable popular perception of the political elites. These policies brought about a cultural change in the country, and a reduction of anomie. It has been argued that in other regions of the world that experienced a decline in homicide rates, such as Europe from the 1850s to the 1950s, this decline was mainly due to a cultural change, and a modernization process, with the promotion of self-constraint, familialism, and the pursuit of respectability, which were reinforced through social institutions.
During the 1930s–1960s, the per capita GDP growth rates of the country increased significantly, at unprecedented ratesFootnote 33 and only superseded by those from the mid-1980s to the late 1990s. However, the high growth rate of the 1930s–1960s (when homicide rates declined the most) surprisingly coincided with the period when the per capita GDP of the country was diverging in relation to the leading economies of the world, although these economies had never grown so fast: it was the golden age of advanced capitalism. What is clear is that this period coincided with the emergence of a welfare state, increasing social expenditure, declining poverty rates, improvements in health and education, increasing policing, and an increase in universal suffrage. Can we also talk about a modernization of Chilean society during this period? Or of a “civilization process”? That is a matter for future research.
Let us illustrate the change in Chilean society by a case in point. In 1865, an ordinary Chilean man, Cruz Riquelme, caught his wife having sex with another man in the couple’s bed. The enraged Riquelme decided to kill both his infidel wife and her lover. He stabbed the lover to death, but failed in his attempts to assassinate his wife, who escaped badly injured. At the trial, the judge decided to immediately release Cruz Riquelme from prison. For the judge, the short time served in prison (between the murder and the sentence) was sufficient punishment. The whole case was published in Gaceta de los Tribunales (No. 1223, 16 December 1865), and was widely known in and accepted by Chilean society. If the crime had taken place a hundred years later, in the 1960s, it would be unthinkable that someone like Cruz Riquelme would not have served at least 15 years in jail. Recent court rulings by the Chilean Supreme Court show that for a man in Riquelme’s position “a due reflection on the act to execute” would have been expected, despite the pain caused by infidelity.Footnote 34
While the aim of this article is not to explain the causes of homicides in Chile, nor causal determinants of reductions in homicides, we do present correlational evidence over a long period examining how a number of public and socioeconomic variables move with rates of homicides. We agree with the late EH Monkkonen, who in his last article (2015), before an untimely death, noted that social scientists, historians, and other scientists are not able yet to provide comprehensive explanations of such phenomena. However, our regression analysis points to the importance of a number of variables related to economic conditions. There is evidence that increased social spending in the past is associated with a reduction in homicides in the present, and additionally, that past and concurrent economic growth also correlates with reductions in rates of homicides. Finally, there is some evidence to suggest that increased police presence (both lagged and concurrent) is correlated with reductions in rates of homicides, though we cannot entirely rule out that this relationship is in part capturing reverse causality flowing from homicides to additional police personnel; this relationship does not appear robustly over time, and is particularly obvious in periods in which sharp reductions in the rate of homicides were observed.
It is also important to stress that for most developing countries high levels of homicides are thought to be one of the most important reasons for low levels of well-being (Baten et al. Reference Baten, Bierman, Foldvari, Van Zanden, Van Zanden, Jörg Baten, Rijpma, Smith and Timmer2014). Yet, Chile seems to be an exception to the rule. Why? Homicide rates are now low, from the 1960s onward amongst the lowest in the region, but well-being is not as high as in other countries enjoying comparable levels of homicide rates. Chile felt into the same trap as other middle-income countries: despite a remarkable fall in homicide rates, amongst other improvements, per capita GDP did not improve while other indicators of well-being also remained stagnant.
Another unusual aspect of Chile’s lethal violence rates is that they have been low during the last half century (including the killing of members of the political elites), but inequality is high, which is an unusual situation: inequality is one of the main drivers of interpersonal violence. Until October 2019, when the country experienced one of the worst periods of social unrest in its entire history, Chile was widely thought to be amongst the most politically stable countries in the continent, despite the rampant income inequality, poor access to education and health services, and the miserable pensions awarded to its people.
Acknowledgments
We are very grateful to the National Register Office (Registro Civil) of Chile, in particular to Alicia Pérez Ponce, Francia Vera, Pablo Rodríguez, Lidia Vergara, Roberto Gesell, and to the staff of the Departamento de Subinscripciones. We are also indebted to the Office of National Statistics (INE), in particular to Iván Valenzuela. We are also grateful to Rory Miller, Diego Barría, Katharine Wilson, Elías Navarrete, Javier Rodríguez Weber, José Díaz, Francisco Zambrano, Margot Winkler, Andrés Estefane, and Cristian Ducoing. This paper was funded by the Anillos Grant number ANID PIA SOC180001; Universidad de Santiago’s grants numbers 031962LLJ_POSTDOC_ANILLO and USA-1855.
Appendix 1
Descriptive plots of all variables.