Introduction
A system, isolated from its surrounding, will continue to be in a state of equilibrium unless driven by an external steady flow of energy. Statistically, a state of equilibrium implies a state of randomness, and randomness implies symmetry. Therefore, from a microscopic sense, all states in a statistical ensemble are equally likely, and the system explores all possibilities before collapsing into a single-state point in the phase space, characterized by macroscopic thermodynamic variables such as pressure, temperature, and volume. The physics of such equilibrium systems forms the basis of classical thermodynamics and statistical mechanics.Reference Clausius1–Reference Lieb and Yngvason5 However, if we observe our surroundings, there are numerous systems that are open and are constantly being fed with energy. Examples of such actively driven systems include self-assembly in biological systems; the reaction-diffusion process in chemical and ecological sciences; thermal-convective phenomena in fluid dynamics, geophysical and atmospheric sciences; and fracture propagation in materials science.Reference Cross and Hohenberg6–Reference Chillà and Schumacher14 The unifying theme across all of these examples, from nanoscale to macroscale, is the staggering complexity that emerges spontaneously. As expected, equilibrium thermodynamics is insufficient in explaining the underlying dynamics. Typically, far-from-equilibrium thermodynamics is treated as a natural extension of equilibrium thermodynamics. Such an approach is based on the local equilibrium hypothesis, according to which a system can be viewed as a collection of subsystems where the rules of equilibrium thermodynamics hold true.Reference Kolmogorov15,Reference Vilar and Rubi16 However, in reality, a simple theoretical Carnot engine (C), which exchanges heat between two reservoirs maintained at different temperatures and generates work, becomes incredibly difficult to visualize in practice (see Figure 1a).Reference Casas-Vázquez and Jou17,Reference García-Morales, Pellicer and Manzanares18 Even in order to maintain the heat baths at a constant temperature, a steady heat influx is mandatory. Thus, a practical Carnot engine (C′) no longer remains as efficient as a theoretical Carnot engine, and its efficiency is now expressed as a function of steady-state nonequilibrium temperature of the baths and subsequent far-from-equilibrium corrections (see Figure 1b).
(a) Theoretical Carnot engine, C, operating between the thermal reservoirs T 1 and T 2 (T 1 > T 2). It derives heat, Q 1, from the reservoir kept at T 1, rejects heat, Q 2, into the reservoir kept at T 2 while performing work, W. (b) A practical Carnot engine, C′, operating between two thermal reservoirs  ${{\rm{\theta }}_1}$ and
 ${{\rm{\theta }}_2}$ kept at a steady state by the constant heat influxes, q 1 and q 2. It derives heat Q 1′ from the reservoir kept at
 ${{\rm{\theta }}_1}$, rejects heat, Q 2′, into the reservoir kept at
 ${{\rm{\theta }}_2}$ while performing less work, W′ (W′ < W).

The problem we face is twofold—the absence of definition of the thermodynamic variables in a far-from-equilibrium scenario, and the ability to fit the ideas of emergence of order and complexity into a theoretical framework. While a system at equilibrium is completely random, a system when driven out-of-equilibrium is extremely sensitive to the magnitude of the driving perturbation. For example, when water is heated over a flame, it takes some time to create a steady-state thermal gradient. Once the gradient is established, a convection current is set up that drives the hotter molecules to the top and colder molecules to the bottom, in a cycle. This onset of convection is denoted by the critical value of the dimensionless constant, the Rayleigh number (Ra). In further increasing the gradient, the convective motion becomes chaotic and turbulence sets in, which is marked by high values of Ra (∼109 for a vertical surface). For a driven thermal convective system such as the Rayleigh–Bénard convection, where both inertia and viscous drag play a crucial role, the region between these opposite ends of the spectrum allows for numerous possibilities in the system to let order emerge naturally.Reference Cross and Hohenberg6,Reference Koschmieder19,Reference Pandey, Scheel and Schumacher20
Rayleigh–Bénard convection review
Rayleigh–Bénard convection is an excellent and perhaps the oldest prototypical model to explore the emergence of order when driven far from equilibrium.Reference Cross and Hohenberg6,Reference Chillà and Schumacher14,Reference Koschmieder19,Reference Pandey, Scheel and Schumacher20 A thin layer of silicone oil with a kinematic viscosity  $\left( \nu \right)$ of 150 centistoke (cSt) is heated in a copper pan by an electric heater attached to its base. A thermocouple attached to the base of the copper pan records the bottom temperature, T bottom. The vertical temperature gradient (in +z direction) initiates a convective motion in the fluid, and under the competing forces of buoyancy and viscosity, a thermal instability is generated. These thermal instabilities appear as patterns of various length scales when imaged using an infrared camera. The camera, which is calibrated by the base thermocouple temperature, T bottom, of the empty copper pan, is used to record the temperature of the top layer of the oil film, T top. The system fed with constant power is observed for 2 h, after which it reaches a steady state.
Thermal profiles of convective cells
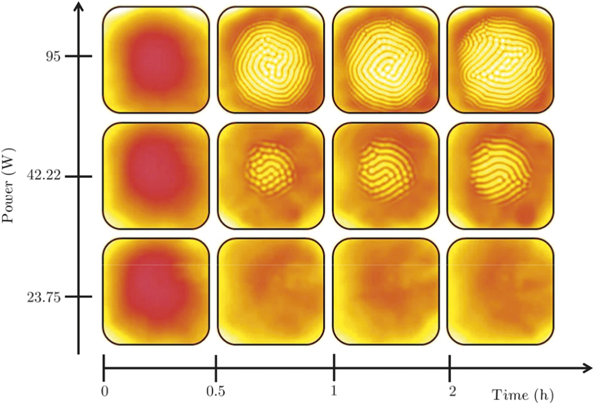
In Figure 2, we present the thermal images of the Rayleigh–Bénard convection recorded at different instants in time (along the x-axis) as a function of increasing power (along the y-axis).Reference Chatterjee and Iannacchione21 Each pixel in the thermal image corresponds to a specific temperature T j that can be obtained by linearly extrapolating a thermal scale (white being the hottest). The color scheme in the figure thus corresponds to the respective heat maps generated. In the bottom panel, there is no emergent pattern as the thermal gradient between the layer thickness is not sufficient to sustain thermal convection. However, comparing the top and the middle panels, we can clearly see that the onset of pattern is faster at a higher power. Higher power allows for a higher temperature gradient. The Rayleigh number, which is crucial to predict the onset of convection, is directly proportional to the temperature difference between the layer thickness (T bottom–T top) and varies as the cube of the film thickness (l z). The critical value of the Rayleigh number for the onset of convection is 1708.Reference Koschmieder19 In the top panel, the critical Rayleigh number is achieved much faster and earlier than in the middle panel. Whereas in the bottom panel, the Rayleigh number is always less than the critical value (see Figure 2 caption for the values of the Rayleigh number at steady state).
Thermal images of the Rayleigh–Bénard convection at different instances in time for different driving powers. The right most column is the steady-state images taken after 2 h with Rayleigh numbers, Ra = 831, 2670, and 3464 (bottom to top). Note: Color scale is independent to each image.Reference Chatterjee and Iannacchione21

Coexisting local equilibrium states, and free-energy bifurcation
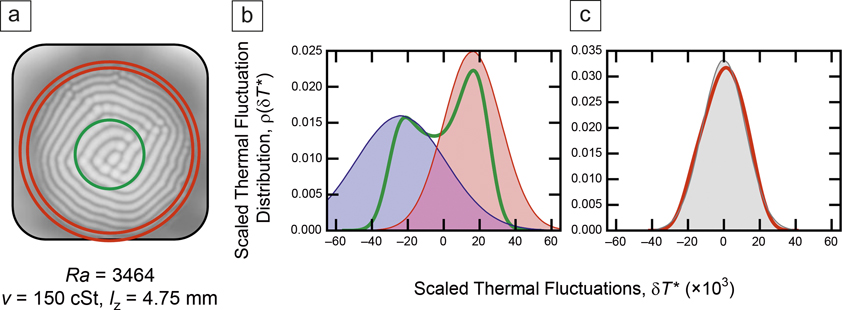
Figure 3a shows a steady-state thermal image of the system taken at Ra = 3464. In Figure 3b–c, we show the scaled thermal fluctuations in the far-from-equilibrium steady-state Rayleigh–Bénard convection.Reference Chatterjee and Iannacchione21 Thermal fluctuation at each point is defined as the variation of each pixel’s temperature from the mean bulk temperature of the image. The scaled thermal fluctuation is the ratio of the thermal fluctuation to the mean bulk temperature of the system,  ${T^*} = \left( {{{{T_j} - \left\langle T \right\rangle } \over {\left\langle T \right\rangle }}} \right)$. We can clearly observe the difference in the shapes of the fluctuation distribution plots
 $\left( {{\rm{\rho }}\left( {{T^*}} \right)} \right)$ for the two distinct regions of interest. In Figure 3b, we select a middle region to carry out the statistics. This region captures the convection patterns, and takes into account the presence of both the upward and downward plumes. In Figure 3c, we select a region that is devoid of any convection cell, thus containing only thermally random currents.
(a) A steady-state thermal image taken at Ra = 3464. (b, c) Panels show scaled thermal fluctuation distribution for (b) a circular region (dark green) and (c) an annular region (red). The data are denoted by the solid line plot; the Gaussian fits are denoted by the shaded regions in the plot.Reference Chatterjee and Iannacchione21,Reference Georgiev, Iannacchione, Chatterjee and Vu23,Reference Yadati, McGrath, Chatterjee, Georgiev and Iannacchione24

Implications
The statistical implications of the distributions are striking. In the region devoid of convection cells, the fluctuations are found to be random and a Gaussian distribution perfectly overlaps the underlying fluctuation distribution curve (Figure 3c). However, in the region that includes the convection cells, the underlying distribution function shows a bimodality (Figure 3b).Reference Chatterjee and Iannacchione21–Reference Yadati, McGrath, Chatterjee, Georgiev and Iannacchione24 We also point out in Figure 3b that the slope of the distribution on either side is too steep for two distinct Gaussians to be able to replicate the observed bimodality. This result points toward an interesting observation about the statistical interpretation of the system. Macroscopically, the system is far-from-equilibrium, but microscopically, we should expect an equilibrium-like behavior, as the fluxes in the system are completely balanced (steady state). And as expected, while we do observe equilibrium-like behavior at one location, we also observe nonequilibrium fluctuations in the same system at a different spatial location. Since the nonequilibrium fluctuation is not replicated by two overlapping independent Gaussians, we can claim that the system, as a whole, cannot be interpreted as just a linear superposition of local equilibrium states.
Further, we consider the interpretation of temperature for a system when driven far-from-equilibrium. Temperature is one of the principal equilibrium-thermodynamic variables that can be used as a measure of the mean energy of the particles of a matter. However, nonequilibrium interpretations of the temperature are still unclear. Temperature in a far-from-equilibrium system varies both temporally and spatially. As we see from Figure 3b–c, bimodality in thermal fluctuations implies the presence of two local equilibrium temperatures in the system.Reference Chatterjee and Iannacchione21,Reference Georgiev, Iannacchione, Chatterjee and Vu23,Reference Yadati, McGrath, Chatterjee, Georgiev and Iannacchione24 Since experimental observations are made at the steady state, temperature remains constant as a function of time. As the system has frozen into a state where multiple equilibrium points can coexist, the temperature can now be interpreted as a thermodynamic variable to represent these coexisting equilibrium points in a phase space. The trajectory that connects these local equilibrium points can then be interpreted as the energy landscape on which these local equilibrium points thrive.
Furthermore, the emergence of these spatial gradients on the far-from-equilibrium thermodynamic landscape due to convection implies a bifurcation in the free energy of the system. Had the total heat transferred through the system been purely conductive, there would have been a single uniform temperature. Convection, on the other hand, creates bifurcation. Macroscopically, this can be related to the phase coupling of a series of practical Carnot engines (C′) that generates work for the convection to survive while exchanging energy between these local equilibrium points.
Conclusion
Classical thermodynamics, one of the oldest and most successful areas of physics, based solely upon observation and deduction, describes equilibrium phenomena beautifully. The vast majority of interesting phenomena and rich intricate complexities of the world around us, however, arise from conditions far-from-equilibrium.Reference Lieb and Yngvason5–Reference Jaeger and Liu12,Reference Chatterjee and Iannacchione21,Reference Georgiev, Iannacchione, Chatterjee and Vu23–Reference Chatterjee26 Equilibrium thermodynamics can only weakly approximate far-from-equilibrium processes. Approximating far-from-equilibrium processes is often not a good idea, as a system’s response to the perturbative effects is not linear, and nonlinearity possesses the natural risk of driving the system into the regime of deterministic chaos. In theory, those phenomena in which microscopic time scales are much faster than the macroscopic time scales (and vice versa) can be approximated as equilibrium processes.Reference Kolmogorov15,Reference García-Morales, Pellicer and Manzanares18 As emergent complexity and pattern formation occur between the meso- and macroscale, we set up a tabletop experiment to study far-from-equilibrium behavior. In this study, we researched far-from-equilibrium behavior in a Rayleigh–Bénard convection from a first-principles perspective. While our approach has provided us several insightful results, it has also left us with numerous open-ended questions. This article provided perspectives on questions such as how to interpret the system macroscopically as local order emerges when it is being driven far-from-equilibrium, or how to microscopically interpret the statistics of the distribution of states in an environment consisting of coexisting equilibrium states. Although answers to these questions are speculative at this moment, it is the context of our study that has led us to ask such questions in the first place. While we search for explanations, we also believe at the same time that no single theory would be able to answer all of these questions due to the sheer amount of complexity present in the world around us.Reference Lieb and Yngvason5,Reference Cross and Hohenberg6,Reference Jaeger and Liu12,Reference Chatterjee and Iannacchione21,Reference Georgiev, Iannacchione, Chatterjee and Vu23–Reference Kadanoff28
Acknowledgments
We would like to thank our collaborator, G.Y. Georgiev, and the contributions of Y. Yadati and S. McGrath. We are thankful for the support of the Department of Physics at Worcester Polytechnic Institute.

Atanu Chatterjee is a doctoral candidate in the Department of Physics at Worcester Polytechnic Institute (WPI). He received his bachelor’s degree in mechanical engineering, and master’s degrees in applied mathematics from the Indian Institute of Technology Madras, India, and in physics from WPI. His research focuses on far-from-equilibrium thermodynamics, variational calculus, and network science. He has co-authored approximately 22 publications. He was a visiting scientist at the Politecnico di Torino from 2017 to 2018. Chatterjee can be reached by email at achatterjee3@wpi.edu.

Germano Iannacchione is a professor of physics at Worcester Polytechnic Institute and the program director of the Condensed Matter Physics Program in the Division of Materials Research at the National Science Foundation. He received his MSc degree in physics in 1990 from The University of Akron, and his PhD degree in physics in 1993 from Kent State University. He was a Fellow at the Liquid Crystal Institute at Kent State University from 1993 to 1996, and in the Department of Chemistry at the Massachusetts Institute of Technology from 1996 to 1998. His research focuses on order-disorder phenomena in soft condensed matter (polymers, liquid crystals, biomaterials, and colloidal composites) and far-from-equilibrium emergence. He has authored approximately 87 publications. Iannacchione can be reached by email at gsiannac@wpi.edu.