


1 Introduction
The side-scanning sonar (SSS) technique is extensively used for small-scale mapping of bottom features in near-shore and continental shelf areas. This technique was first used in the Weddell Sea area during the Norwegian Antarctic Research Expedition (NARE) of 1976–77 (Reference FossumFossum and others, unpublished). Standard equipment and techniques proved adequate for operations in this severe environment. During NARE 78–79 the side-scanning sonar programme was extended to include investigations of under-water topographical characteristics of icebergs, ice fronts, and ice walls. An account of the SSS programme and the distances profiled during NARE 78–79 is given in Table I, and a map showing the SSS profiling areas is shown in Figures 1 and 2. A small area outside Blaaenga (Fig. 2) named Ladebanken was profiled in greater detail, covering water depths between 150 and 400 m. Also, horizontal and vertical profiles of the ice front were obtained in the same area.
NARE 78–79. SSS profiling areas.

SSS profiles and bathymetry of the Ladebanken area outside Blaaenga.

NARE 78–79 SSS PROGRAMME

In this paper, different profiling techniques are described. For those unfamiliar with interpretation of SSS sonographs, a brief survey of the technique and the equipment used during the experiments is given.
2 Side-Scanning Sonar
The side-scanning sonar system consists of three units: a transducer which forms the under-water unit and is better known as the “fish”, a reinforced steel wire cable acting as both transmission and tow cable, and a dual recorder. The fish consists of a streamlined, hydrodynamically-balanced body about one metre long containing two sets of transducers that scan the sea bed on both sides (Fig. 3). The ultrasonic beam is slightly depressed from the horizontal with the axis of the main lobe pointing about 10° downwards. The transverse resolution (R t) is governed by the horizontal spread of the beam which is approximately 1°. A short pulse of sinusoidal acoustic waves (about 0.1 ms) is transmitted and the returned echoes are received by the same transducers, amplified, transmitted through the cable, and eventually recorded on a dual chart recorder. Each returning signal is plotted on the recording paper at the position corresponding to the time it was received after the outgoing pulse. The range resolution (R r) is given by the pulse length of the transmitted pulse. As the fish moves through the water, the adjacent partly-overlapping scans will successively form an acoustic image of the sea bed; this is a sonograph.
SSS principles of operation.

The sonar set used was a Klein Model 400. The main specifications for this set are listed in Table II.
Klein Model 400 Specifications
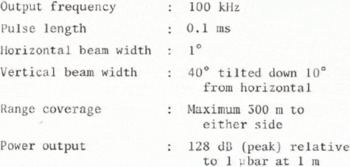
Figure 4 shows an example of a sonograph from Ladebanken (Fig. 2) at lat. 72° 13′ S., long. 16° 07′ W. Some of the details have been identified as an aid in interpreting the bottom features. The sonograph differs from an ordinary photograph in that the stronger echoes appear darker and consequently the shadows are white. Also, the sonograph does not represent a plan view of the bottom, but represents slant ranges from the fish to the targets.
SSS sonograph from Ladebanken (lat. 72° 13′S., long. 16° 07′W.).

As can be inferred from the dramatic appearance of the bottom in Figure 4, this area has recently been exposed to iceberg ploughing, showing gouges more than 20 m deep. The strength of the bottom return is related to the acoustic impedance contrast for the bottom and water respectively, together with the roughness of the bottom on a scale comparable to the wavelength of the acoustic pulses (1.5 cm). For the side-scanning geometry, the last factor is important for interpreting sonographs from icebergs and ice fronts. Figure 5 illustrates a simple scattering model, showing the returned acoustic energy at various roughness (σ) to wavelength (λ) ratios.
Scattering of acoustic energy from different surfaces.

3 Studies of Icebergs, Ice Fronts, and Ice Walls
When operating the SSS from a ship on the surface, we are limited to mapping under-water topographical features of the vertical sides of icebergs and the ice front. Investigations of the ice bottom would require operation from a submersible. We may, however, obtain an indirect indication of the ice-bottom topography from the bottom gouging pattern off the ice front from which the iceberg calved (Fig. 4).
During NARE 78–79 two profiling techniques were used: horizontal and vertical. In horizontal profiling the sonar fish was tilted on its side with respect to normal operating conditions, and towed close to the cliff at different depths (Fig. 6a). This was accomplished by adding an extra set of brackets for the tow-cable termination at 90° to the original. In vertical profiling the sonar fish was lowered to the sea floor and then pulled vertically at a constant speed (Fig. 6b).
SSS profiling of icebergs, ice fronts, and ice walls.
(a) Horizontal profiling.
(b) Vertical profiling.

3.1 Horizontal profiling of ice fronts and ice walls
Records were obtained from two areas: Blaaenga and Kapp Norvegia. Examples of sonographs are given in Figures 7 and 8. Off Blaaenga the fish was towed at a depth of about 90 m, which corresponds to about half the depth of the ice front. As can be seen from the sonograph, the interpretation is not as straightforward as in Figure 4. The downward-looking channel is partly corrupted by bottom echoes from the previous sonar pulse (range ambiguities). This also demonstrates that the bottom is a much stronger reflector than the ice itself. Also, cross-talk occurs from the surface echoes of the upward-looking channel. The surface line is the echo from the water surface and the multiple reflections are echoes from the ice that have been transmitted or received via the water surface. On the upward-looking channel, there is interference from the surface line and multiple reflections from the surface-breaking zone.
Sonograph from horizontal profiling of the ice front off Blaaenga (72° 24′S., 16° 14′W.).

Sonograph from horizontal profiling of the Kapp Norvegia ice wall (71° 19′S., 12° 15′W.).

However, apart from interference problems, a fairly uniform picture is obtained. The “first-echo” line (barrier line in Figure 7) shows a horizontal profile at the depth of the fish, having height differences of 20 to 30 m and periods of 30 to 100 m. It should be noted that this cliff was created by the calving of a giant tabular iceberg in January 1977 which was observed by NARE 76–77. This may explain the uniformity of the profile in that it has not yet reached a new equilibrium between ice and sea-water. With grazing angles different from 90°, the back-scattered acoustic energy is highly dependent on the microtopography of the surface on a scale comparable to the wavelength of the acoustic pulses as explained in section 2. On the upward-looking channel we also observe a band of low reflectivity extending to 20 to 30 m below the surface. This may be due to wave action or to an abrupt change in the inclination angle with respect to the vertical.
In Figure 7, only the downward-looking channel is shown. The water depth is about 160 m and the fish was towed at a depth of about 75 m. The ice in this area is grounded and there are no observations of recent calvings. This is also evident on the sonograph. The echo-return from the ice wall is confined to a small band at normal incidence. The fish is towed above the ram which changes its shape and dimensions, thus giving different normal incidence ranges (Fig. 9). The low reflectivity away from normal incidence as compared with the ice front off Blaaenga may probably be explained by a major difference in the microtopography of the surface.
Approximate geometry of the ice wall at Kapp Norvegia.

3.2 Horizontal profiling of a free-drifting tabular iceberg
The general investigations of drifting tabular icebergs carried out during NARE 78–79 included horizontal profiling of the sub-surface walls of tabular icebergs, using the SSS technique described in section 2, with the SSS fish looking towards the vertical face. The objective was to produce a topographic image which could describe the shape and help in understanding the physical characteristics of icebergs. Little is known about the submerged surfaces and there are no available and tried methods for mapping them. The discussion and conclusion given in this paper are based on the results obtained from investigations on iceberg no. 22, visited on 22 February 1979. Since this was an experiment, the results are only indicative and should be valued as such.
In Figure 10, only the approximate shape of iceberg no. 22 at the water line is shown since no detailed mapping was possible. The SSS fish was towed at a depth of 15 m, using only the downward-looking channel for information. Earlier experience from profiling along the ice front showed that this is the most favourable towing configuration, with minimum multi-path noise and good coupling between vessel movements and fish, which is necessary when profiling close to an iceberg. Navigating the vessel at a constant distance from the iceberg is not feasible since manoeuvrability is limited at the profiling speed of two to three knots. The recordings were therefore obtained with offset distances from 0 to 150 m. However, it is possible to navigate a vessel within a corridor of 15 to 50 m.
Computed depth based on SSS measurement for iceberg no.22.

Typical recordings along this iceberg showed a reflective signal from a smooth surface without any dominant topographic features. There were small-scale variations in height of the order of 1 to 3 m or large-scale variations at the corners of points A and B (Fig. 10). No large protruding rams were observed. However, where key-depths are plotted at their observed position, together with the depth profile from section BC, the variation in measured depth from the water line to the last reflected signal from the submerged face is large. This observed depth as seen by the SSS fish is a function of the towing geometry and the actual vertical profile of the iceberg.
To explain the measured variations in depth, a model of the submerged face had to be established. The model is shown in Figure 11 and, in principle, describes the submerged face by means of two sections: a vertical section from the water line down to 15 to 30 m, and a section curving inwards with a variable radius Indicated by R. When the SSS fish is close to the iceberg, signals will not reach areas below a certain level. Depending upon R, the observations will be more or less sensitive to variations in the distance from the SSS fish to the ice. This distance is denoted A. In Figure 12, the functional relation between A and the maximum observable depth D is given for different values of R, together with plotted values from observations. The observed values indicate a radius of approximately 200 to 300 m. This is also confirmed by observations of the slope of the side when the SSS fish is passing a corner. Calculations show an inward tilt from top to bottom at point C of 18°. This again corresponds to a radius of 285 m. The fit between the model and the observations is best for the parallel sides BC and EA (Figs. 10 and 12).
A model of the side of iceberg no.22 along section BC and EA (not to scale).

The calculated relation between measured depth D and the offset distance A, and measured values on iceberg no.22.

The model also includes a vertical section from the water line down to 15 to 30 m. This corresponds to the wave-action zone. In Figure 11, it can be seen that this will limit observations of greater depths than D o when the SSS fish is less than A o from the iceberg. In Figure 13, this phenomenon is observed as the SSS fish approaches the side. When the distance is A o, the measured depth drops abruptly to D o. A similar sequence of events was recorded when the SSS fish was towed out again from the side.
Observation of shadow effect when the SSS is closer than A o to the side of the iceberg.

This model helps to explain some large-scale characteristics of the iceberg. However, at section AB in Figure 12, the observations do not fit the model. The dynamics of the reflected signal and the irregularities on the sonograph suggest in this case another explanation. In fact there is probably a tilt outwards. In Figure 14 an outward tilt of 15° is shown; it results in an under-estimation of the depth. For A = 150 m, a correction of 44 m has to be added to the calculated depth. If a correction is applied, based on 15° tilt outwards, the measured depth along the section AB is 140 ± 10 m. The irregularities on this section indicate a more recent calving (Figs. 15 a and b).
Finally, an example from the horizontal profiling experiment is presented, in which three profiles from the same area are compared. Section DE is shown in Figure 16 for three different recordings. Although there are differences on these recordings, the large-scale topographic features can be compared. This shows that the technique reproduces the actual topography in such a way that large-scale changes could be detected by comparing records. If a fairly constant towing geometry is sustained from one profile to the other, changes can be detected directly by comparing the different records. However, the interpretation of these changes in a three-dimensional sense requires a more sophisticated and detailed investigation.
A model showing how depth corrections have to be added when the side has an outward tilt of 15°.

Two different recordings of the corner A, show the transition from a smooth surface on EA towards the irregular section AB.

The section AB with a recently calved surface.

The three comparable recordings of section DE.

3.3 Vertical profiling
Vertical profiles were obtained at both Blaaenga and Kapp Norvegia. Figure 17 shows a sonograph of a vertical profile obtained at Kapp Norvegia. In Figure 18 this profile and an ice-front profile obtained off Blaaenga have been redrawn to scale. The ice front off Blaaenga is near-vertical and its draught is 200 m. This depth has been confirmed by radio echo-soundings in the same area (O. Orheim, personal communication). The profile at Kapp Norvegia has an impressive appearance, with an under-water ram protruding more than 180 m from the ice cliff. This is the only vertical profile obtained in this area. However, from the horizontal profile described previously, it may be inferred that the length and shape of the ram varies considerably from place to place.
Vertical profile of the Kapp Norvegia ice wall.

Vertical profiles redrawn to scale.

4 Conclusion
The experiments show that the use of standard SSS technique for mapping sub-surface parts of an iceberg is feasible. However, in order to interpret measurements accurately, a more sophisticated survey method is required. The vessel, and hence the SSS fish, would have to be positioned relative to the iceberg with an accuracy of ± 5 m. By combining horizontal and vertical profiling measurements a detailed topographic map of the sub-surface could be produced.
A hull-mounted sector-scanning sonar would probably be a more adequate instrument for these investigations. When operated in a side-scanning mode, this sonar can provide a vertical profile for each scan, thus making possible a more thorough survey of topographical features. However, commercially-available sector-scanning sonars usually operate at higher frequencies, thus having lower range capabilities. This might limit the range of observable depths.
Acknowledgements
We wish to thank our two colleagues, Børre Johansen and George H. Maisey, for their enthusiasm and assistance during the experiments. Thanks are due to Norsk Polarinstitutt for their financial support and for their organization of the expedition. Thanks are also due to “Icebergs for the Future” of Paris for their financial and professional support.



