1 Introduction
Parliamentary debate is, at its core, an expression of political conflict. Members of parliament (MPs) use the plenary to express their concerns, debate proposals, and communicate their stance on issues. The parliamentary debating arena, with its host of diverse expressed views, is a promising venue for measuring the political stance of MPs. This is especially the case since the (still) predominant roll call-based approaches do not travel well in parliamentary systems such as the UK (Spirling and McLean Reference Spirling and McLean2007; Hix and Noury Reference Hix and Noury2010). Here, voting is driven by career incentives and government allegiance rather than by preferences on specific bills (Benedetto and Hix Reference Benedetto and Hix2007; Kam Reference Kam2009). Voting against the party, then, must be seen as the “nuclear option” (Proksch and Slapin Reference Proksch and Slapin2015). Conversely, the rules of debate of the UK House of Commons—contained in the Standing Orders—grant MPs significant freedom to participate in debates.Footnote 1 As long as MPs vote with the party line, legislative speeches remain relatively unconstrained (Schwarz, Traber, and Benoit Reference Schwarz, Traber and Benoit2017).
In this paper, I propose that we should therefore focus on the aggregate level and use speech data to consider polarizationFootnote 2 between political parties. Political scientists have had a long tradition of applying unsupervised measurement models to gauge ideology and preferences from texts. However, the hope that the dominant source of variation in their data is related to the phenomenon they want to measure is often not realized. My main argument is that we should therefore rely on supervised estimation methods that include information on party affiliation. In contrast to their unsupervised siblings, such supervised models attempt to identify which speakers use a vocabulary that is similar to speakers from one versus another party, ensuring that variation in word use is related to a stable construct. To support this argument empirically, I apply supervised and unsupervised models to 6.2 million records of parliamentary speeches from the UK House of Commons (1811–2015).
The paper makes three contributions to the “text-as-data” literature. First, and most importantly, it addresses a long-standing debate in political science about the usefulness of supervised versus unsupervised approaches in text analysis with application to political preferences. Second, this paper presents a coherent framework for evaluating the performance of text-based measures of polarization, building on important work that seeks to challenge the often-applied strategy of conducting “some form” of validation (e.g. Quinn et al. Reference Quinn2010). Third, the paper makes a comparative assessment between one of the most commonly used text scaling models—Wordfish (Slapin and Proksch Reference Slapin and Proksch2008)—and a novel machine classification approach (Peterson and Spirling Reference Peterson and Spirling2018).Footnote 3 Through an application of both approaches over an extended time frame, this paper provides a comprehensive overview of the choices and pitfalls that researchers face when they apply text analysis tools to measure polarization from parliamentary speeches.
The relevance of the work presented in this paper extends beyond the text analysis field. Many theories of institutional design incorporate some element of polarization (e.g. Binder Reference Binder1996; Diermeier and Vlaicu Reference Diermeier and Vlaicu2011). The validation framework and applications presented here, as well as their evaluation, should enable researchers to select an appropriate measure of polarization to test a range of hypotheses from this literature in the UK context, as part of the new research agenda of British Political Development (BPD) (Spirling Reference Spirling2014).
2 Measuring Preferences Using Text
Until recently, the “text-as-data” approach to measuring political preferences focused on a narrow set of texts such as party manifestos (e.g. Laver, Benoit, and Garry Reference Laver, Benoit and Garry2003; Slapin and Proksch Reference Slapin and Proksch2008).Footnote 4 Recent advances in the processing of text data, the digitalization of records, and the development of new algorithms, have enabled researchers to shift the focus to parliamentary speeches, and the preferences of individual legislators (e.g. Lauderdale and Herzog Reference Lauderdale and Herzog2016; Schwarz, Traber, and Benoit Reference Schwarz, Traber and Benoit2017). This is an important innovation because, as pointed out above, the conventional roll-call votes-based approach to measuring ideal points does not travel well in the parliamentary context (see also Vandoren Reference Vandoren1990; Carrubba et al. Reference Carrubba2006; Carrubba, Gabel, and Hug Reference Carrubba, Gabel and Hug2008; Hug Reference Hug2010; Schwarz, Traber, and Benoit Reference Schwarz, Traber and Benoit2017). Here, the use of speeches to infer the ideological standpoint of legislators has two main advantages (cf. Proksch and Slapin Reference Proksch and Slapin2015, 7). First, speeches are less subject to partisan control than voting. Defection on votes can be seen as the ultimate act of defiance. In contrast, speeches afford MPs the opportunity to express dissent in a way that is less likely to harm their own or their party’s position. Second, even if such partisan control is not exercised, votes reduce an actor’s preferences to one of three options—in favor, against, or abstain—whereas speeches enable MPs to express their views in a more nuanced way.
Challenges
Yet, the use of text to measure political preferences certainly does not come without problems. Researchers need to account for the high-dimensional nature of speech data, i.e. the fact that not all phrases used by political actors, or by one such actor in a single speech, map onto the same latent concept. Traditionally, supervised Poisson scaling algorithms such as Wordfish have focused on election manifestos. Political actors spend a considerable amount of time and effort editing such documents to ensure that the topic of each part of the text as well as the message that it carries are beyond doubt. Consequently, researchers can easily identify the policy area that each section covers. In contrast, the world of debate and speech is much messier. Speeches are not exclusively related to the bill or item on the agenda. Rather, politicians often go off-topic, speaking to different matters, or combining their statement on the discussion topic with several other messages. Moreover, in most unsupervised scaling applications (e.g. Lauderdale and Herzog Reference Lauderdale and Herzog2016; Schwarz, Traber, and Benoit Reference Schwarz, Traber and Benoit2017) speeches are aggregated by actor at an appropriate level (e.g. for each debate), which means we potentially include many statements that are unrelated to the policy dimension that we are interested in.
Dimensionality becomes particularly problematic when applying unsupervised scaling models like Wordfish, which recover only one of many possible latent dimensions that can be extracted from speech data. We do not know a priori if that dimension—i.e. the axis that explains the largest degree of variation in relative word frequencies—maps onto the kind of political conflict that we want to measure. Moreover, language itself undergoes significant alterations over a 200-year time period. For example, the world “welfare” implied something very different in the 1800s than in the 1950s, when the welfare state as we know it today was constructed. As will become clear in the empirical analysis, the supervised and unsupervised approaches deal with this problem to varying degrees of success.
Validation
How then, can we assess whether a supervised or unsupervised model produces better results? Unsupervised methods come with significant post hoc validation costs, as the researcher “must combine experimental, substantive, and statistical evidence to demonstrate that the measures are as conceptually valid as measures from an equivalent supervised model” (Grimmer and Stewart Reference Grimmer and Stewart2013, 5). There are important examples of “best practice” in the validation of text-based measures of political phenomena (see in particular Quinn et al. Reference Quinn2010, who present a comprehensive framework for evaluating estimates of political attention (or: “topics”)). However, as it stands, there is no consistent framework for evaluating text-based measures of polarization with a set of simple, predefined tests that researchers can follow. This is problematic because, as researchers, we want to be able to compare the performance of several different methods against common standards. Such a framework needs to combine rigor with speed and ease: when evaluating a speech-based measure over a long time period (in this case, over 200 years), the post hoc validation needs to give us confidence in the results. At the same time, it should limit the costs of the validation exercise to allow us to reap the benefits (i.e. speed) of using an unsupervised method.
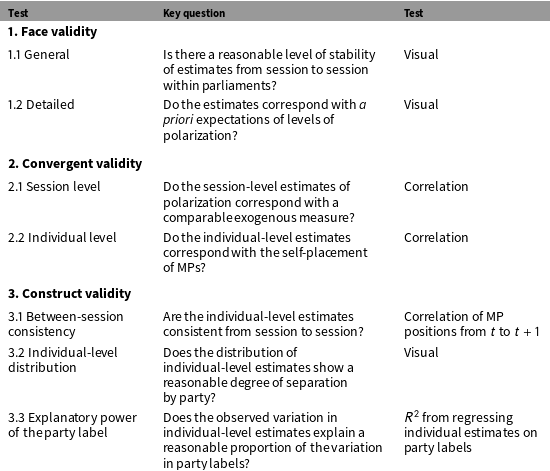
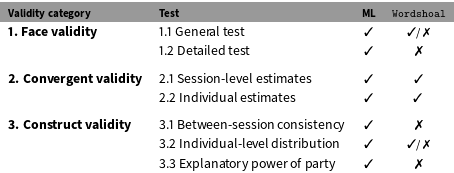
The framework for evaluating text-based measures of polarization developed in this paper is summarized in Table 1. It is divided into three types of validity (face, convergent, and construct), and includes several tests for each type.Footnote 5
Face Validity: First, we consider face validity, which includes both a general and a detailed benchmark. The general test is a quick and simple impression of the distribution of the estimates over time:
1.1 General test: The level of variability between sessions within the same parliament should be at a reasonable level: although we may expect some variation from session to session, we should not observe an at-random pattern of switches between high and low polarization from year to year, and especially within one parliamentary term.
However, as (Quinn et al. Reference Quinn2010, 216) rightly note, “[f]ace validity is inherently subjective, generally viewed as self-evident by authors and with practiced skepticism by readers”. This does not mean that face validity cannot be useful, if applied in a consistent way. A second, and more important face validity criterion of my framework therefore is that the measure must pass a detailed “historical test”:
1.2 Detailed test: Outliers in our estimates should correspond with a priori expectations derived from authoritative (secondary) sources.
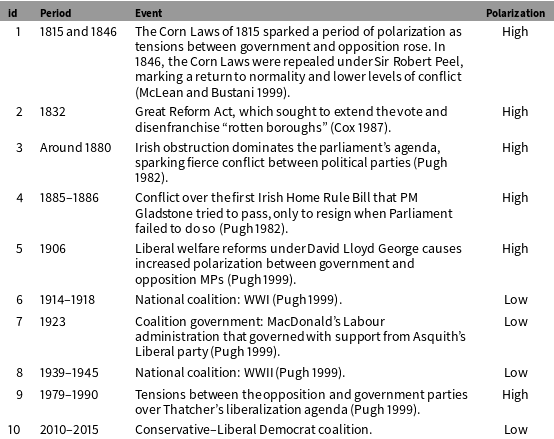
This test requires the researcher to, prior to estimating the measure, set out testable and specific expectations of historical outliers (low or high polarization) on the basis of authoritative secondary sources. In the UK case, we should observe an up-going trend in the levels of conflict over time, and especially after the 1880s as party organization takes hold. Specific periods of low and high polarization are outlined in Table 2.
Validation framework.

Detailed test (1.2): key outliers in polarization in the UK Parliament.

Convergent Validity: Second, the framework considers how well our estimates converge with results obtained with supervised methods, at two levels. First, at the aggregate level (here defined as the yearly parliamentary session), we should expect that levels of polarization correlate with other exogenously defined measures:
2.1 Session-level test: The level of polarization in sessions should correspond well with exogenously defined measures of polarization.
The second level considers the MP-level estimates:
2.2 Individual-level test: The positions of MPs should correlate with their own left–right placement from an exogenous dataset.
As speeches are a direct reflection of the political preferences of legislators (and to some degree of political constraints), we should observe a relatively high correlation between self-placement and our estimates.
Construct Validity: Third, the framework evaluates three measures of consistency relating to construct validity. First, we evaluate the variation in the position of MPs from session to session. We may expect the ideal point of legislators on a one-dimensional scale to vary somewhat because the agenda will include different items for each session. However, legislators should otherwise remain relatively consistent in their overall position across the issues discussed over the course of a parliamentary session:
3.1 Between-session consistency: The positions of MPs should correlate at a reasonable level between successive sessions.
Second, a visual test of individual-level scores can give some indication of the performance of a measure:
3.2 Individual-level distribution: The Empirical Cumulative Distribution Function (ECDF) of individual-level estimates should show a reasonable separation of parties and key individuals should be placed as expected.
In this context, “reasonable” primarily refers to: (i) a separation where individuals from the left-wing party are not found to the right of the right-most member of the right-wing party on the political spectrum; (ii) individuals do not drastically change position from one session to the next.
Third, the individual-level estimates should account for a reasonable proportion of the variation in party labels:
3.3 Explanatory power of the party label: The variation in individual-level estimates should be a good predictor of the party label for each session.
We can assess this third test by regressing individual estimates on the party label and taking the
 $R^{2}$
from the model. We want this proportion to reflect some degree of party control: i.e., the individual estimates should not be assigned at random. At the same time, some unexplained variation should remain as, for reasons elucidated above, the party should not structure speech completely.
Applying the evaluation scheme
The evaluation scheme has two applications—both of which will be used in this paper. First, it may be used to evaluate, comparatively, the merits of two or several different approaches to measuring polarization based on text. Second, it can be applied to establish whether or not a measure is “valid enough” to be used in other, more substantive applications.
When can we safely assume that a measure that we have generated with our text analysis algorithm has produced a “valid” measure? This is largely dependent on the time frame. For the application in this paper, the “threshold” is as follows:
Threshold: The measure should pass all tests of the evaluation scheme, but not for all sessions included in the analysis.
For a measure that spans 200 years, the general paucity of comparable measures of polarization means that some of the tests can only be conducted across a smaller time scale. The (obviously wrong but practically useful) assumption made here is that, if the test performs well for any session it should also perform satisfactorily for any other randomly sampled session. A “pass” then, is defined as satisfying a minimum level and performing better in comparison with other measures.
3 Case Selection & DataFootnote 6
The UK provides a promising institutional setting to develop text-based measures of polarization. Its legislative process affords MPs ample opportunity to voice policy-related opinions—the kind of statements that we expect to reveal ideological preferences. Today, the legislative process for public bills in the Commons consists of three readings, and includes six distinct stages. After presentation (stage 1: first reading), each bill is subject to a general debate (stage 2: second reading), and after a committee stage (stage 3), a detailed debate (“report stage”, stage 4) during which MPs discuss the committee’s amended bill and may propose amendments, followed by a final third reading (stage 5) at which the final version of the bill may again be debated (but no amendments may be proposed) (see Standing Orders of the House of Commons—Public Business 2016, arts. 57–83).
At the end of the third reading, a vote is taken whether to approve the bill. This stage is followed by a similar set of readings in the House of Lords. After the third reading in the Lords, the bill is sent back to the Commons, giving the latter the opportunity to debate and review the Lords’ amendments, and to propose their own (stage 6). After this stage, the bill may receive “royal assent”, bringing it into effect. In sum, there are no fewer than four opportunities for legislators to engage in plenary debate on a bill (stages 2, 4, 5, and 6).
Over the entire period studied in this paper, members of parliament remain relatively free to engage in debate, thereby avoiding the problems of nonvoting and selection that undermines roll-call based analyses. Most changes to curb the speaking rights of MPs were, over the time period studied, introduced at the macrolevel of agenda rights or the timetable.Footnote 7 For an MP to speak, it suffices for her to rise from her chair, after which the Speaker may give her the floor. Thus, it is the Speaker—by all intents and purposes a neutral institution—who decides who speaks; not the party. Moreover, members may submit amendments freely at the report stage, giving them ample opportunity to put forward their views.
To implement the text algorithms that I shall outline below, I use newly collected data from the UK House of Commons Hansard archives. The dataset includes 6,224,352 speeches from 1811 and 2015, spanning 233 parliamentary sessions from the 5th session of the 4th Parliament, up until and including the final session of the 55th Parliament.Footnote 8 Details of the data gathering process, preprocessing decisions, and a procedure for removing procedural phrases are provided in Appendix A in the on-line supplementary materials.
4 Unsupervised versus Supervised Models
The core difference between unsupervised and supervised models—and the reason why we may expect them to produce different results—lies in the way they use variation in data to yield estimates. Unsupervised models attempt to describe variation in word use. The scores that these models produce identify which speakers tend to use similar words to one another, whether overall or within debates. These estimates may or may not prove to have anything to do with the party, or indeed to have any stable structure over different debates or sessions. The results could be completely confounded by different speakers talking about different topics, or other sources of variation in word use. By contrast, the supervised variant is designed to find variation in word use that predicts party labels. The scores from the supervised models identify which speakers tend to use similar words to speakers from one party versus speakers from the other party. These estimates are guaranteed to be driven by the “party factor”, regardless of the number of topics that are addressed, or other sources of variation in word use. When dealing with the messy world of text data, supervised approaches should therefore be expected to perform better than their unsupervised siblings.
Unsupervised models: Poisson scaling
The first two models applied in this paper are of the unsupervised variant, and are adapted forms of the Wordfish algorithm. This Poisson scaling model is the most appropriate for our purposes.Footnote 9 First, recent applications have successfully employed the model to the study of ideal points in legislatures, when applied at the debate level. Schwarz, Traber, and Benoit (Reference Schwarz, Traber and Benoit2017), for example find in a study of the Swiss legislature based on an energy policy debate (2002–2003) that speech-based estimates reveal larger differences of ideology within parties than roll call-based measures. In turn, Lowe and Benoit (Reference Lowe and Benoit2013) find a high correspondence between human coding of texts from the austerity budget debate in the Irish legislature (2009) and Wordfish estimates. Second, although some have argued that correspondence analysis (CA) (Greenacre Reference Greenacre2016)—the least-squares sibling of Wordfish—is a more appropriate technique (Lowe Reference Lowe2013), in practice, Wordfish is more robust to outliers in word use (Lauderdale and Herzog Reference Lauderdale and Herzog2016).Footnote 10
Wordfish is a statistical model that allows users to estimate a latent position of an actor on the basis of word frequencies (Slapin and Proksch Reference Slapin and Proksch2008). Its introduction marked an important advantage over previous techniques, as it allows for time series estimates, does not require reference texts, and relies on the words used in each document and provides the contribution of each term to a given estimated position of that document. Each text included in the Wordfish model is treated as a separate position, and all positions are estimated simultaneously. Crucially, as Wordfish is an unsupervised approach, we do not include prior information about the position of the actors in the model. When applied to collections of speeches by individuals in a legislative session—as opposed to the original application to party manifestos over time—we therefore obtain a distribution of latent positions of those legislators vis-à-vis one another in a one-dimensional space.
Dimension-level scaling
Wordfish lives by the assumption of unidimensionality: it assumes that the principal dimension extracted from the texts represents their political content. If we wish to know the position of actors on a specific policy dimension such as the economy, we would therefore have to run the model on texts where we know ex ante that they express the actors’ views about the economy (Slapin and Proksch Reference Slapin and Proksch2008, 711). Indeed, the main challenge when estimating ideological positions from speeches with Wordfish is to pin down the dimension of interest. Ex ante, we need to minimize variation in word use that relates to dimensions other than the one we wish to extract. In the model’s original application to manifestos this proved relatively straightforward as titles and subtitles in written manifestos allow for classification of topics; with speeches, political actors are more likely to go off-topic and dedicate (parts of) their speech to matters not related to the (policy) dimension that is on the agenda. Simply looking at the titles as recorded in Hansard will therefore not yield the desired result. The first strategy applied in this paper deals with this dimensionality problem by including a dictionary, classification, and scaling stage.
Prior to the estimation stage, I create a dictionary (stage 1) and apply a classification algorithm (stage 2) to identify speeches that are related to one specific policy area (or dimension): the economy. At the first stage, I construct a dictionary of economy-related terms on the basis of the Comparative Manifesto Project (CMP, Volkens et al. (Reference Volkens2016)) dataset, complemented with a number of terms specific to the UK context. Subsequently, at the second stage, I train a stochastic gradient descent (SGD) classifier to these data, and use the trained model to sort all speeches into the economic and noneconomic categories.Footnote 11 At the last and final stage, I apply Wordfish to recover estimates for the position of legislators on a specific policy dimension within a parliamentary session.Footnote 12
Debate-level scaling: Wordshoal
A second approach to deal with the high-dimensional nature of text data is to estimate legislator positions at a more granular level (i.e. within debates) and devise an appropriate way to aggregate estimates across different axes of conflict. This is the solution offered by Lauderdale and Herzog’s “Wordshoal” (Reference Lauderdale and Herzog2016). Here, we first use the standard unidimensional Poisson scaling model Wordfish (Slapin and Proksch Reference Slapin and Proksch2008) to estimate debate-specific legislator positions, and subsequently apply Bayesian factor analysis on the sparse matrix of debate-specific legislator positions on each debate to recover their latent position.Footnote 13
At the first stage of the estimation, we have to establish what constitutes a debate. Here, I follow (Lauderdale and Herzog Reference Lauderdale and Herzog2016, 14), who define a debate as set of contributions that share the same title, made on the same day, with a minimum of five speakers. For the estimation, speeches are concatenated per speaker for each debate, leaving us with 764,828 texts across 71,501 debates.
A comparative assessment of dimensionality
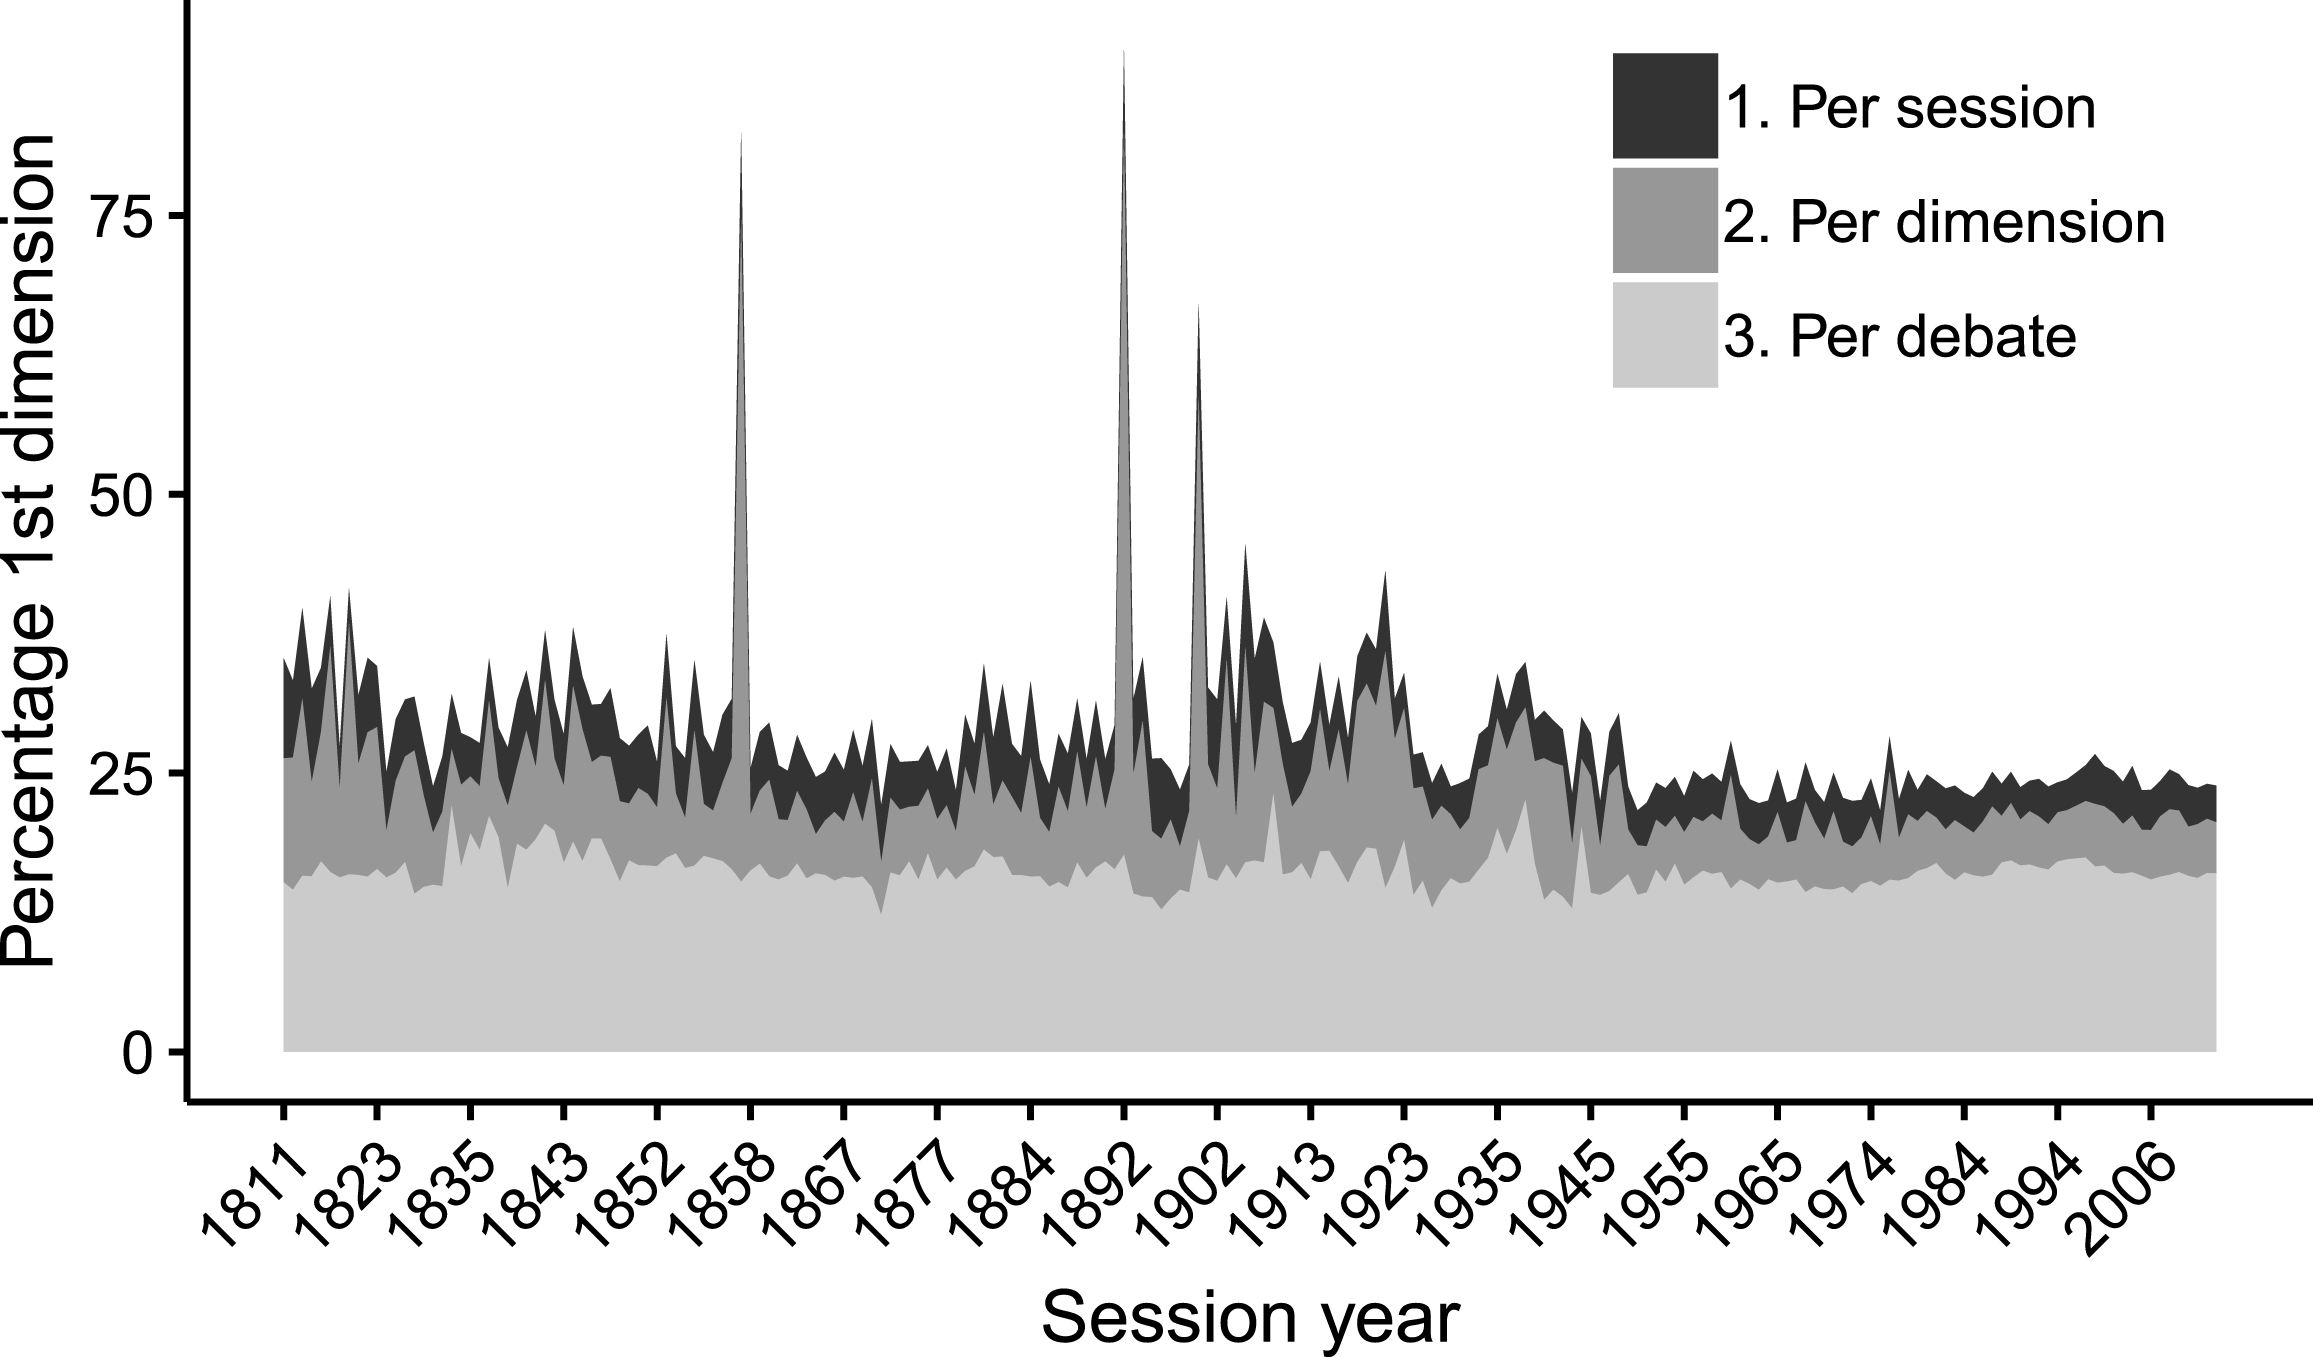
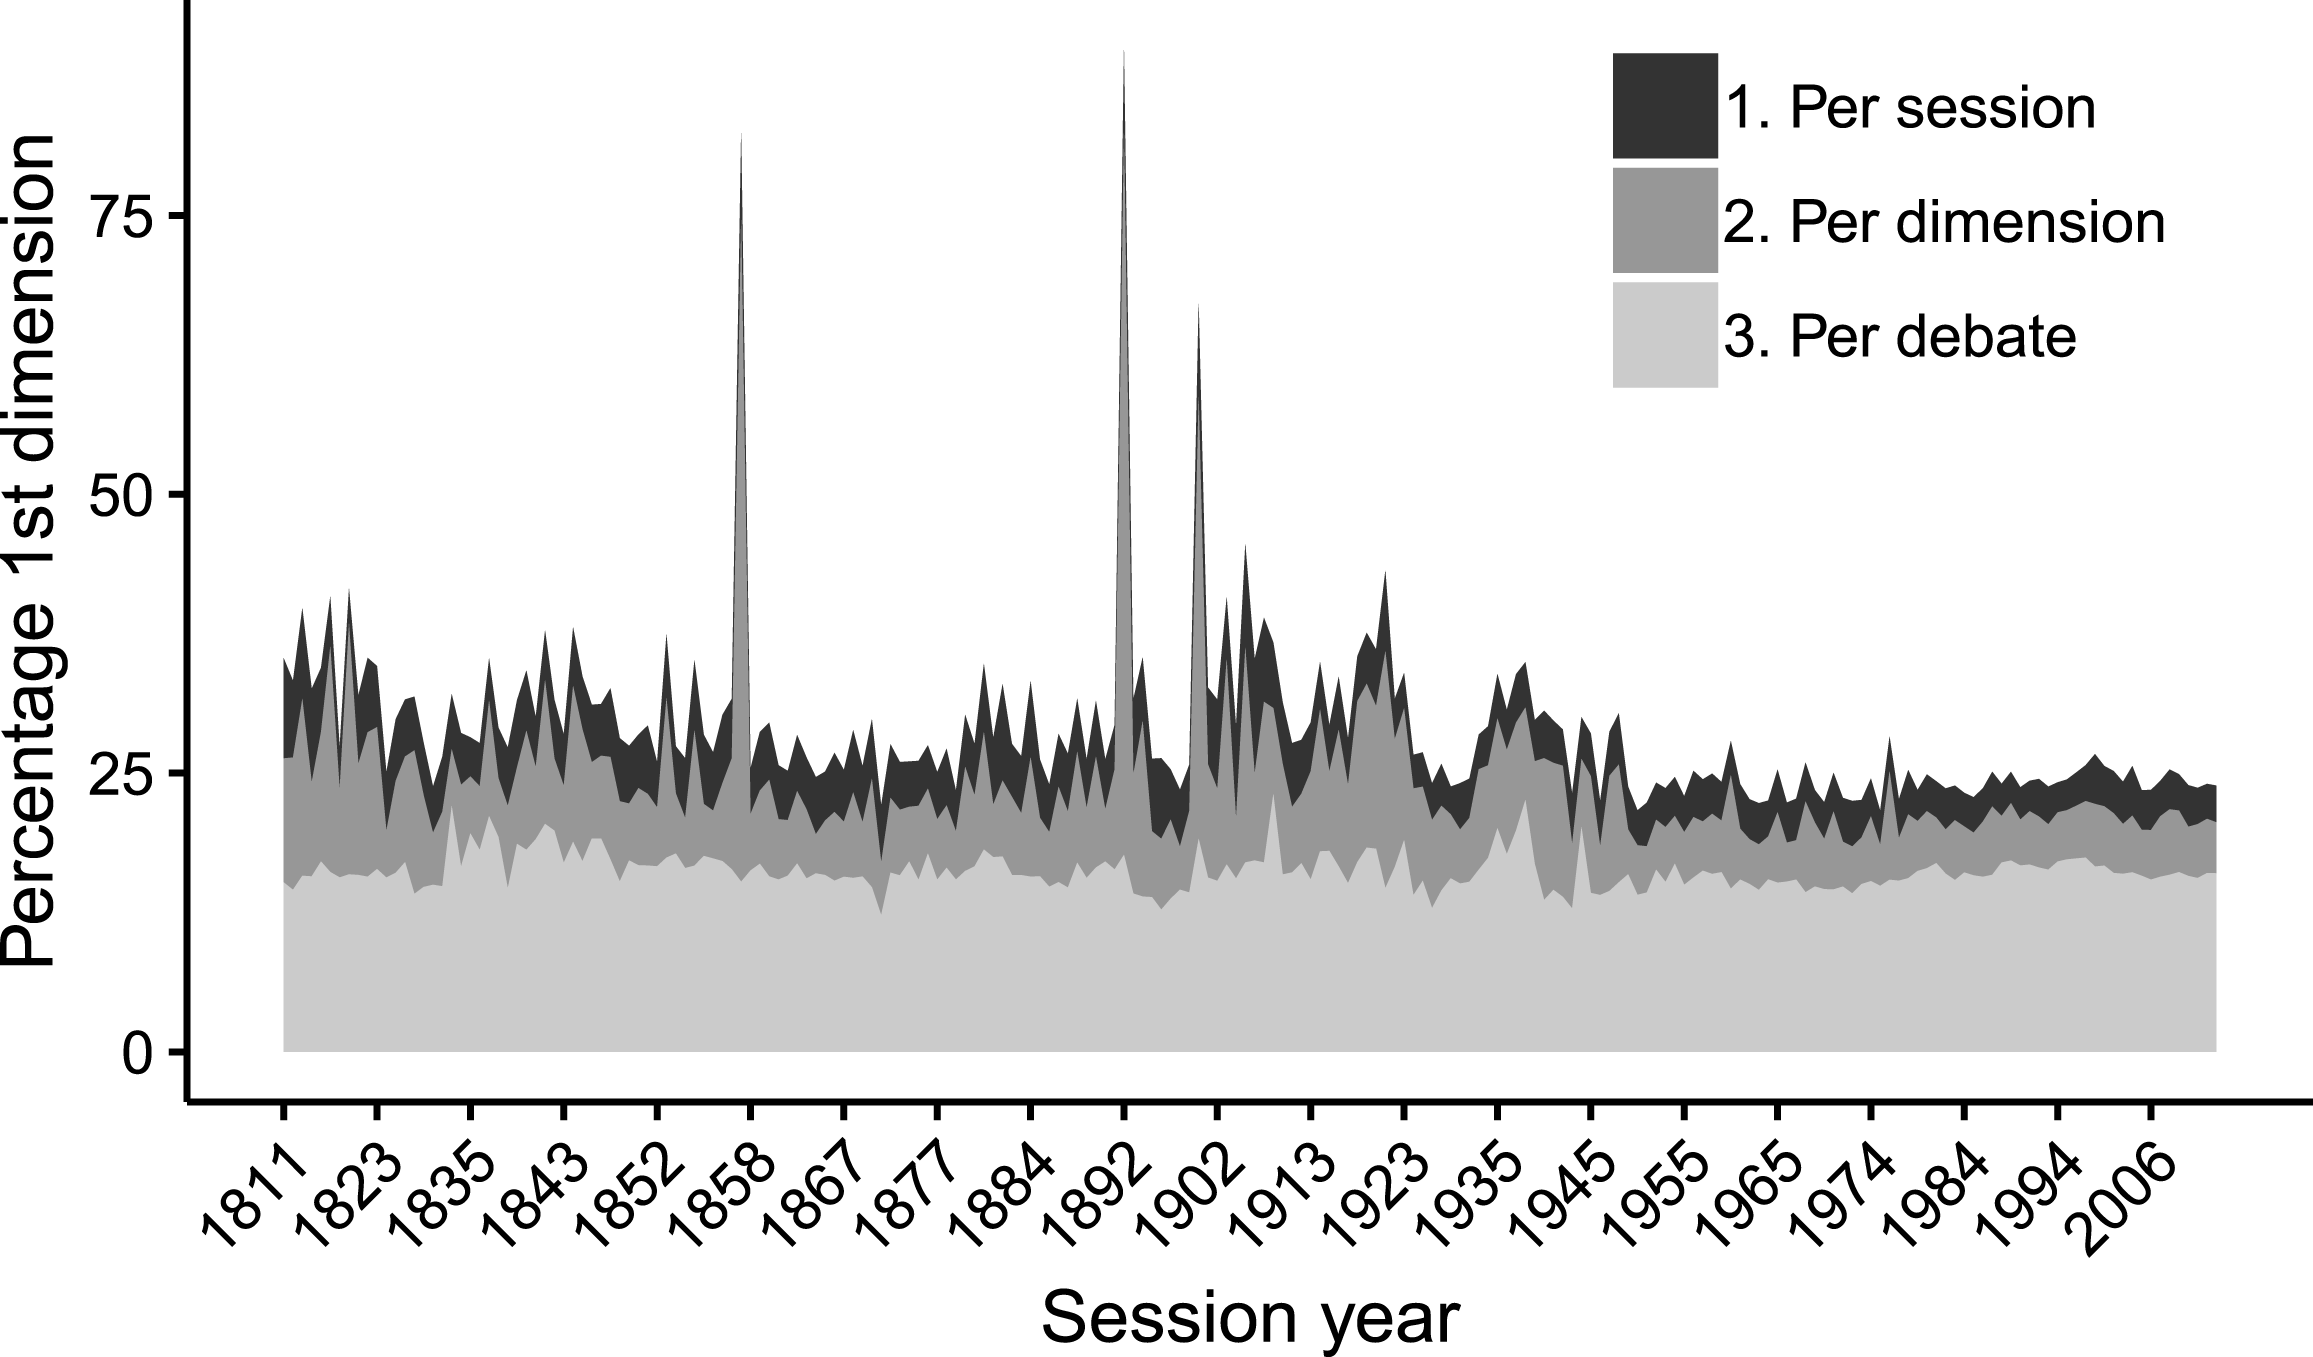
Like all text scaling models (or even simple cluster analyses or multidimensional scaling techniques), Wordfish tries to estimate a lower-dimensional, and simpler representation of the text data. The algorithm however estimates only one dimension, and, we thus have to be able to reasonably assume that this particular axis represents the main angle of “conflict” between actors. We then have to assume that variation in word usage is truly associated with the underlying latent dimension of conflict, rather than with simple topic variance. This raises a problem: the estimated level of polarization may not be based on ideology-related divergence, but instead on variation associated with the topic on which legislators speak. Rather than one, the debates involve multiple axes of conflict. The advantage of the two approaches outlined above is their ability to limit such topic-related variation. We can demonstrate this by considering the percentage of variation accounted for by the first axis from applying CA to the same data, which recovers multiple dimensions (Lowe Reference Lowe2013). This statistic is summarized for both approaches in Figure 1 below, which also includes a measure for baseline comparison that simply combines speeches for each legislator across all debates within sessions.
Stacked distributions of the perc. of variation explained by the first axis recovered by CA. “1. Per session” = speeches aggregated per session for each legislator; “2. Per dimension” = dimension-related speeches preselected using a classifier and subsequently aggregated for each speaker for each session; “3 Per debate”: speeches are aggregated by legislator for each debate and the model is estimated at the debate level.
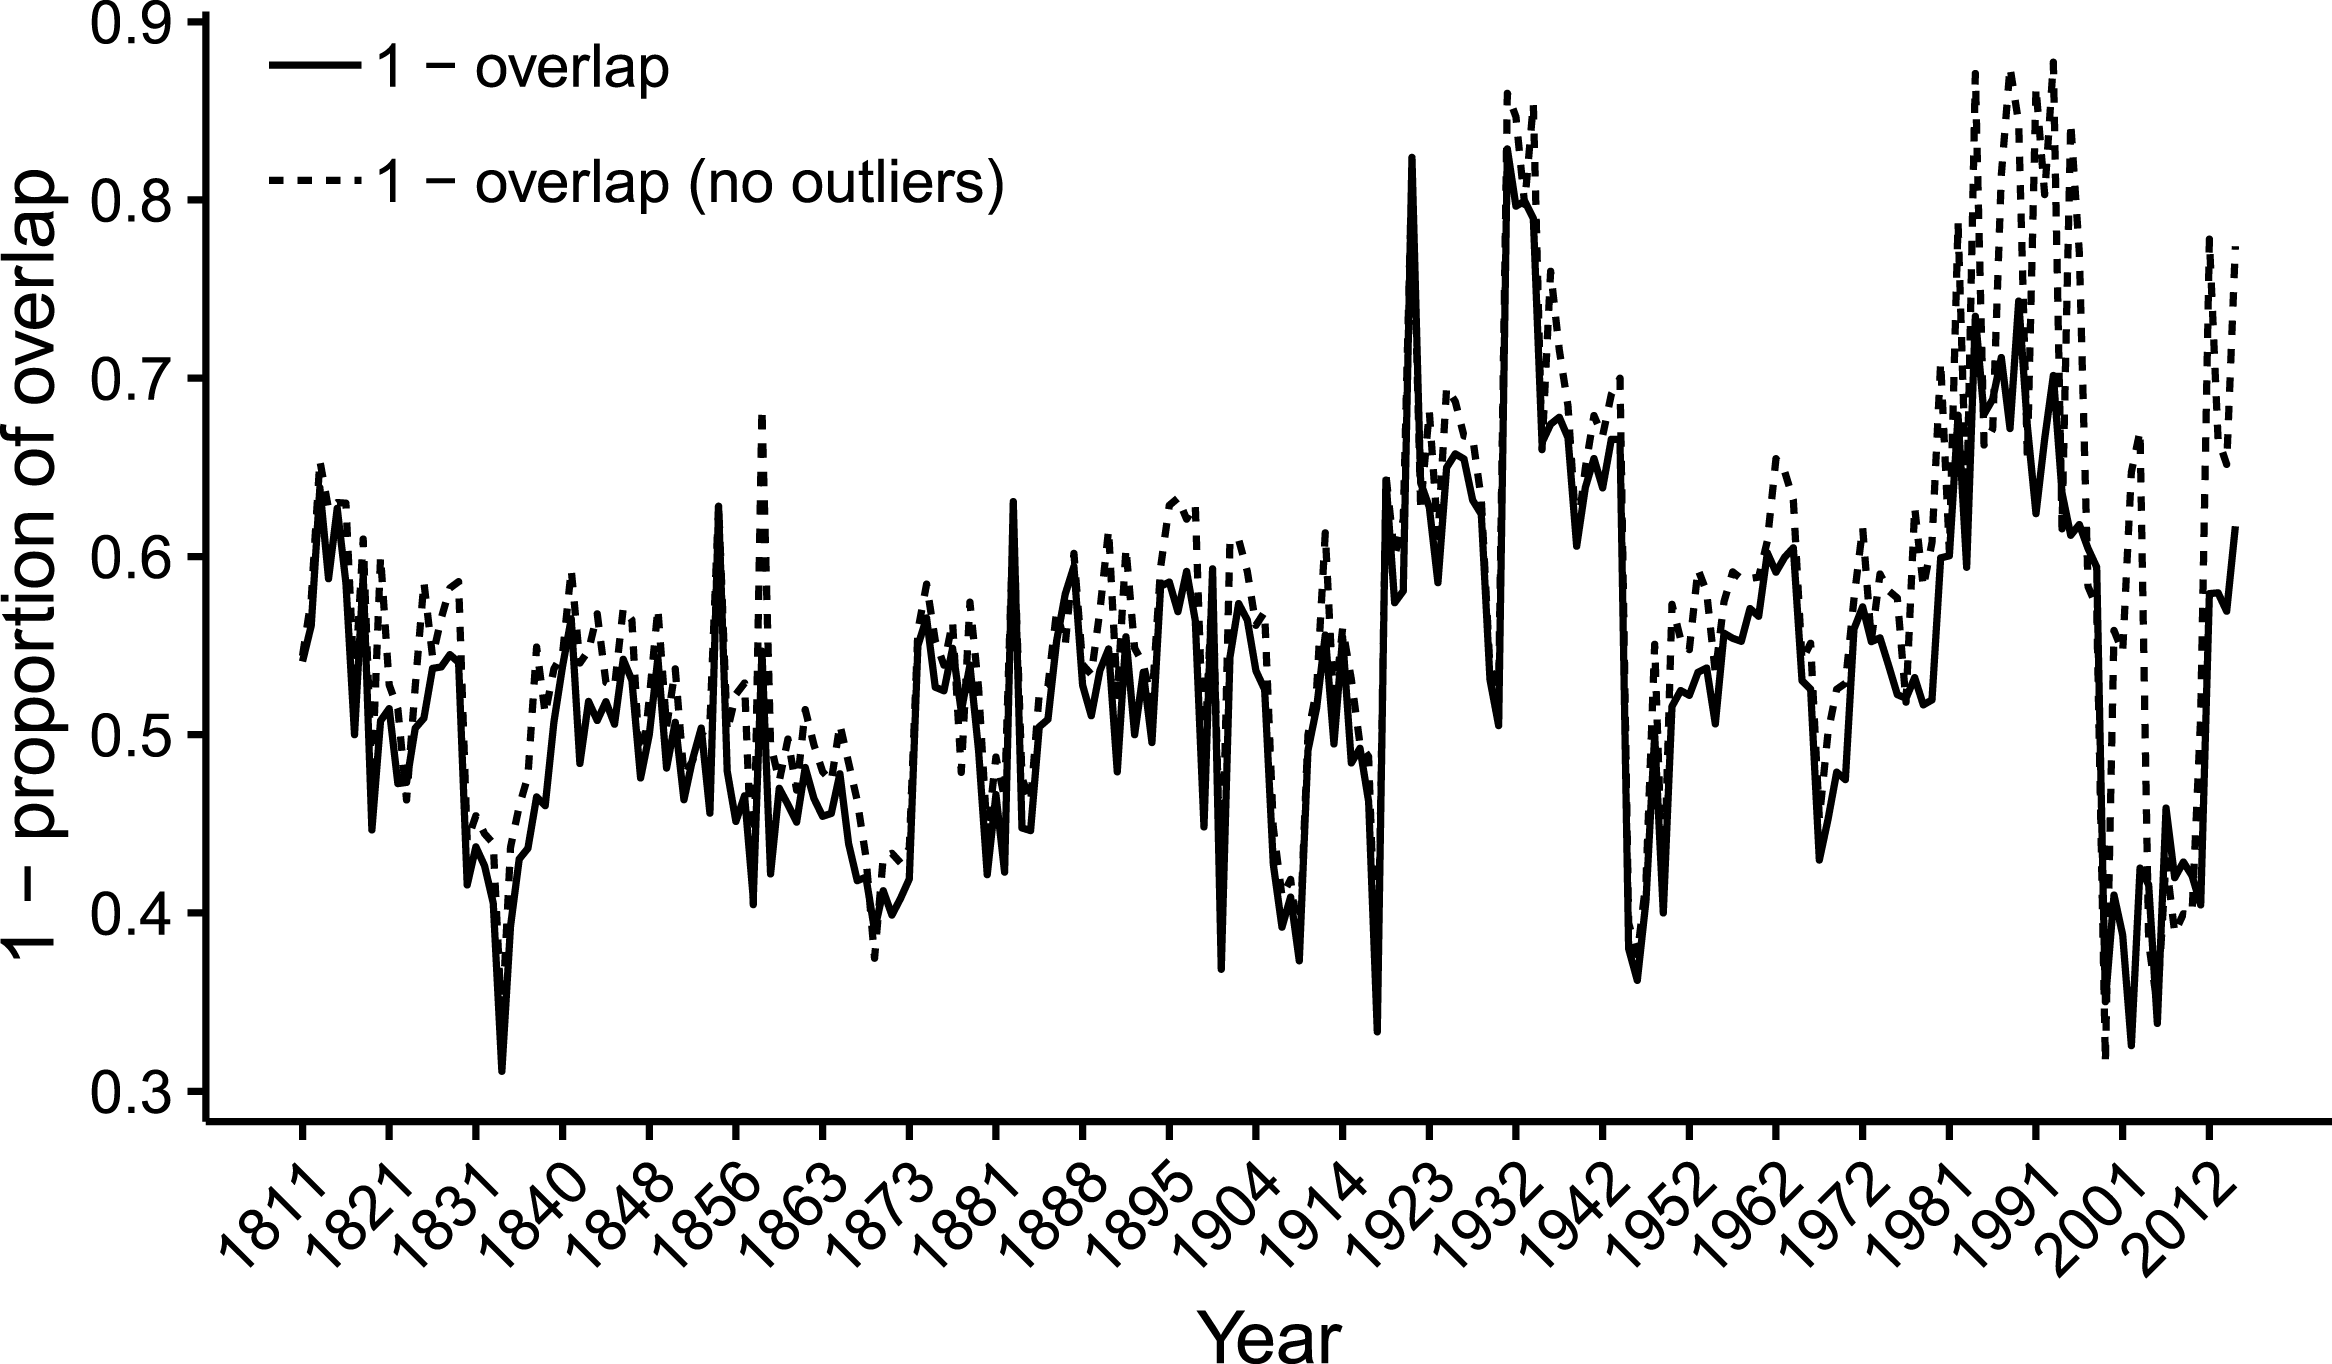
Wordshoal-based polarization estimates for 1811–2015.

In the baseline approach, the principal axis of variation explains 4.7 percent on average.Footnote 14 The first strategy—which involves preselecting speeches based on a dictionary and machine classifier step—yields a significant improvement. When we only retain speeches that have a 75 percent or higher probability of falling in the economy category, this approach produces models where the first dimension explains 5.57 percent. When we increase the threshold to 99 percent, this rises to 8.09 percent.Footnote 15 When we reduce dimensionality further, by scaling legislators within debates (i.e. the Wordfish estimates from the first stage of Wordshoal, prior to factor analysis), we see a significant improvement: here, the variation explained by the first axis rises to 16.26 percent on average.Footnote 16
From ideal points to polarization
Based on the above, I conclude that Wordshoal is best able to recover a meaningful dimension of conflict. Subsequently, I measure polarization by “dummying out” the changes in the relative placement of legislators from session to session.Footnote 17 Specifically, I measure polarization as the number of legislators of the right-most party that falls within the range of the distribution of legislator ideal points of the leftmost party, as a proportion of parliament. To evaluate and reduce the effect of outliers, I also implement this second measure while only retaining legislators for the leftmost party whose position falls below the 95th percentile; and for the right those that fall above the 5th percentile.Footnote 18 In both cases, I compute the polarization score by subtracting the proportion obtained from one. Figure 2 below plots the results.Footnote 19
The measure thus captures the consistency with which MPs fall within their party label across multiple policy issues. A score of “1” represents perfect polarization, with zero overlap between the main parties on the right and left of the political spectrum.
5 Supervised Models: Machine Classification
We will now move beyond the shortcomings of unsupervised methods, and turn to a supervised model instead.Footnote 20 Specifically, I build on a novel machine classification approach (cf. Peterson and Spirling Reference Peterson and Spirling2018), which ensures that we model variation related to the quantity of interest: polarization.
Polarization as partisan language
The classification accuracy approach of measuring polarization is based on a simple assumption of how language is generated that is similar to that of Wordfish. Language use reveals partisanship. In the US Congress, Republicans refer to “death taxes” and “illegal aliens”, while Democrats will speak of the same issues using phrases such as “estate taxes” and “undocumented workers” (cf. Gentzkow, Shapiro, and Taddy Reference Gentzkow, Shapiro and Taddy2016). In the UK, Conservatives might refer to a cut in benefits as “reducing dependence”, while Labour may speak of a “benefits squeeze”.
A key difference between unsupervised models and this supervised classification approach is that we introduce extra information—the party label. We therefore no longer have to limit the set of speeches that we feed into the model of political conflict a priori, as the party label is used to “pin down” the main axis of conflict. Instead of extracting one latent dimension, this supervised approach uses algorithms to identify the features (i.e. terms) associated with a particular party affiliation from labeled political speeches. These features, identified in the context of the complete body of texts to which the model is fitted, help us identify how partisan a particular speech (on the economy, foreign policy, welfare, etc.) is in relation to the corpus of speeches by that legislator’s party.
The trained model “knows” how members of party A typically speak—it has “learned” the features of that party’s language—and estimates the probability of an individual belonging to that party A for each speech that we “ask” it to predict.Footnote 21 As a basic intuition, a polarized parliament consists of groups that choose to use very distinct language; and an unpolarized legislature includes MPs who are linguistically proximate to members of their own party. Style, sub-topic, and other semantic differences are used strategically by legislators to make a point. The level to which this accords with a particular “party label” as predicted by a trained model thus reveals the degree of partisanship of the member.
This approach is particularly well-suited to high-dimensional data because we avoid the problem of issue space altogether. Disagreement is instead reduced to one dimension: language use. This broadens the concept of “ideology” as it is usually defined in the literature (see also Gentzkow, Shapiro, and Taddy Reference Gentzkow, Shapiro and Taddy2016; Peterson and Spirling Reference Peterson and Spirling2018). However, it can be seen as an efficient and appropriate approach if we accept the assumption that all—or at least a majority—of an MP’s linguistic choices are informed by political considerations.
Implementation
To measure legislator preferences and parliament-level polarization, I apply the SGD classifier algorithm with a log loss function and l2 regularization (Bottou Reference Bottou, Bousquet, von Luxburg and Rätsch2004).Footnote 22 In simple terms, the classifier algorithm is fitted to a randomly selected sample of speeches (i.e. the “training set”) to identify what words and phrases are associated with a particular “class” (here: the party label). Subsequently, the algorithm is used to predict the party label of a second sample of test data from that same year. The degree to which language can accurately predict the party label is a measure of polarization.
Following Peterson and Spirling (Reference Peterson and Spirling2018), I use
 $k$
-fold stratified sampling from each dataset of yearly speeches. Each year is randomly partitioned into twentyfolds of equal size while retaining the balance of party labels. Subsequently, one of the
 $k$
subsamples is reserved for testing and the remaining
 $k-1$
folds for training. By cross-validating twentyfold, I obtain individual-level partisan scores for each legislator using probability estimates for each label. In other words: the probability of any individual speech belonging to one “class” or the other represents a legislator’s “partyness” on that particular occasion. The mean probability of belonging to their party across all the individual’s speeches for a time period
 $t$
represents that legislator’s partyness for that period
 $t$
.Footnote
23
In contrast to Peterson and Spirling, I include all parties in the estimation, rather than the Conservatives and Liberals/Labour alone.Footnote 24 As the model’s predictions depend on the data on which it is trained the inclusion of other, smaller parties are bound to affect the estimates, especially since different parties are more invested in some debates than in others. For example, between 2013 and 2014, Scottish independence featured prominently on the House’s agenda.Footnote 25 , Footnote 26 , Footnote 27
Results
For the estimation, I again use the cleaned-up data outlined above, which contains only speeches longer than fifty words, limited to entries with successful party label matches, and excluding procedural phrases. I implement SGD with class weights to balance between parties.Footnote
28
,
Footnote
29
What drives our estimates, shown in Figure 4? As we are fitting a predictive model, a reasonable assumption would be that individuals who speak more—frontbenchers—have higher leverage on our predictions. We can verify this claim by considering the association between the status of speakers and the degree to which they are partisan—i.e. the probability of their party label. Here, I take the individual-level estimates of speeches for each session for the incumbent party and run a binary logistic regression to regress individual-level positions on a dichotomous response variable that captures frontbench status (frontbench = 1; nonfrontbench = 0).Footnote
30
This produces a log odds of 10.1 (
 $p<0.001$
). A (one-sided) t-test also shows that there is a statistically significant difference in mean polarization between the sample of frontbench and nonfrontbench MPs, with the former being higher.Footnote
31
There thus is evidence to suggest that our estimates in part reflect the proximity of a party’s members to their ministerial team.
6 Validation Exercise
This section turns to validation exercise, the purpose of which is to demonstrate the usefulness of the validation framework, and to identify the estimation procedure that generates a measure that best maps onto our concept of polarization. From the implementations above, two candidates emerged: (i) a measure of overlap between parties’ ideal points from an unsupervised Wordshoal model; and (ii) the predictive accuracy from a machine classifier that is trained on labeled speeches from different parties, with weights to account for imbalances between parties. The estimates from these approaches do not correspond closely (
 $\unicode[STIX]{x1D70C}=0.13$
at
 $p=0.04$
), making a validation exercise even more pertinent. Table 3 above shows the performance of the estimates in accordance with the validation framework.
Validation scores.

Illustrated plot of the accuracy of the SGD classifier for each session of the UK House of Commons for 1811–2015 (details described in text).

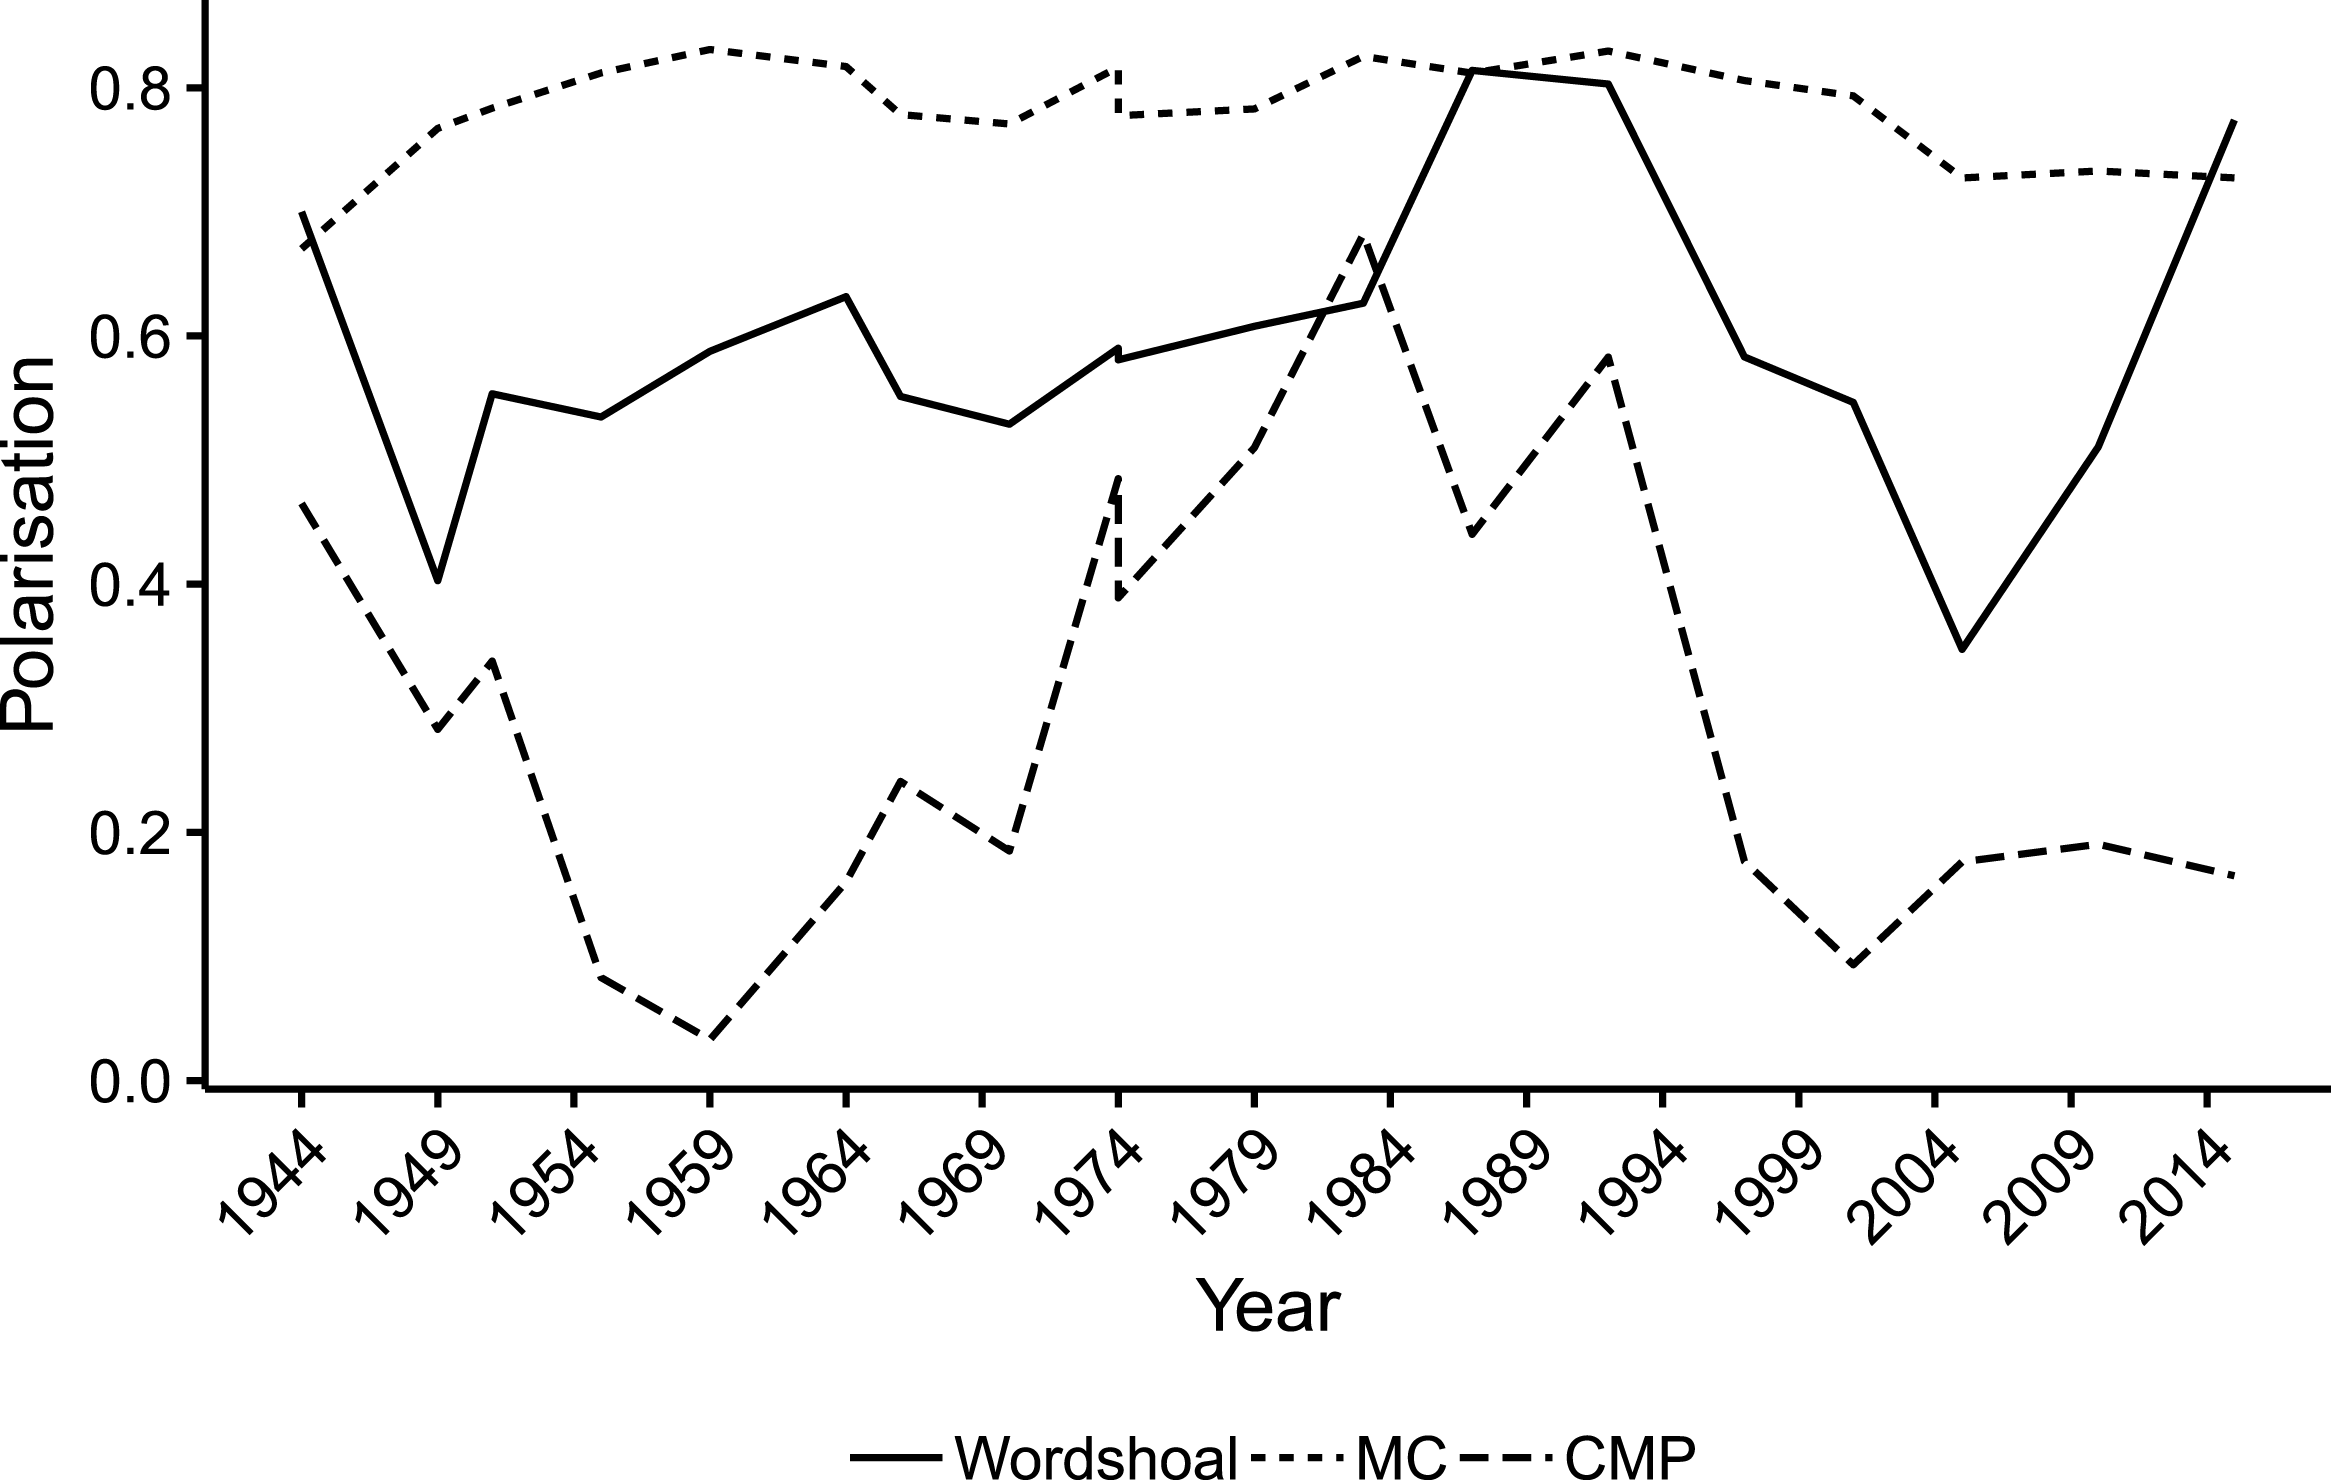
Comparison of estimates with Comparative Manifesto Project rile scores. Measures of polarization based on Wordshoal, the SGD classifier, and the rile scores respectively, for each election year covered by the CMP data.

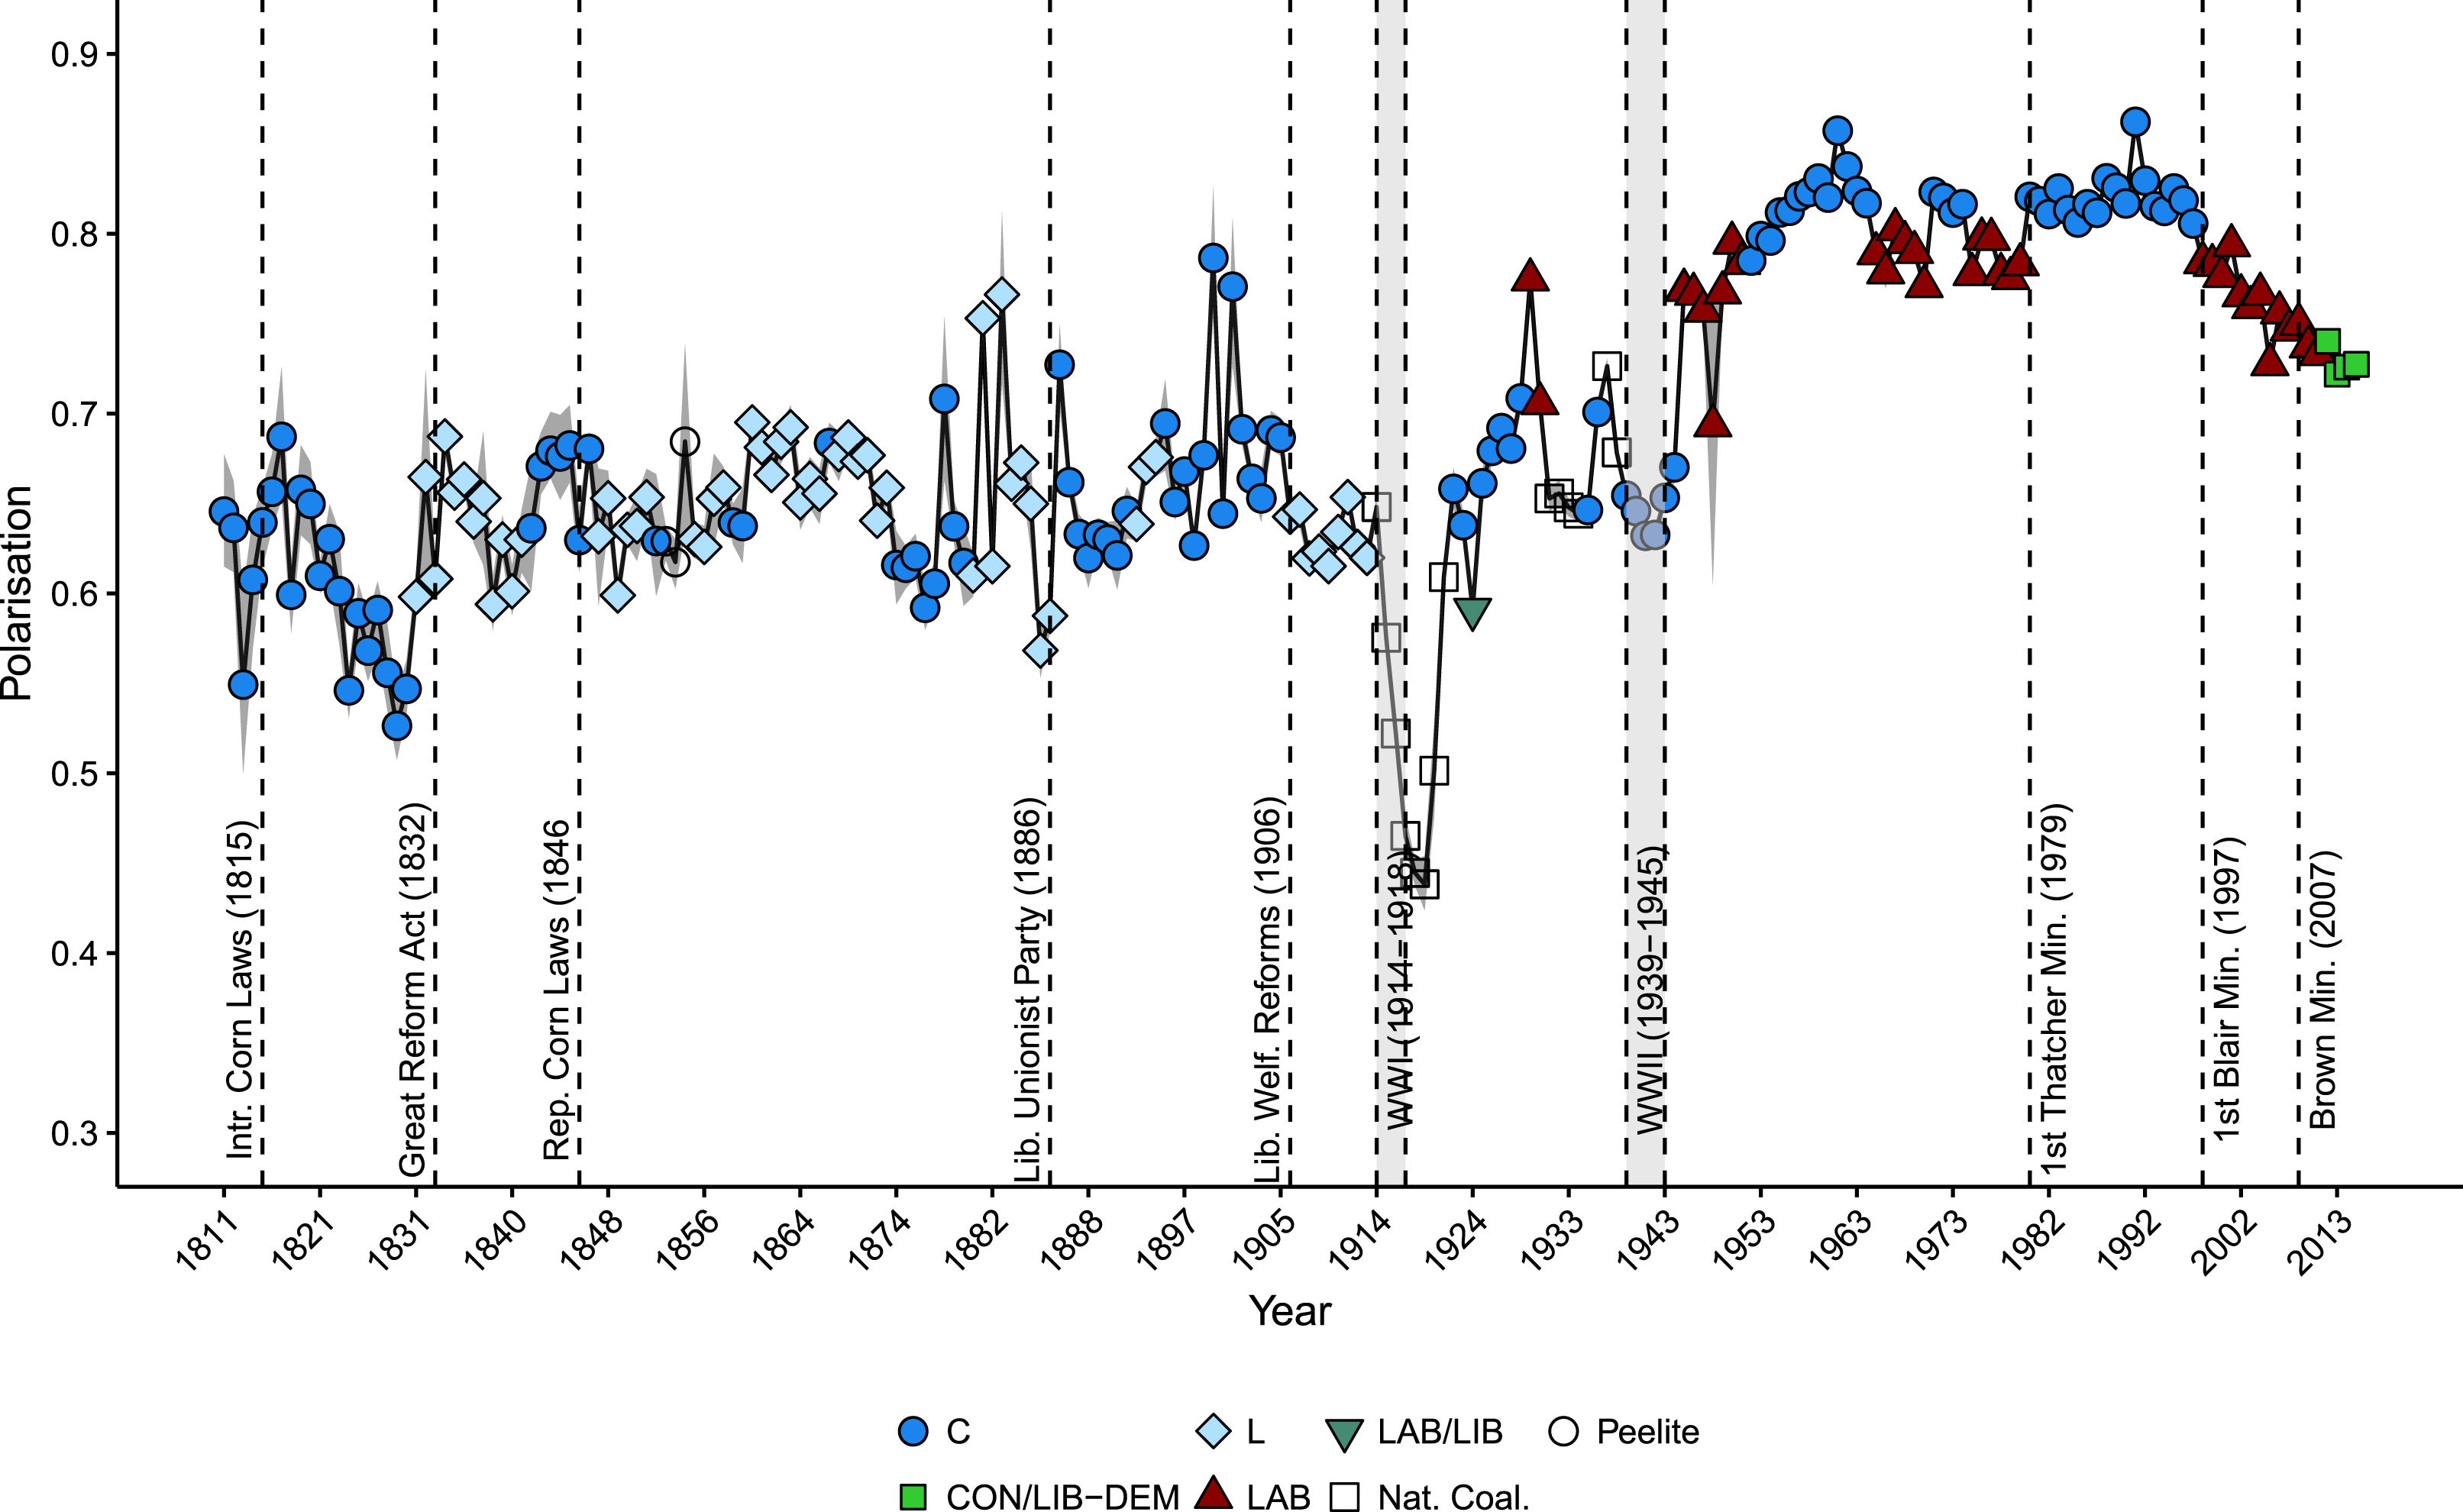
An important quality of meaningful estimates from text-based measures of polarization is that they should correspond with our expectations of how the measure develops over time. As part of this face validity criterion, the general test (1.1) considers the stability of estimates within parliaments. One element of immediate concern is the implausibly high level of variability shown in the estimates within parliaments for the Wordshoal-based measure (Figure 2). The changes are dramatic, suggesting an almost random pattern of switches between high and low levels of polarization that are uncorrelated between sessions. By contrast, the measures derived from the classifier yield more stable results (Figure 3), with relatively high correspondence between sessions within a parliamentary term that appear to map onto a “stable political space”.
At a more granular level, the detailed test (1.2) similarly suggests that the machine classifier is able to produce estimates that correspond to our a priori expectations in a way that Wordshoal cannot. Figure 3 shows that this first measure corresponds well with important historically identifiable outliers in polarization (Table 2). Polarization grows in the wake of the Corn Laws (Table 2, id 1) and of the 1832 Reform Act (id 2), and is generally higher in the period after 1880 (ids 3 & 4). The formation of the Liberal Unionist party in 1886 appears to mark the start of a period during which members did not fall consistently within their party label, which explains the rather dramatic drop in that year. Although they generally agreed with the Conservatives on Ireland, they were still classed as “Liberals” (at least for part of the time), which makes aggregate polarization look very low.
After 1906, at the start of the Liberal Welfare Reforms, we see greater polarization over these “controversial” new policies (id 4). As one would expect, we also see less conflict between members of different parties during WWI and WWII (ids 6 & 8), and during the 1923 MacDonald Ministry (id 7), with levels picking up further after the 1945 landslide Labour election victory. Finally, while the Thatcher ministries of 1979–1990 appear to be highly polarized (id 9), a decline in polarization may be observed with the start of the Brown government (2001) and of the coming into office of the Conservative–Liberal Democrat coalition (2010) (id 10).Footnote 32
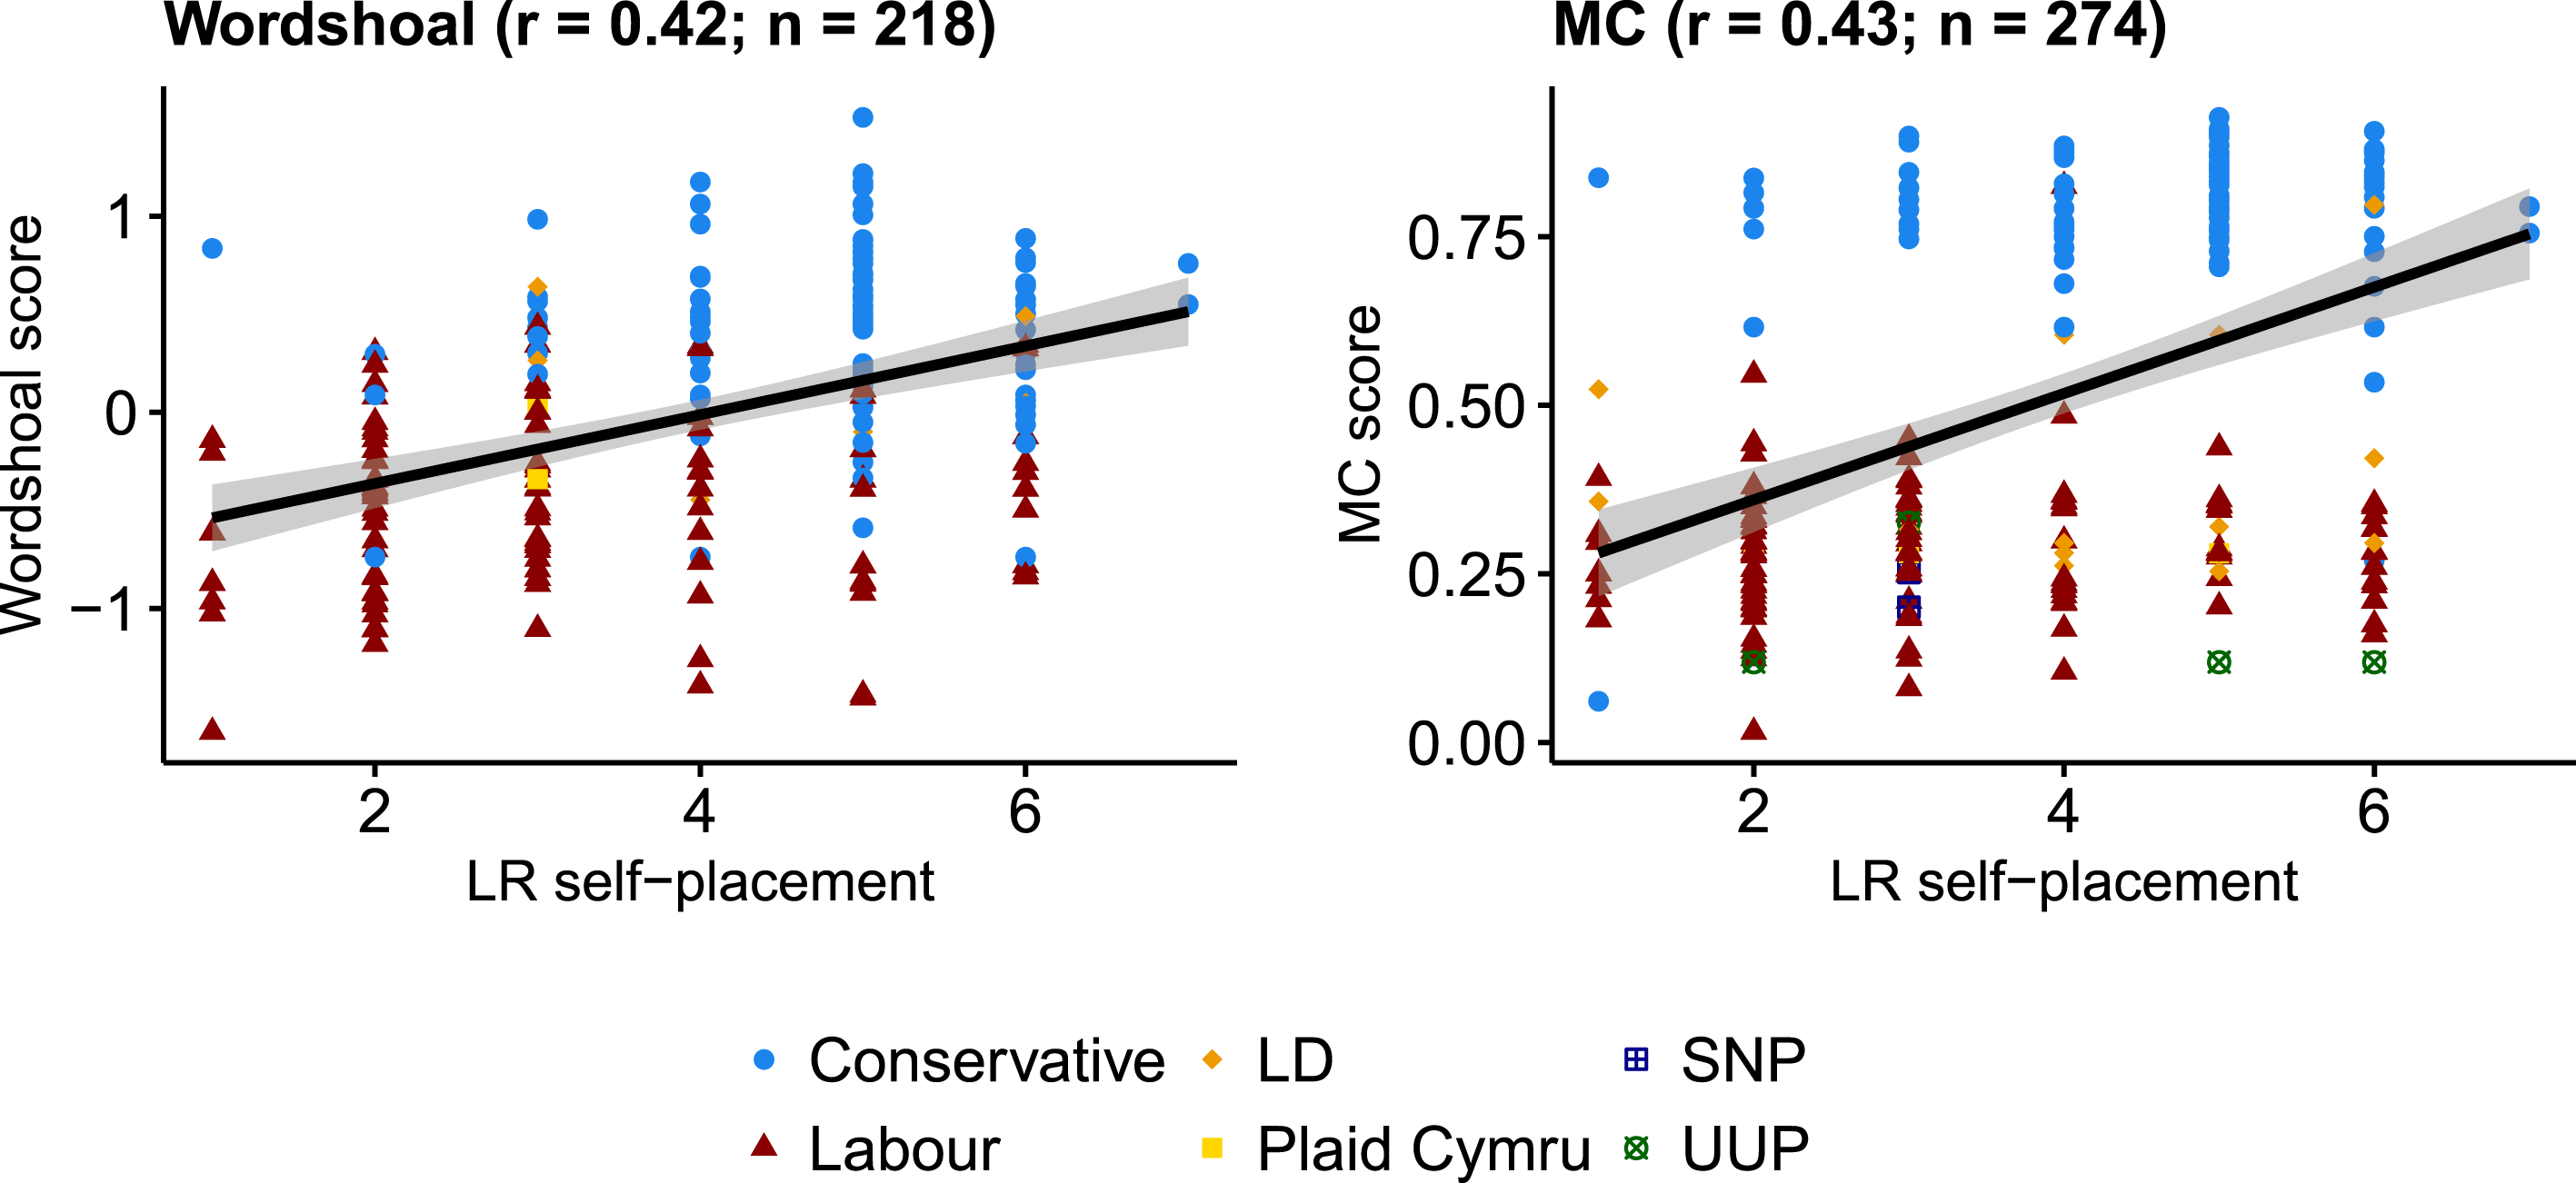
Scatter plots and regression lines for the association between the left–right self-placement of surveyed MPs in the 1992 wave of the British Candidate Survey (Norris and Lovenduski Reference Norris and Lovenduski1995) and the individual-level estimates of the Wordshoal and SGD implementations respectively.

Our second set of tests focuses on the convergence of the estimates with an exogenous measure. First, to investigate the correspondence with session-level estimates (2.1), comparable data are only available for the period after 1945, for which we can analyze the convergent validity of our estimates with the rile score (Laver and Budge Reference Laver, Budge, Laver and Budge1992) of the parties based on the CMP data (Volkens et al. Reference Volkens2016).Footnote 33 Figure 5 above presents a visual comparison.Footnote 34 Here, the sessional score for the year preceding the election year is matched with the CMP scores.Footnote 35 These results paint a mixed picture. Both the classifier and the Wordshoal results bear a reasonable resemblance to the rile-based score (with the exception of 1960). The latter however seems to show better correspondence. This is not altogether surprising as the Wordshoal approach should be more sensitive to changes to the issues on the agenda (as the CMP’s rile scores are too) than the machine classifier. As outlined in the previous sections, the former approach extracts a latent dimension from each debate and subsequently runs a Bayesian factor analysis to extract a score across these debates for each MP. As new issues enter the parliamentary arena, we can expect these positions to shift, affecting the aggregate measure of polarization. Conversely, although a dynamic whereby parliament needs to engage with new issues changes the features of the corpus on which the classifier is trained, this latter approach will not treat these as new dimensions. Debates on novel problems may make the classifier more or less accurate (depending on how divisive the issue is for parties), but it will not contribute as directly to changing the position of individual legislators as would happen in the Wordshoal approach.
A more promising level for comparison is that of individual estimates (2.2), for which we can rely on data from the 1992 wave of the British Candidate Survey (BCS) (Norris and Lovenduski Reference Norris and Lovenduski1995).Footnote
36
The BCS asks respondents to rank themselves on a seven-point ordinal left-to-right scale. I match these records from the 1992 wave—the availability of which is, of course, limited by response rates—with my own MP-level estimates (taking their maximum prediction value). I do so for the first session of the 1992–1997 parliament, as this is closest (in time) to when MPs responded to the survey (i.e. in 1991). The results (Figure 5) show that the estimates correlate most strongly with the classifier results (
 $\unicode[STIX]{x1D70C}=0.43$
), but followed closely by Wordshoal (at
 $\unicode[STIX]{x1D70C}=0.42$
). Naturally, we cannot extrapolate to the full sample, but these results are nevertheless encouraging. Specifically, they suggest that the machine classifier is, similar to Wordshoal, able to produce results that bear a close relationship to the position that legislators give themselves on a left-to-right scale.
Correlation of individual-level estimates between session
 $t$
and session
 $t+1$
for all parliamentary sessions of the UK House of Commons from 1811 to 2015.

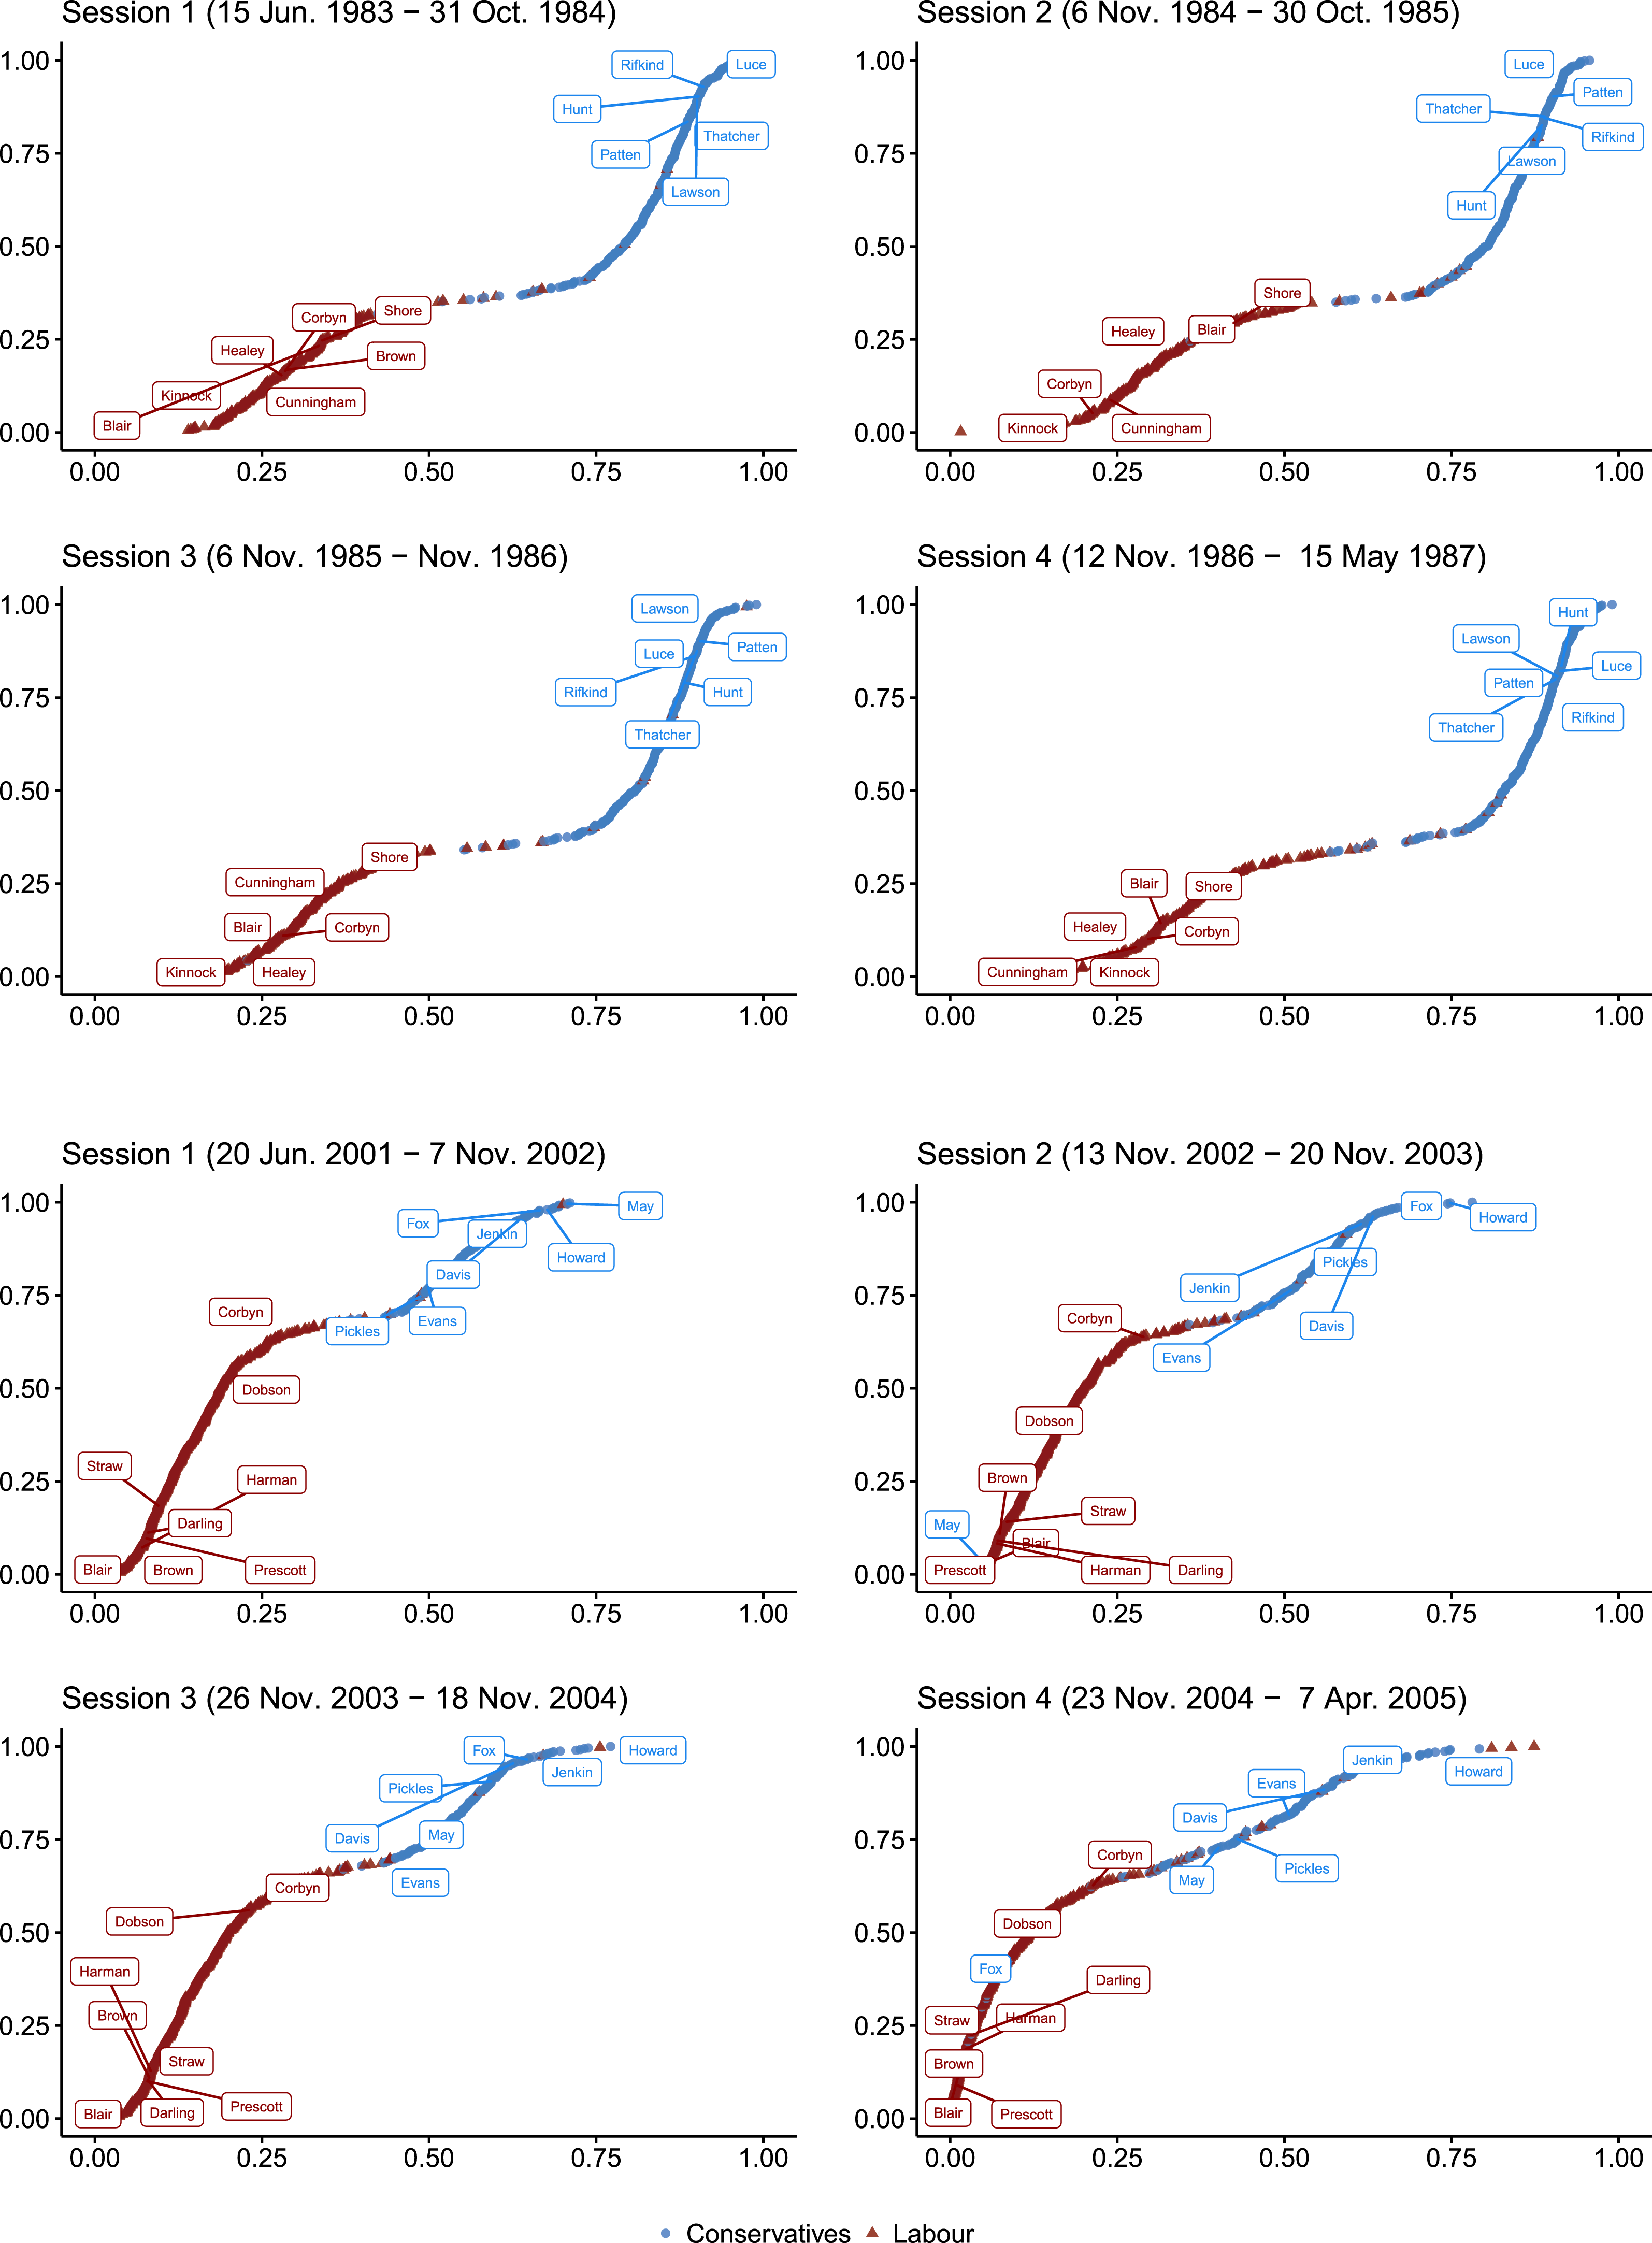
Empirical Cumulative Distribution Functions of the individual-level class probabilities for legislators obtained with the supervised machine classifier for all sessions of the 1983–1987 and the 2001–2005 parliamentary terms.

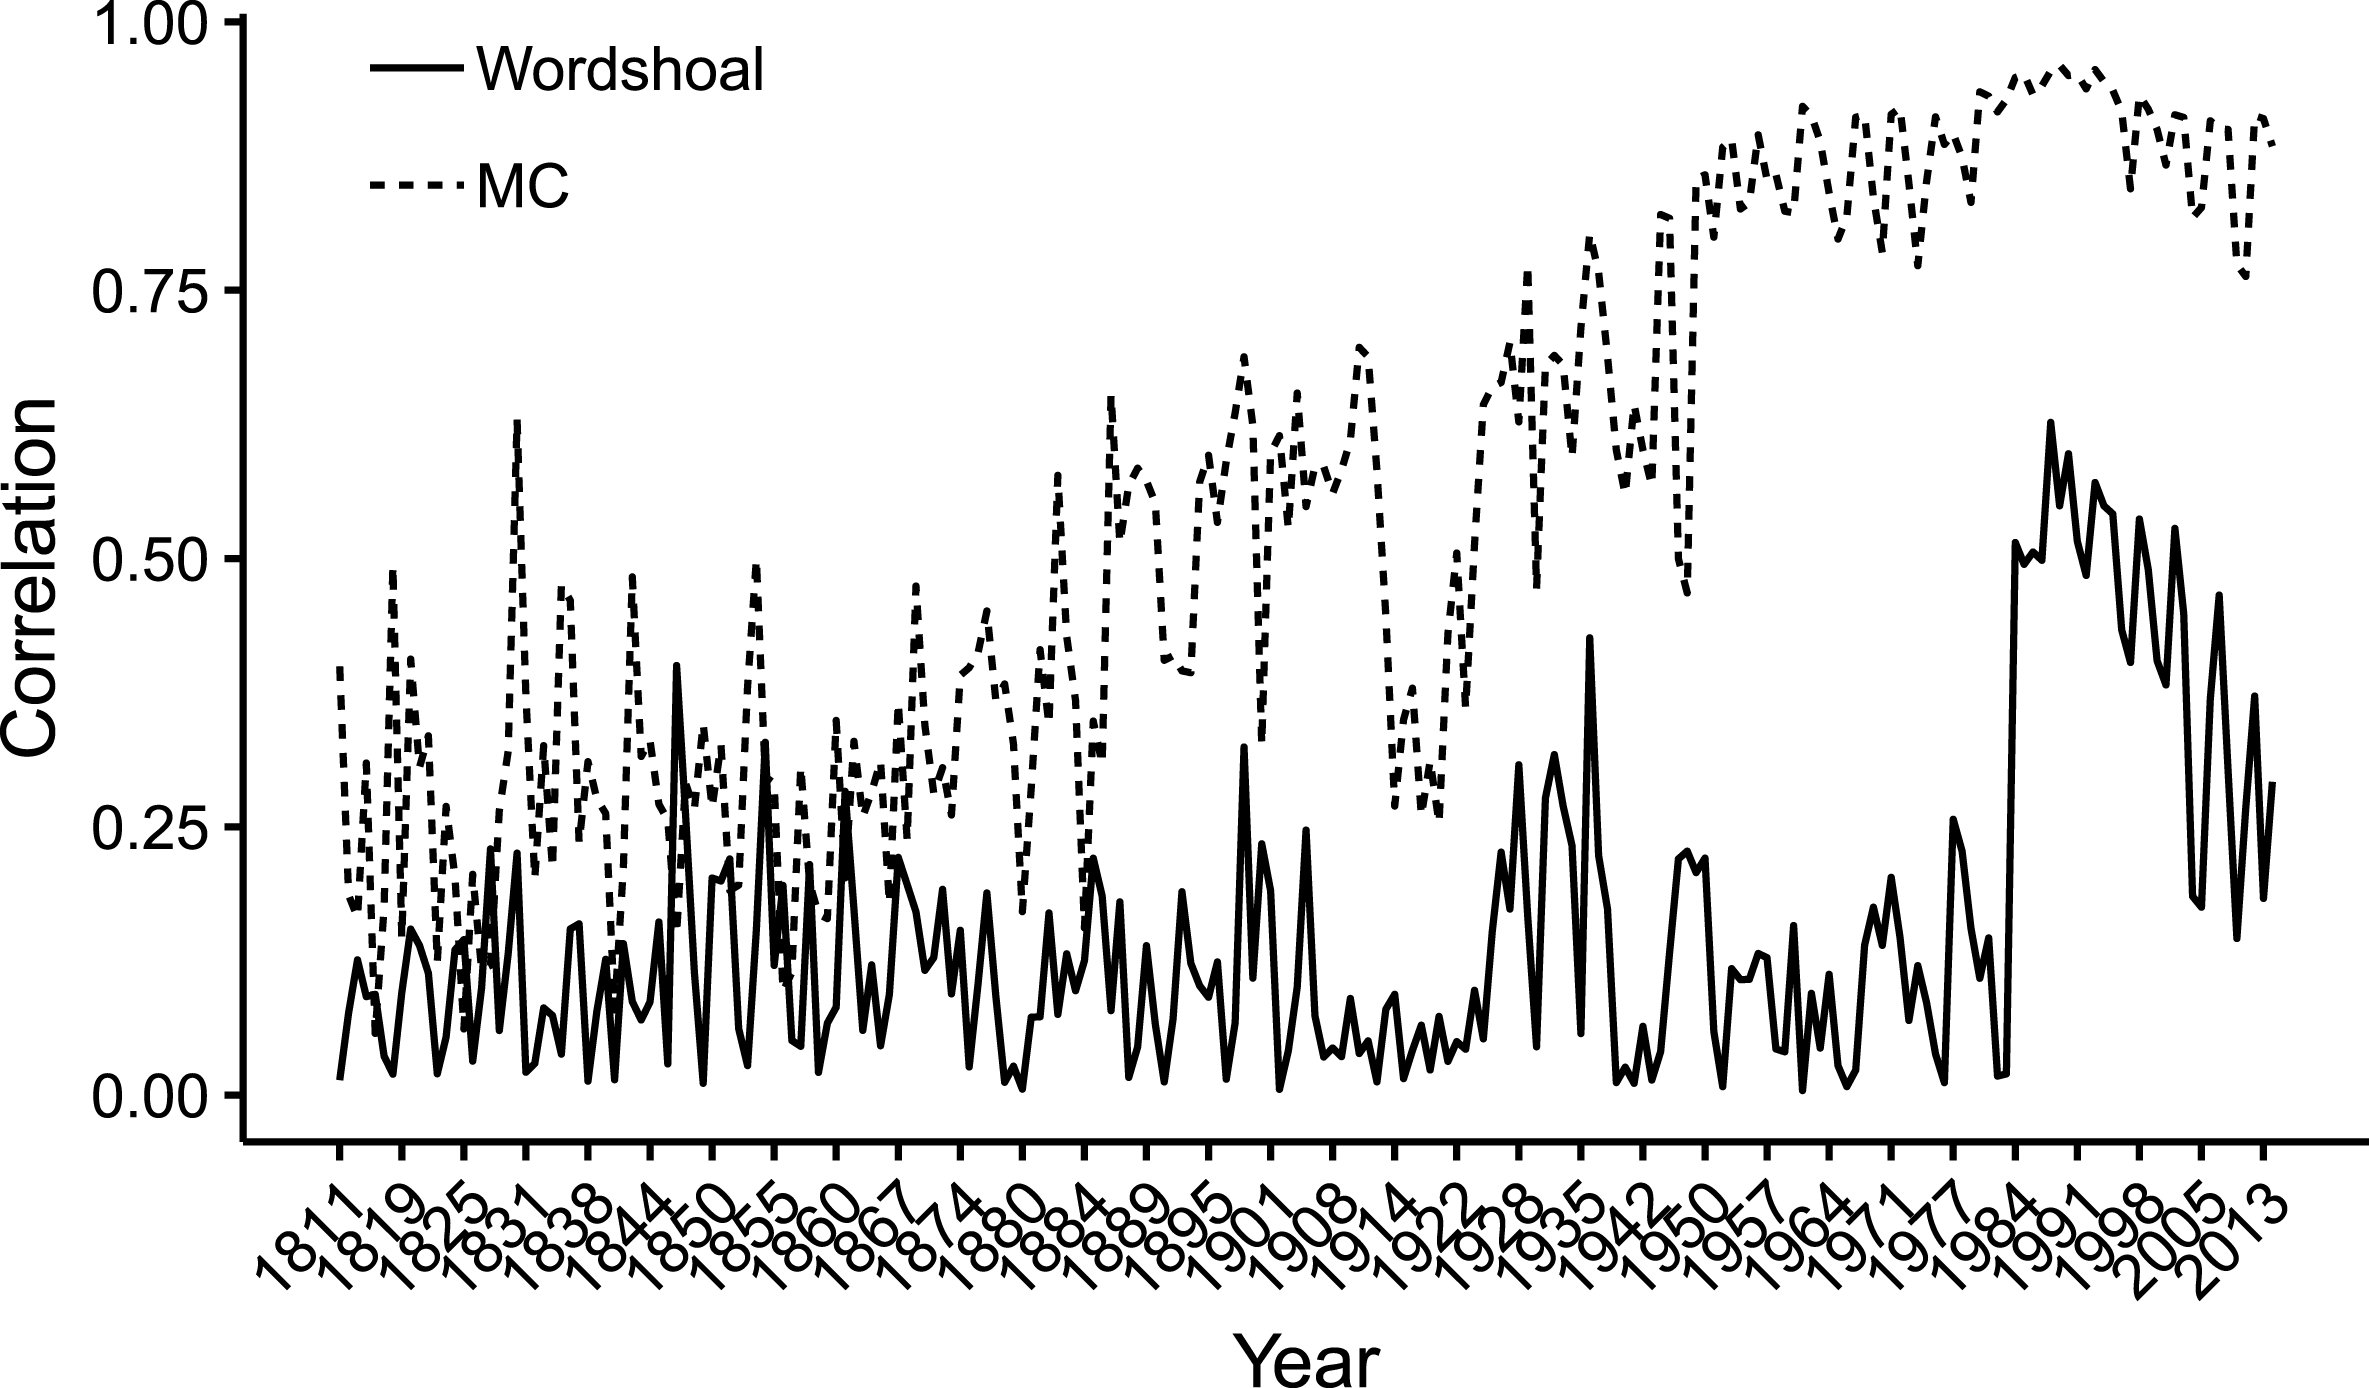
Examining the stability of the estimates over time (between-session consistency test (3.1)), allows us to establish whether the estimated positions reflect long-held political views of legislators, or, alternatively, represent issue-specific divergences. Such stability is crucial when it is our intention to use a polarization measure in a substantive application, i.e. to test hypotheses that relate to political phenomena across extended time periods. It ensures that the measure is comparable over time, that is, that it relates to the same construct rather than to issue-specific divergences. To assess between-session consistency (or: stability), we consider the correlation from one year to the next for legislators in each parliament. Figure 6 plots these correlations for all sessions for the MC and the Wordshoal estimates. For the former, the average correlation across the sample is 0.55, and there is a steadily upward trend, with the highest level of session-to-session consistency in the 1980s. The correlations for Wordshoal have a mean of 0.15, and range between
 $4.3e-3$
and 0.63. This latter result raises some issues for the unsupervised scaling technique. We would expect Wordshoal to be less consistent between sessions (for reasons outlined above). However, we should still expect legislators to be somewhat consistent in their positions across different issues that make it to the agenda. Again, it appears that the machine classifier is better able to capture the position of individual legislators over time.
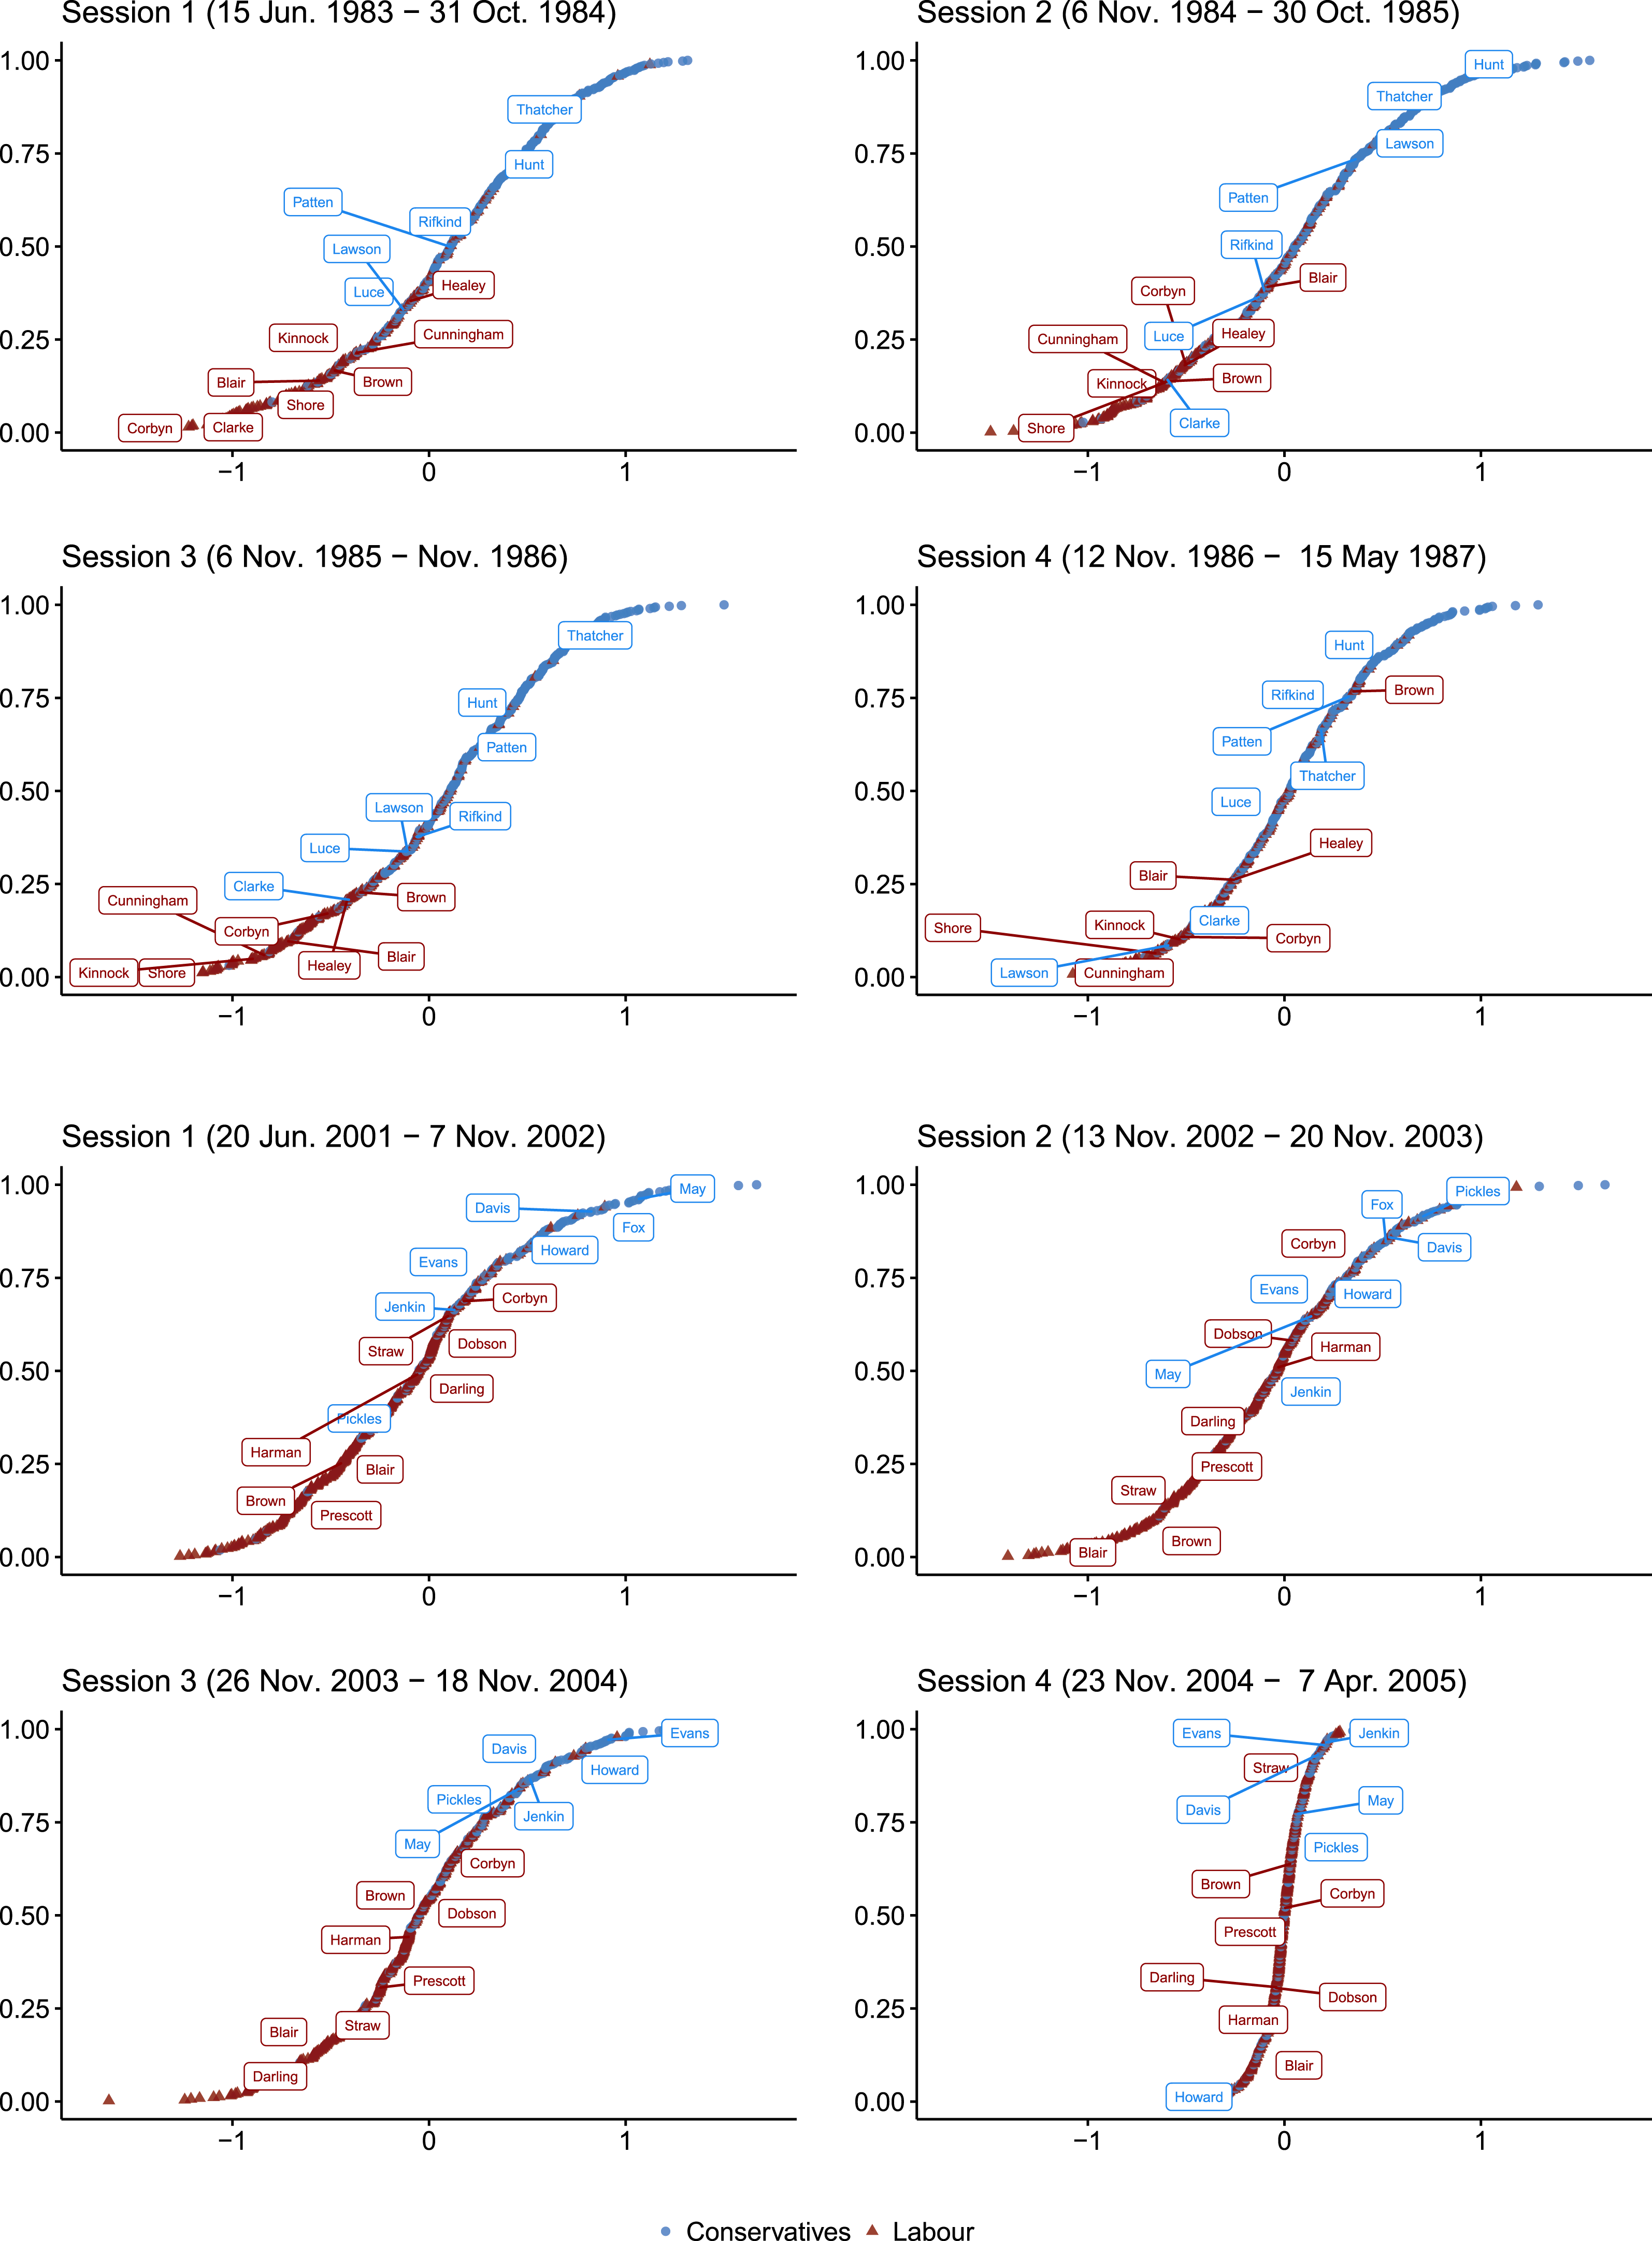
Further, I analyze whether the individual-level distribution (3.2) of estimates shows a clear division of legislators between the main parties, and whether the placement of key legislators on either extreme matches our expectations. Here, I consider the 49th parliament under the second ministry of Margaret Thatcher (1983–1987), and Tony Blair’s government of 2001–2005 (53rd parliament). Figure 7 plots the ECDFs of the individual-level estimates of the classifier accuracy approach for each session (four for each parliament). An “individual estimate” is the mean accuracy of all speeches an MP made in a session. Figure 8 plots the ECDFs of the legislator-level estimates obtained with Wordshoal. Here, the unit of observation is the factor score across all debates in which an MP participated, as described earlier in this paper.
Empirical Cumulative Distribution Functions of the individual-level class probabilities for legislators obtained with the Wordshoal algorithm for all sessions of the 1983–1987 and the 2001–2005 parliamentary terms.

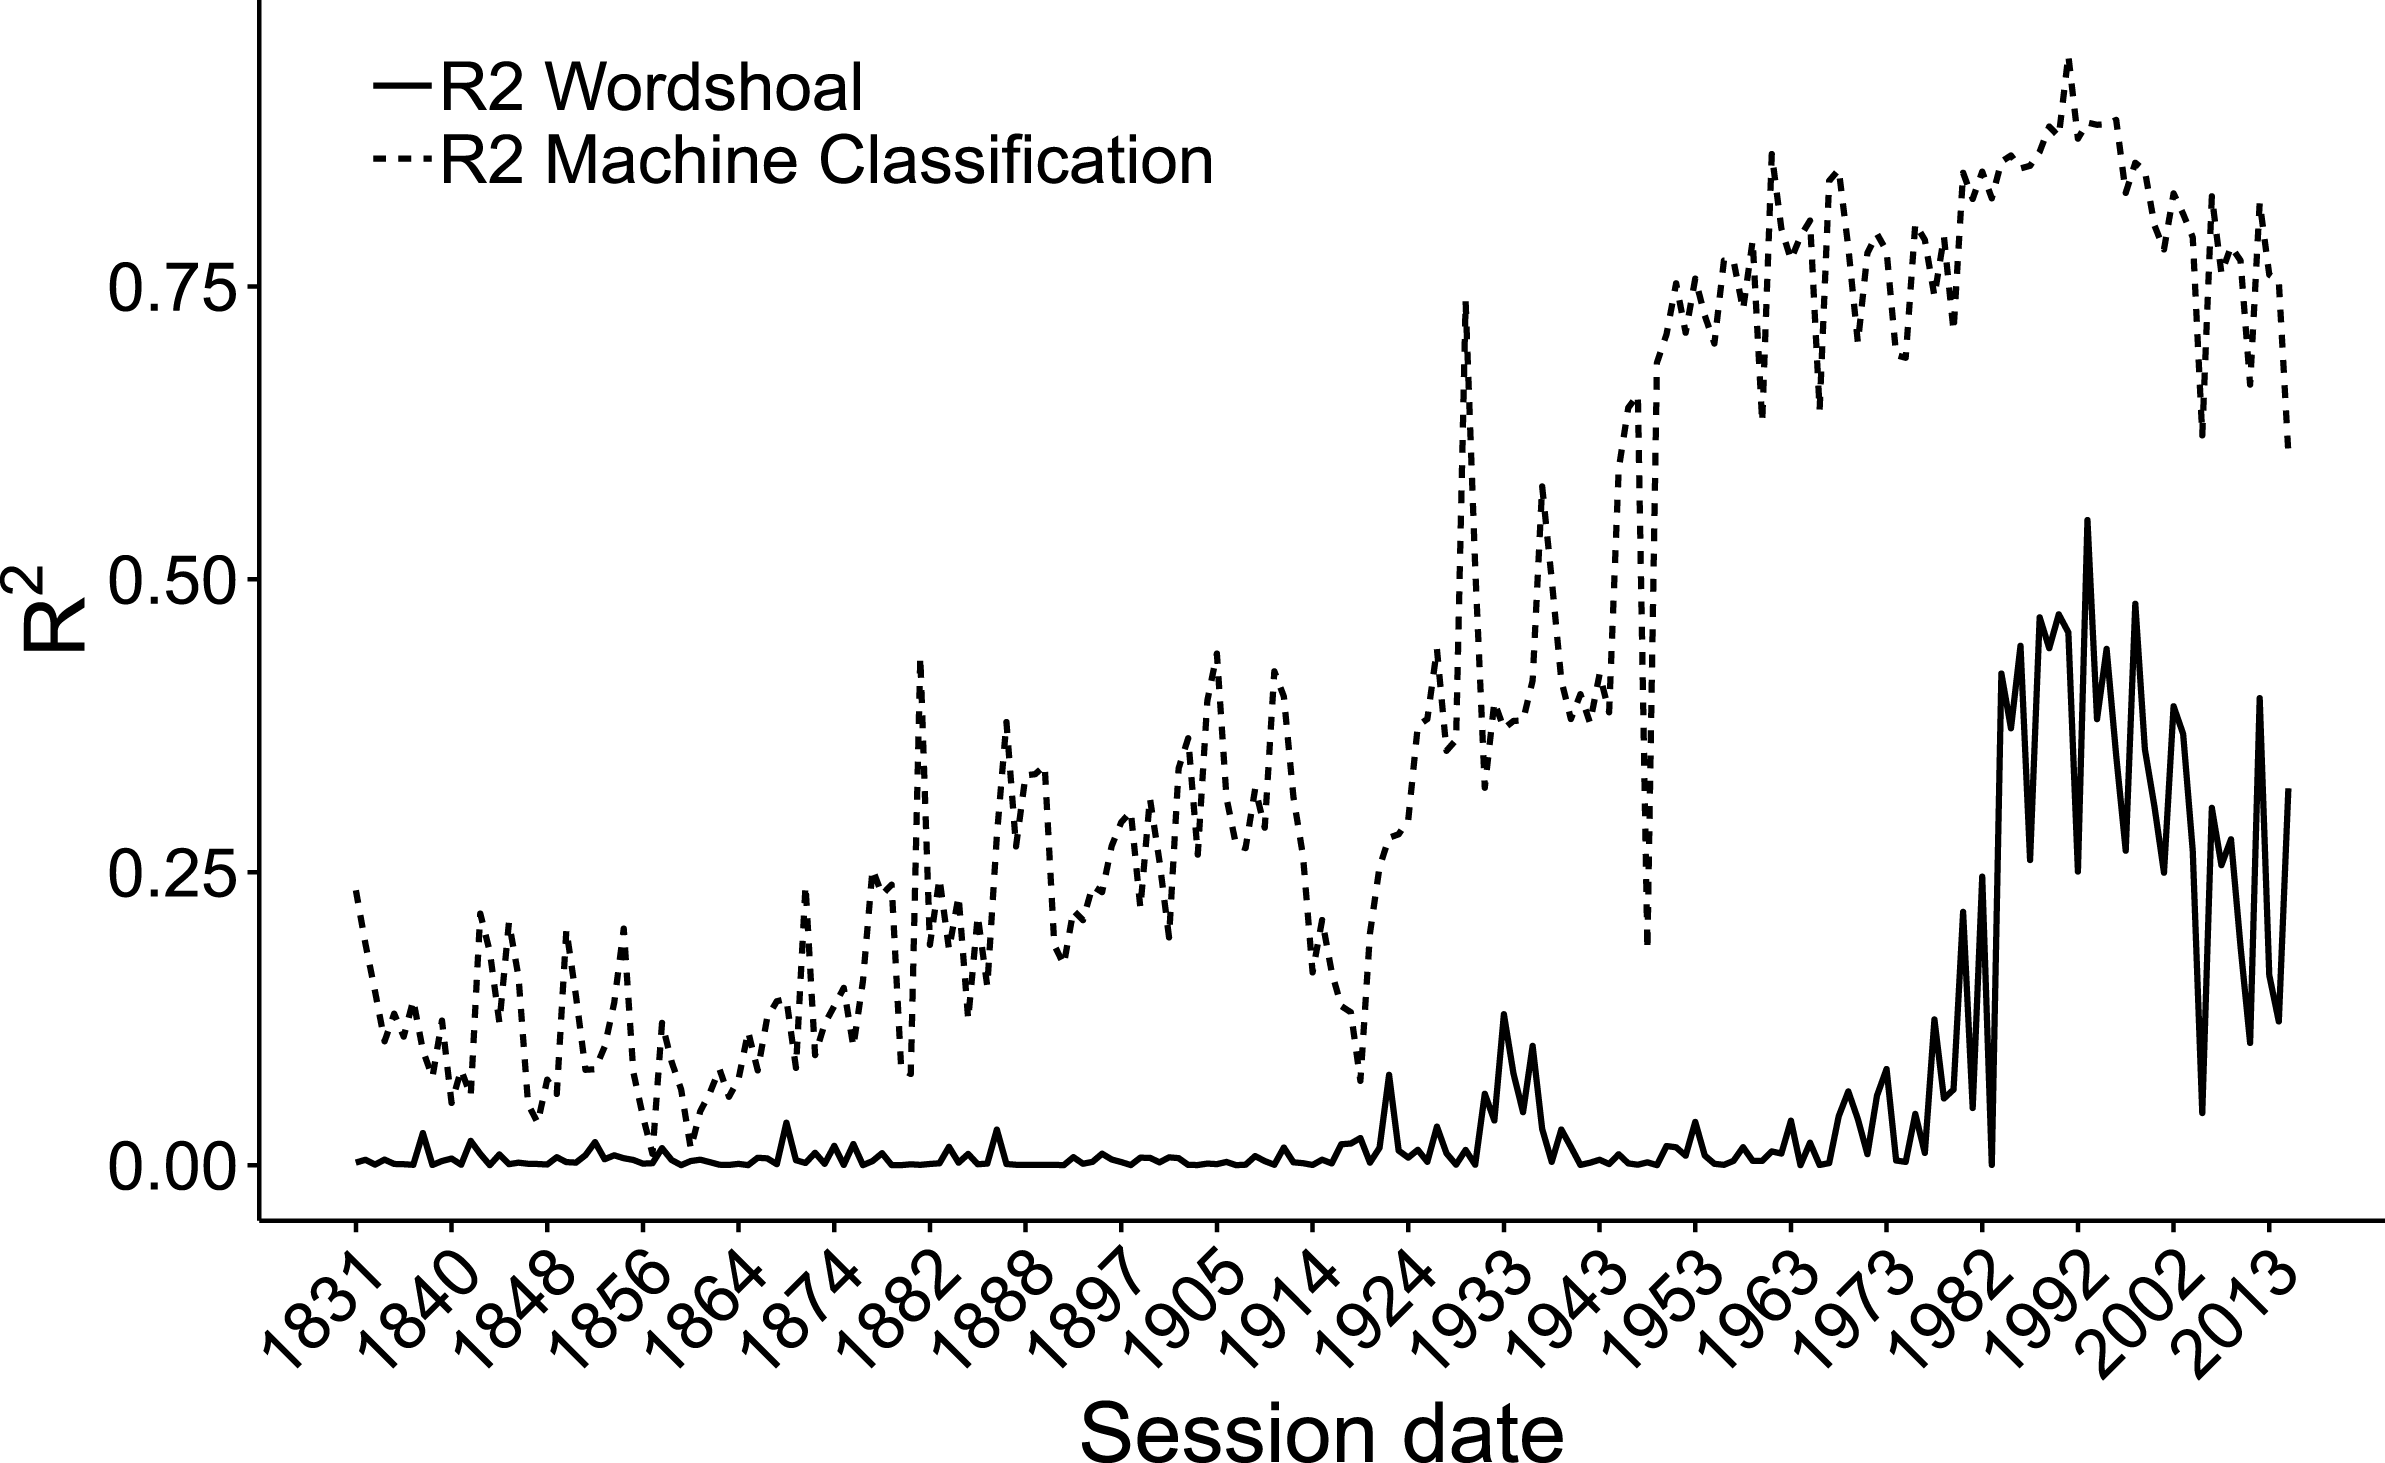
 $R^{2}$
from regressing MP-level estimates on party label.

An important “visual” test of the plausibility of the two measures is whether the ECDF clearly classifies members as belonging to one party. We should not expect perfect separation in every parliament—after all, polarization varies over time—but, a complete overlap of parties seems equally implausible. The classifier estimates show a clear division. Further, key politicians in the Shadow Cabinet and the Cabinet are placed further out in the tails, as one would expect. For example, from 1983 to 1987, PM Thatcher and the Chancellor of the Exchequer Nigel Lawson (as well as other key figures) are clearly out in the tails (Figure 7). Conversely, their counterparts for the 2001–2005 parliament, Tony Blair and Gordon Brown, are clearly placed on the extreme left of the spectrum.Footnote 37
Second, the Wordshoal-based estimates show relatively good separation of parties, but still inspire less confidence. Figure 8 shows that there is a considerable degree of overlap between members of different parties. Although I have no a priori expectations as to how concentrated the parties should be, one would at the very least expect stronger clustering of parties, and the separation should certainly outperform an “at-random” distribution of estimates.
Finally, the validation framework prescribes an investigation of the explanatory power of the party (3.3): do these text-based approaches capture anything beyond simple government–opposition dynamics? To evaluate this question, we take a simple linear model for each session where we regress individual scores on their party’s mean position. These measures are plotted in Figure 9. It is clear that the SGD algorithm is not simply capturing party affiliation. There is a relatively strong correspondence between party position and label, but the levels of the
 $R^{2}$
show that some unexplained variation remains. It has a mean of 0.39 across the sample, and a minimum and maximum of 0.01 and 0.95 respectively.Footnote
38
We obtain different results for the Wordshoal estimates. Here the range is
 $[1.09e-8,0.55]$
with a mean of 0.06. These values are implausibly low and reaffirm our findings above that the division between parties in this approach less clearly reflects political affiliation.
7 Discussion and Conclusion
The use of speech data to inform our understanding of parliamentary polarization is still in its infancy, and presents researchers with significant challenges. Using over 6.2 million speech records from the UK House of Commons, this paper has outlined a widely applicable framework for validating such text-based measures of polarization, which consists of clear and manageable tests that researchers can rely on. I have demonstrated the framework’s usefulness in an application to an unsupervised scaling technique (Wordshoal) (Lauderdale and Herzog Reference Lauderdale and Herzog2016), and a novel supervised machine classifier approach (Peterson and Spirling Reference Peterson and Spirling2018).
These applications suggest that unsupervised (scaling) approaches that do not incorporate information about party affiliation fail to produce estimates that map onto a clear and temporally comparable political space. Conversely, a simple machine classifier strategy that puts party information front and center produces estimates that show a high degree of face-, construct-, and convergent validity. This finding becomes most strongly apparent when considering the parts of the validation framework that consider the individual-level estimates. In contrast to Wordshoal, the machine classifier approach produces measures of legislator positions that show much greater stability over time (test 3.1), that separate parties well and place key individuals correctly in the political space (test 3.2), and that correspond to MPs’ self-reported ideological positions (test 2.2). The machine classification method is thus particularly suited to researchers who seek to apply text-based measures of polarization in substantive applications, and in particular in studies that focus on a long time period.
Many of the problems of supervised approaches such as Wordfish (and its sibling, Wordshoal) seem to stem from the fact that they limit themselves to estimating one, latent dimension, which is the axis that accounts for the greatest amount of variation in word use. There is no guarantee that this particular axis corresponds to the dimension of party conflict that we are interested in. The strength (and weakness) of the classification approach is that we can pin down the target that we want to capture. This gives us estimates that we can reasonably assume (and, through validation can be shown) to be related to conflict between political parties. As in many cases we have information on the party to which individuals belong, we should in the estimation of polarization rely on this superior method.
This conclusion is not simply an artifact of something unique to the UK data. An additional validation exercise, for which I use the same data from the Irish Dáil and the US Senate from Lauderdale and Herzog (Reference Lauderdale and Herzog2016), reveals that the supervised, machine classifier approach also performs well in these contexts, at least when it comes to identifying opposition and government members (see Appendix F in the on-line supplementary material for a detailed comparison). For example, while the R-squared from regressing estimated positions on party labels is lower for the machine classification approach in both the Dáil and the US Senate, the ECDFs show that in both cases key legislators are placed where we would expect them to be on the distribution. In addition, the estimates for the US Senate correlate well with exogenously created measures.Footnote 39
Researchers that do wish to rely on unsupervised scaling techniques should think more carefully about limiting the lexicon to which they apply scaling techniques to the area of substantive interest (or “dimension”) that they seek to analyze. I have suggested two strategies to do so. First, in the parliamentary context one can sift out procedural terms using an “endogenous” dictionary approach, i.e. using records of the parliament’s own procedures (see the on-line supplementary materials). Second, we can reduce the dimensionality of the semantic space by: (i) lowering the level of analysis to individual debates; and (ii) applying a two-step dictionary approach using dictionaries and semantic classifier algorithms to select relevant speeches. Even while applying such selection techniques, however, it appears that the supervised model outperforms the unsupervised variant.
Two areas for improvement stand out. First, the strength of the classification accuracy approach lies in ignoring dimensionality. In so doing however, we sacrifice our ability to make substantive claims about the drivers of conflict. When we say that the House of Commons is polarized based on the ability of language use to predict party affiliation, what is the axis of disagreement? The economy, security issues, or, perhaps, foreign policy? A possible solution to this problem is to first preselect speeches on a specific dimension—for example by using my two-step dictionary and classification approach—and subsequently apply the classifier. This would allow researchers to analyze political disagreement on a more granular level.
Second, while we have a good appreciation of how institutional dynamics affect roll-call votes (Spirling and McLean Reference Spirling and McLean2007; Hix and Noury Reference Hix and Noury2010), we do not have a comparable level of understanding of how they impact text-based estimation. The degree to which legislators engage in debate is subject to both cross- and within-country variation (cf. Benedetto and Hix Reference Benedetto and Hix2007; Kam Reference Kam2009; Eggers and Spirling Reference Eggers and Spirling2014; Proksch and Slapin Reference Proksch and Slapin2015)—dynamics which our models can and should incorporate. A comprehensive machine classification approach to measuring polarization would distinguish appropriate weights to account for individual- and system-level characteristics, as well as cross-temporal dynamics such as the safety of the MP’s seat and exogenous shocks. I leave such and other improvements for future work.
Supplementary material
For supplementary material accompanying this paper, please visit https://doi.org/10.1017/pan.2019.2.