I. INTRODUCTION
Ever since the discovery of quasicrystals, Reference Shechtman, Blech, Gratias and Cahn1 research has been underway to determine the properties of these aperiodic phases. It did not take long to realize that these phases behaved in an unusual manner for intermetallic phases. Reference Fukamichi, Masumoto, Oguchi, Inoue, Goto, Sakakibara and Todo2–Reference Dubois, Kang and Perrot4 Several of their properties were more reminiscent of ceramic compounds rather than metallic ones e.g. resistivity and indentation toughness. The reasons for this behavior were investigated and several properties were found to be inherent from the aperiodic structure of quasicrystals.
In relation to quasicrystals, a group of phases called approximants was discovered. Reference Goldman and Kelton5 The approximant phases are complex structures that are locally similar to the structure of quasicrystals, but lacking the long-range aperiodicity. Instead they are periodic with large unit cells. The investigation of the physical properties of these phases is important for the understanding of the properties due to aperiodicity.
An important factor in determining the physical properties is the preparation and crystalline state of the samples. Depending on the crystal size and quality, large variations in e.g. hardness and resistivity have been observed within the same phase. Reference Dolinšek, McGuiness, Klanjšek, Smiljanič, Smontara, Zijlstra, Bose, Fischer, Kramer and Canfield6 This becomes important when considering possible applications of the material, and consequently, comparing sample preparation techniques becomes a matter of importance.
The room-temperature brittleness of quasicrystals can be overcome by the deposition of thin films onto different substrates. Reference Dubois, Kang and Perrot4 This provides a combination of a high toughness of the substrate with advantageous properties of the quasicrystalline phases. Therefore, the trend toward using quasicrystalline materials as thin films has increased. Various physical vapor deposition (PVD) methods have been used to deposit quasicrystalline coatings including co-sputtering from individual elemental targets, deposition of elemental multilayers, evaporation, and sputtering from cast composite quasicrystalline targets. Reference Klein and Symko7–Reference Fehrenbacher, Zabinski, Phillips, Daniels, King, Ketola and Bilello9 In most cases deposition is followed by annealing. Among the deposition processes, magnetron sputtering is an excellent method for reproducible manufacturing of thin coatings with complex and homogenous chemical compositions as well as uniform morphology and thickness. Reference Ohring10
The icosahedral phase in the AlCuFe alloy was identified in 1987 by Tsai et al. Reference Tsai, Inoue and Masumoto11 and is today one of the most studied quasicrystalline phases. Reference Huttunen-Saarivirta12 Mechanical measurements of the AlCuFe material system, although not performed with a nanoindenter, have reported hardness and elastic modulus values of ∼8 and 180 GPa for the quasicrystalline phase. Reference Giacometti, Baluc, Bonneville and Rabier13,Reference Köster, Liu, Liebertz and Michel14 Friction coefficients, measured in a large range from 0.06 to more than 0.30, have been found to depend strongly on the deposition technique and deposition procedure, Reference Zhang, Dong, Brunet and Dubois15,Reference Dubois, De Weerd, Brenner, Sales, Mozdzen, Merstallinger and Belin-Ferré16 while indentation toughness values are usually measured around 1 MPa/m½. Reference Giacometti, Baluc, Bonneville and Rabier13 However, majority of studies are focused on bulk samples, which may show different results compared to thin films. In addition, even fewer studies of the tribological properties have been made at the nanoscale.
The investigation of the mechanical and tribological properties of approximant thin films is scarce with exceptions for the rhombohedral Reference Fehrenbacher, Zabinski, Phillips, Daniels, King, Ketola and Bilello9 and the B2-based Reference Dong, Zhang, Zhou, Zhang, Dubois, Zhang, Fu, He and Ge17 phases. For the Al–Si–Cu–Fe system there are no studies for thin films. Here, multilayered Al/Cu/Fe thin films have been prepared by magnetron sputtering on Al2O3 and Si substrates. Post-annealing transformed the multilayers on Si into the α-Al55Si7Cu25.5Fe12.5 approximant phase Reference Quivy, Quiquandon, Calvayrac, Faudot, Gratias, Berger, Brand, Simonet and Hippert18 by a solid state diffusion reaction with the substrate, while multilayers on Al2O3 transformed into the icosahedral quasicrystalline Ψ-Al62.5Cu25.5Fe12.5 phase. Reference Olsson, Eriksson, Birch and Hultman19 The present study is mainly focused on the nanomechanical and nanotribological properties of these films in comparison to the reference bulk material, with correlations made to both the microstructure of the individual samples and between the approximant and quasicrystalline phases.
II. EXPERIMENTAL DETAILS
Multilayered Al/Cu/Fe thin films were sequentially deposited by triple cathode direct current (DC) magnetron sputtering in a high vacuum system onto Si(001) and Al2O3(0001) substrates. The background pressure was about 3 × 10⁻⁷ Torr. A pressure of 3 mTorr Ar (99.999% purity) sputtering gas and ambient temperature (293 K) were used during the depositions. The substrate was spinning with 60 rpm and kept at a negative bias voltage of −30 V to attract ions from the plasma. The three sputtering targets, Al (99.99% purity, ø50 mm diameter), Cu (99.95%, ø75 mm) and Fe (99.95%, ø75 mm), were running continuously during deposition and the material fluxes were controlled by using manually operated shutters placed in front of the magnetrons. The magnetron discharges were established with current-regulated power supplies giving currents (voltages) of 50 mA (440 V) for Al, 40 mA (270 V) for Cu, and 100 mA (320 V) for Fe. Layers of Al, Cu, and Fe were sequentially deposited on top of each other to form a multilayered stack.
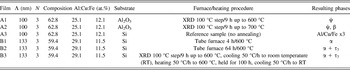
Two samples of Al/Cu/Fe multilayers were produced. A, comprising a global composition corresponding to the quasicrystalline phase Ψ-Al62.5Cu25Fe12.5, a multilayer period thickness of Λ = 100 nm and N = 3 repetitions, and B, slightly deficient with respect to Al, and with a multilayer period thickness of Λ = 133 nm and N = 3 repetitions. The A-film was simultaneously deposited on both Si and Al2O3 substrates and the B-film only on Si substrates. After deposition, each Si substrate was cut into three 10 × 10 mm2 pieces, in the following labeled as samples B1–B3. The films of sample A on Al2O3 are designated A1 and A2, while that on Si is designated A3. Table I shows the structure of the deposited samples.
Deposited samples, respective heat treatments, and the resulting phases.

The thin films were heat treated in either a Heraeus quartz tube furnace 4/25 (Heraeus Quarzglas GmbH & Co. KG, Kleinostheim, Germany) in a constantly flowing Argon atmosphere or in a Edmund-Bühler HDK 2.4 high-temperature high-vacuum chamber (Edmund Bühler GmbH, Hechingen, Germany) with a Be window fitted onto a Philips X'Pert MPD Bragg–Brentano, θ–θ diffractometer with Cu–Kα x-rays (PANalytical, Almelo, The Netherlands). In the tube furnace, the temperature was kept at 600 °C for 4 h (B1) and 64 h (B2), while in the diffractometer furnace, the temperature was increased in discrete steps of about 100 °C every 9th h up to 600 °C (A1) or up to 700 °C (A2). For each temperature step θ–2θ measurements were continuously performed in a 2θ-range of 6–49° with a step size of 0.02° and a collection time of 5 s. Several scans were made at each temperature to ensure phase stability. One of the samples (B3) was first treated like sample A1, followed by a continued cooling in steps of 50 °C/h to room temperature, thereafter heating in steps of 50 °C/h up to 600 °C again where it was held for 100 h before cooling in steps of 50 °C/h. The other samples were passively cooled by turning off the heat, reaching room temperature in ∼30 min in the tube furnace and in ∼15 min in the diffractometer furnace. Sample A3, i.e., film A deposited on a Si substrate, was left as the as-deposited Al/Cu/Fe multilayer for reference. In addition, a 10 × 10 mm2 piece of polished, polycrystalline Fe was also used as a reference.
Compositional analysis was performed using energy dispersive x-ray spectroscopy (EDX) analysis in a LEO Gemini 1550 FEG scanning electron microscope (SEM; Carl Zeiss Microscopy GmbH, Oberkochen, Germany), equipped with an Oxford LINK ISIS system with a Ge detector (Oxford Instruments, Abingdon, United Kingdom). The instrument was operated at 20 kV accelerating voltage and a 60 s effective acquisition time was used. A Co standard was used for quantitative calibration using the INCA software, and the sum of Al, Cu, and Fe was normalized to 1. A more detailed compositional analysis was performed for samples B1 and B2 using Rutherford backscattering spectrometry and time-of-flight elastic recoil detection analysis. Reference Olsson, Jensen, Garbrecht, Birch, Hultman and Eriksson20
The mechanical and tribological properties of the AlCuFe thin films were investigated by a triboindenter (TI-950) system from Hysitron (Minneapolis, Minnesota). For the nano-indentation experiments, nine indentations were made for each sample using a three-sided Berkovich diamond tip of 2 μm diameter. The maximum load on the tip was 380 μN, keeping the indentation depth below 10% of the film thickness. The indentation data were analyzed using the Oliver and Pharr method, Reference Oliver and Pharr21 where the hardness and reduced elastic modulus were calculated from the stiffness obtained by area function fitting to the unloaded part of the curve in the length 20–95% of penetration. The hardness of the films is given by the ratio between the maximum applied indentation load and the generated indentation area. The reduced elastic modulus E r, deduced from the slope of the unloading part in the load–displacement curve and the projected area of the indentation at the contact depth, includes a contribution from both the film and the response of the indenter tip. The elastic modulus of the film E f is related to the reduced elastic modulus through 1/E r = (1 − νi 2)/E i + (1 − νf 2)/E f, where ν is the Poisson ratio. For a diamond indenter tip, E i = 1140 GPa and νi = 0.07, whereas νf was taken for the present AlCuFe films as 0.23, Reference Tanaka, Mitarai and Kotwa22 neglecting the different phases. The film toughness of the samples was calculated from the crack lengths generated by a cube-corner diamond indenter according to Reference Riester, Bridge and Breder23 :
 $$K_{\rm{C}} = 0.032\left[ {{E \over H}} \right]^{{1}/{2}} \left[ {{P \over {c^{1.5} }}} \right]\quad ,$$
where H is the thin film hardness as obtained from the nanoindentation measurements, E the elastic modulus of the film, c the crack length, and P the applied load. It should be noted however that when using this method the obtained toughness values can be overestimated by up to 50%. Reference Kruzic, Kim, Koester and Ritchie24 In the experiments 24 indentations were made with loads increasing from 0.5 to 12 mN. For the friction experiments, a cono-spherical diamond tip with 5 μm radius and a half-angle of 30° was used in a reciprocal-test configuration. The tip load was 50 μN and 50 passes, each with a distance of 10 μm, was performed. The lateral friction forces recorded during the test allowed for calculation of the friction coefficient. The root mean square (RMS) surface roughness was measured by using the triboindenter by scanning areas of 20 × 20 µm2 with the same cono-spherical diamond tip used for friction characterization.
Electron diffraction, EDX spectroscopy, transmission electron microscopy (TEM) and high-resolution high-angle annular dark-field scanning TEM (HAADF-STEM) was performed on a Linköping probe and image side aberration-corrected and monochromated FEI Titan3 60–300 microscope (FEI Europe, Eindhoven, The Netherlands) equipped with a high brightness XFEG source and a high-count rate ChemiSTEM EDX detector system, operated at 300 kV. The cross-sectional samples were prepared using mechanical polishing and low energy ion-beam milling. Cross-sectional TEM samples were prepared by mounting and gluing two slices of the sample (film to film) into the window of a Ti grid, followed by mechanical thinning and polishing to a thickness of ∼30 μm. Thinning to electron transparency was achieved by ion beam milling, first with a Gatan PIPS ion miller (Gatan, Pleasanton, California) using 5 keV Ar+ ions, and subsequent polishing using a Technoorg Linda ionmill (Technoorg Linda Ltd. Co., Budapest, Hungary) with a low angle (10°) and low ion energies (500 eV) to minimize surface amorphization. No delamination of films from the substrate was observed during the TEM sample preparation steps, suggesting good adhesion of the films.
III. RESULTS AND DISCUSSION
All as-deposited multilayered Al/Cu/Fe samples were investigated using x-ray diffraction (XRD). Reference Olsson, Eriksson, Birch and Hultman19,Reference Olsson, Jensen, Garbrecht, Birch, Hultman and Eriksson20 The diffraction peaks corresponded to Al(111), Cu(111), and Fe(110), i.e. the elemental layers were oriented with their low-energy surfaces perpendicular to the substrate normal. The diffraction peaks corresponding to Cu and Fe were broad and of low intensity, due to the thin layers of about 20 and 10 nm thick, respectively, allowing only small grains to form.
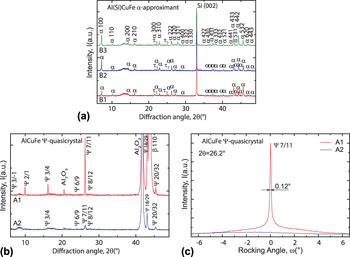
In Fig. 1 the XRD patterns of the samples after their respective heat treatments are shown. For the samples grown on Si, B1–B3, the annealing process transformed the multilayers into the α-Al55Si7Cu25.5Fe12.5 approximant phase, including a small amount of the τ7-Al3Fe2Si3 phase, by in-diffusion of Si from the substrate [Fig. 1(a)]. The number of τ7-phase grains was observed to increase with the annealing time as investigated previously. Reference Olsson, Jensen, Garbrecht, Birch, Hultman and Eriksson20 All samples are polycrystalline with randomly-oriented grains, and the Miller indices are included for the diffraction peaks of the α-approximant phase.
XRD measurements showing the existing phases after annealing of the Al/Cu/Fe multilayers on (a) Si and (b) Al2O3. (c) Rocking curve measurements of the 7/11 diffraction peak at 2θ = 26.2° for the quasicrystalline samples A1 and A2, with the corresponding θ–2θ measurements in (b).

In Fig. 1(b), the annealed Al/Cu/Fe multilayers on Al2O3, samples A1 and A2 are shown. After annealing to 600 °C, the film consisted of only the quasicrystalline phase, however, the rather broad diffraction peaks (e.g., a full width at half maximum (FWHM) of ∼0.32° for the diffraction peak at 2θ ∼ 43°) indicate that it is not a high quality quasicrystalline phase. The annealing temperature was not sufficient to allow atom diffusion to the most energetically favorable sites of the quasicrystalline phase. Reference Quiquandon, Quivy, Devaud, Faudot, Lefebvre, Bessière and Calvayrac25 The accurate peak positions and lack of peak splitting, however, confirm the quasicrystalline phase and eliminate the possibility of any known approximant.
Sample A2, annealed to 700 °C, on the other hand, had sharp diffraction peaks (FWHM ∼ 0.16° for the diffraction peak at 2θ ∼ 43°), indicating a better crystal quality, and was strongly textured with the 5-fold axis along the surface normal. The quasicrystalline diffraction peaks have been indexed using the two-integer Cahn indexing scheme Reference Cahn, Shechtman and Gratias26 for icosahedral quasicrystals. The barely visible 6/9, and the 8/12 and 20/32 diffraction peaks belong to 3- and 2-fold directions, respectively, while the other diffraction peaks adhere to 5-fold directions. In addition to the quasicrystalline Ψ-phase, there is a large quantity of β-Al(CuFe) phase present with strong 〈110〉 texture. Using the Scherrer equation and the FWHM of the 7/11 diffraction peaks, the vertical size of the coherently scattering domains, related to the vertical grain size, can be roughly estimated to be 26 and 51 nm for samples A1 and A2, respectively.
Figure 1(c) displays the rocking curve measurements on the 7/11 diffraction peaks at 2θ = 26.2° shown in the θ–2θ scans in Fig. 1(b). The rocking curve width is among other factors influenced by the lateral size of coherently scattering domains, strain due to dislocations and point defects, and mosaicity. Reference Ayers27 The narrow rocking curve width of 0.12° of the quasicrystalline phase annealed to 700 °C thus testifies a good quasicrystalline quality. In contrast, the quasicrystalline phase annealed to 600 °C exhibited a flat rocking curve, where it was not possible to reliably extract any rocking curve width, indicating a poor crystalline quality.
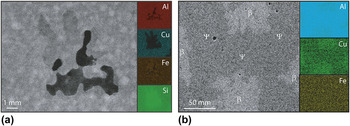
The microstructure was analyzed using both SEM and S/TEM with the assistance of EDX for phase identification. SEM imaging and EXD mapping of samples B1 and A2 are shown in Figs. 2(a) and 2(b), respectively. In samples B1–B3 the bright areas consists of the α-approximant phase while the dark area consists of τ7-phase, identified by the absence of Cu in those regions. The amount of τ7-phase has been observed to increase with annealing time. In sample A1, the film is uniform while in A2 the phases are segregated, the β-phase being the brighter regions in the image.
SEM images and EDX mapping of Al, Cu, and Fe for (a) the B1 sample annealed to form the approximant phase, and (b) for the A2 sample annealed to form the quasicrystalline phase.

In TEM it was observed that samples B1–B3 are polycrystalline with grain sizes in the range of 100–400 nm. The grains have no preferential crystalline orientation relationship to each other or the substrate. Both the film–substrate interface and the film top surface have a roughness in the order of 50 and 20 nm, respectively, and it was observed that the roughness was increasing with annealing time. However, no voids left behind from unbalanced interdiffusion could be observed in these regions. A surface oxide layer of about 20 nm was found to be present.
In sample A1, the film is polycrystalline with grains of 100–300 nm in size. The film–substrate interface roughness is negligible since no reaction with the substrate has occurred, while the film top surface has a roughness of about 10 nm. The surface oxide layer is thinner than that in the B samples, about 10 nm. In sample A2 the quasicrystalline grains were larger than that in B1, frequently extending over the entire film thickness (∼300 nm) and laterally up to a length of 600 nm, without any increased surface roughness.
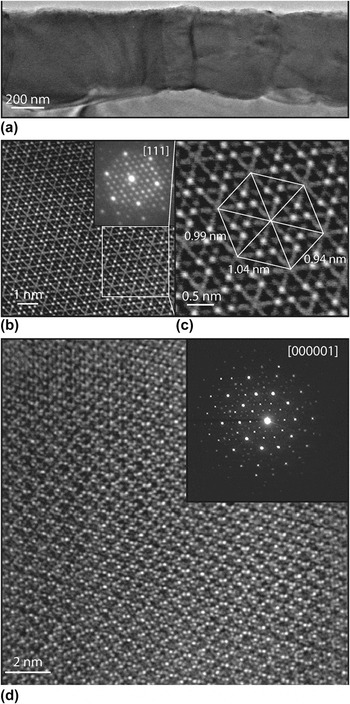
In some individual grains, both the ones containing the approximant and the quasicrystalline phases, a strain of up to 5% could be observed in the electron diffraction patterns. Such a strain can be identified in the magnified high-resolution image of the approximant phase in Fig. 3(c) where the hexagonal appearance is indicative of the [111] axis of a cubic lattice, and the deformation is a result of the strain. Strain-analyses using XRD, which measures the average strain over the entire x-ray illuminated region, yielded a strain of 0.5%. The discrepancy in the magnitude stems from the averaging over large areas in XRD measurements, where individual strains from numerous grains that are randomly oriented with respect to each other can counterbalance for a smaller overall strain.
(a) Low-resolution TEM overview of the approximant film and (b) HAADF-STEM micrograph and corresponding diffraction pattern of the approximant phase in sample B1, taken along the [111] direction. (c) Magnified view of the inset in (b), with a hexagon as guide to the eye revealing a high strain level in the lattice. (d) High-resolution TEM micrograph and diffraction pattern of the high quality quasicrystalline phase in sample A2 viewed along the [000001] direction.

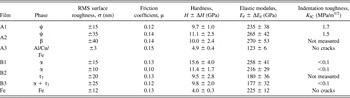
A triboindenter was used to assess the nanomechanical and nanotribological properties; hardness (H), elastic modulus (E f), toughness (K IC), and friction (μ). By utilizing an optical microscope in the triboindentation instrument and comparing to the SEM and EDX mapping in Fig. 2, it was possible to identify and perform measurements of the individual phases. However, the influence from adjacent and/or underlying phases can not be discarded. The measured quantities are presented in Table II, including the RMS surface roughness (σ) as measured by the triboindenter.
Tribological and mechanical properties of the different phases in the AlCuFeSi approximant and AlCuFe quasicrystalline thin films. The separate phases are listed when it was possible to measure on them individually.

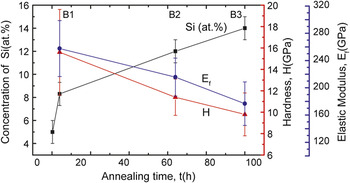
For the approximant containing samples (B), annealed at 600 °C, the hardness decreases from 15.6 to 9.8 GPa, i.e., a reduction by ∼37%, when increasing the annealing time from 4 to 100 h. The elastic modulus was seen to behave similarly with a reduction of ∼32%. Composition measurements by Rutherford backscattering spectroscopy and elastic recoil detection analysis Reference Olsson, Jensen, Garbrecht, Birch, Hultman and Eriksson20 show that the film was close to the ideal composition of the α-approximant phase after 4 h of annealing, with a Si concentration of 8.3 at.% (B1). Increasing the annealing time to 64 h (B2) allowed for more Si to diffuse into the film and a concentration of 12.0 at.% Si was obtained. Since the annealing sequence of sample B3 ended with annealing for 100 h at 600 °C, an even larger amount of Si is expected. From composition measurements on other samples, and from the known compositional range where the formation of the α-approximant phase is possible, the amount of Si in sample B3 could be estimated to be 14 ± 1 at.%. The increasing Si content in the film, and therefore also the approximant phase, versus the annealing time and the corresponding decrease in hardness and elastic modulus are shown in Fig. 4.
Si concentration and corresponding hardness and elastic modulus versus annealing time at 600 °C for the samples B1–B3, containing the α-approximant phase.

Since an aperiodic pattern of atomic arrangement lacks dislocation slip planes, an increase in hardness from these defects is not expected. However, a deviation in the Si composition to over-stoichiometric elemental ratios could lower the hardness, due to a reduction in the degree of aperiodicity in the structure. Also, the microstructure may be less rigid due to the increased roughness at the interface and possibly the formation of Kirkendall voids during the in-diffusion of Si from the substrate could explain the relatively large reduction in hardness. The increased presence of the τ7-phase with increasing amount of Si also lowers the average hardness of the film, since the τ7-phase has a lower hardness than the α-approximant phase. This can explain the hardness of sample B3, but in samples B1 and B2 the amount of τ7-phase is still low and the grains are localized. Thus, the influence of the neighboring τ7-phase grains does not sufficiently explain the difference between those samples.
In the quasicrystal samples A1 and A2, a difference in hardness and elastic modulus can be observed as well. Sample A2 has slightly higher values of both properties compared to sample A1. The differences in these samples stem from either the texturing to the 5-fold axis, the quasicrystal grain size, improved crystal quality, or from a chemical difference caused by the formation of the β-phase in sample A2. There are reports on small differences in hardness between the 2- and 10-fold axis of decagonal quasicrystal, Reference Wolf and Paufler28 corresponding to aperiodic and periodic directions, but there are no claims of differences in hardness due to the grain orientation in icosahedral quasicrystals. There are, however, reports on increasing Vickers hardness caused by chemical variations and also from increasing grain sizes and transformation to higher quality structures in quasicrystalline systems, including the Al–Cu–Fe system. Reference Giacometti, Baluc, Bonneville and Rabier13,Reference Ding, Northwood and Alpas29 A large increase in the grain size was observed between samples A1 and A2 together with the improved structure, so an increase in nanohardness should be expected. Thus, the differences are likely caused by the transition to a quasicrystal with a higher structural quality and a larger grain size.
Since this is the first time that nanomechanical and nanotribological measurements have been performed for the Ψ-phase and α-approximant phases in thin film material, comparisons can only be made at the macro level of the same phases. The microhardness and elastic modulus of bulk polycrystalline Al–Cu–Fe samples are slightly lower in earlier reports Reference Giacometti, Baluc, Bonneville and Rabier13,Reference Köster, Liu, Liebertz and Michel14,Reference Mukhopadhyay and Paufler30 when compared to sample A2, and about the same as for sample A1. The α-approximant phase has shown to be much better in terms of hardness. An earlier report on the hardness of the α-approximant phase measured 11 GPa, Reference von Stebut, Soro, Plaindoux, Dubois, Goldman, Sordelec, Thiel and Dubois31 which is in the same range of sample B2, i.e., after softening by the extended annealing. By comparing to the reference samples, all values are a factor of 2–3 higher than both the as deposited Al/Cu/Fe multilayer and the Fe substrate, except for the elastic modulus of Fe.
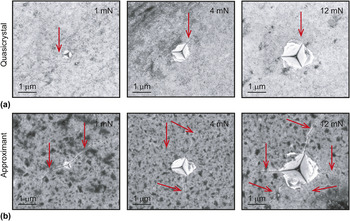
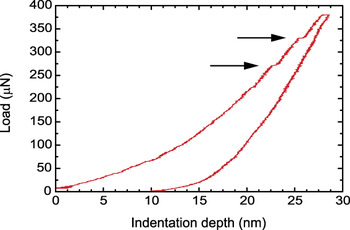
Figures 5(a) and 5(b) show SEM images of the quasicrystalline (A1) and approximant (B1) samples after indentation with increasing loads from 1 to 12 mN. For increasing indentation loads, the quasicrystalline sample exhibits material pile up around the contact impression due to the plastic flow of material during the indentation. Small cracks, marked by arrows in the figure, extend from one of the corners in each indent where the longest cracks, about 0.5 μm, are found for the 4 and 12 mN loads. It should be noted that, when pile-up occurs, the contact area is larger than predicted by the method, and both the hardness and elastic modulus are slightly overestimated. Reference Oliver and Pharr32 Figure 6 illustrates a typical loading–unloading curve versus indentation depth for sample A1 when indented to a maximum load of 380 µN. The presence of pop-ins (indicated by arrows) was observed, which can be associated to grain boundary movements or crack propagation.
SEM images of the indents after nanoindentation at various peak loads on (a) sample A1 consisting of the quasicrystalline phase and (b) sample B1 consisting of the approximant phase. Arrows point to cracks induced by the indent.

A typical load versus the indentation depth curve during the nanoindentation of sample A1. The arrows show the presence of pop-ins.

All quasicrystalline phases have been reported to have a low toughness factor, around 1 MPa/m½. In samples B1–B3 and A1, a peak load of 1 mN was required for film crack initiation, while for sample A2 a peak load of 1.5 mN was required. Neither of the reference samples experienced cracking for indentation loads up to 12 mN, which is expected since the metals have much higher indentation toughness than quasicrystalline materials.
Independent of the crack load, the quasicrystals had crack lengths of less than 1 μm in length. For sample A1 and A2, indentation toughnesses of 1.7 and 1.5 MPa/m½ were determined for crack initiation loads of 1 and 1.5 mN, respectively. These values are very close to previously reported values. Reference Köster, Liu, Liebertz and Michel14
The approximant-containing samples B1–B3 were of a different nature. They all cracked at a peak load of 1 mN with radial cracks extending to several micrometers. With increasing peak loads the cracks were seen to exceed even 50 μm for some indents. The cracks were long enough to extend into cracks from nearby indents, which stopped the crack propagation. The indentation toughness was calculated to be <0.1 MPa/m½, which is unusually low for a quasicrystalline approximant. SEM studies of these films show that cracks are present even without indentation being performed. It thus appears that rather than the α-approximant being a low toughness material, it is the film itself that exhibits a high stress, which is released during the indentation. The high residual strain of ∼5% that was evidenced in S/TEM certainly contributes to the crack formation and propagation. The solid-state diffusion between the film and the substrate to form the approximant phase may be the cause for the strain.
The nano-scale measured friction values of the samples after 50 passes are all in the range 0.10–0.15, including the untreated film A3 and the Fe substrate references (Table II). For each series, quasicrystal (samples A1 and A2) and approximant phases (samples B1–B3), the increase in friction can be correlated to the increase of sample roughness. The reference sample A3 deviates from this correlation with A1 and A2, having the lowest roughness but highest friction. It is well known that, at the micro- and nano-scale, friction depends not only on the shear interaction of the surface and the counterpart but also on the surface roughness, especially when it is measured at low loads. Reference Broitman and Flores-Ruiz33 Our results indicate that the quasicrystalline phases have lower friction since, after 50 passes, the friction can not be attributed only to the surface aluminum oxide layer as it is also present in the reference sample A3, which has an Al top layer. Our measured friction values are close to the better measurements of friction in thin films of the Ψ-Al–Cu–Fe quasicrystalline phase, which has been reported to be as low as 0.06, although measured at a macroscale using a pin-on-disk machine and a different counterpart. Reference Zhang, Dong, Brunet and Dubois15 Further experiments will be carried out to study and understand the nature of the friction and wear in our samples by using a novel microtribological method. Reference Broitman and Flores-Ruiz33
IV. CONCLUSIONS
Samples containing either the Al(Si)CuFe approximant or AlCuFe quasicrystalline phases have been prepared as thin films using magnetron sputtering. From investigations of the physical, chemical, and microstructural features separating the different samples, correlations have been made to the differences in nanotribological properties. The quasicrystalline samples, which were prepared at different annealing temperatures, allowed for a difference in structural quality as well as the crystal orientation of the grains toward the 5-fold axis. The improved quality and preferred orientation yielded higher hardness and elastic modulus values, while friction and indentation toughness remained almost equal. The nanohardness and elastic modulus of our thin films were found to be slightly higher than the microhardness of bulk material reported earlier, while friction and toughness were roughly equal to earlier reports. The approximant samples showed, within the error margin, the same hardness and elastic modulus values as the quasicrystalline samples. These values, however, decreased rapidly with the amount of Si diffusing in from the substrate. The in-diffusion of Si causes a residual strain and chemical change in the film, and it is likely that the degradation of hardness and elastic modulus is the result of a decrease in the degree of aperiodicity due to over-stoichiometry with respect to Si, and also a less rigid microstructure as the substrate reacts with the film. The friction values were about the same for the approximant samples as for the quasicrystalline samples. The indentation toughness was, on the other hand, found to be remarkably low for all approximant samples, which is assumed to be due to the high residual strain induced by the Si in-diffusion.
ACKNOWLEDGMENTS
The Knut and Alice Wallenberg Foundation is acknowledged for supporting L. Hultman, F. Eriksson, and S. Olsson, as well as our electron microscope laboratory. E. Broitman acknowledges the support from the Swedish Government Strategic Research Area Grant in Materials Science (SFO Mat-LiU) on Advanced Functional Materials.