One important application field for personality theory is forensics, in which the purpose is to detect individuals who score high or low in certain personality traits that are relevant for anti-social behavior. Personality profiling of witnesses and defendants is a common application of psychology in criminal cases. The application of personality profiling questionnaires is part of a larger evaluation process that is based mainly on interviews. For that reason, questionnaires cannot be based on large numbers of items, as is typical in personality testing. Rather, questionnaires need to be developed that can provide an individual classification on relevant psychological attributes using a limited number of items.
The present article describes the development of a questionnaire, the ENCUIST, that can be useful in a forensic context. The ENCUIST provides a binary classification of individuals on several personality traits, which determine the measurement model used to validate the questionnaire. The process of elaborating the ENCUIST consists of selecting a few items with good psychometric properties from a larger set of items to which a calibrating sample responded.
The current state of the art in the field of personality assessment maintains that personality traits are continuous variables (Haslam, Holland, & Kuppens, Reference Haslam, Holland and Kuppens2012). However, we are developing a questionnaire based on binary classification because it is useful in the particular cases of the forensic applications. Information about personality characteristics of persons participating in forensic process is usually obtained from interviews. ENCUIST will be used in this context for the interviewers to identify relevant pieces of information that help to classify individuals as high or low in the personality attributes. In the forensic context there is a need to obtain a personality profile to orient further investigations. This profile has to be obtained quickly using a check-list and the evaluation of personality by applying a long test and dichotomization of scale scores is too time-consuming.
The present investigation is part of a larger project. The work described here consists of the calibration of ENCUIST using data from the general population. We did so because the traits measured by the ENCUIST are present in both general and forensic populations. Thus the data from the general population provides relevant information about the structure of the questionnaire. Notwithstanding, this investigation shall be followed by a detailed investigation of the validity of the ENCUIST scores using smaller samples in the forensic context.
The measurement framework to validate the ENCUIST makes use of Cognitive Diagnostic Models (CDMs). CDMs are a family of measurement models that classify individuals with respect to categorical latent attributes (de la Torre, van der Ark, & Rossi, Reference de la Torre, van der Ark and Rossi2015; Sorrel et al., Reference Sorrel, Olea, Abad, de la Torre, Aguado and Lievens2016). The attributes usually are dichotomous, and the dichotomies can be interpreted as the presence or absence of the attribute. CDMs originated in the field of educational measurement and have been extended to the analysis of situational judgments (Garcia, Olea, & de la Torre, 2014; Sorrel et al., Reference Sorrel, Olea, Abad, de la Torre, Aguado and Lievens2016) and clinical data (de la Torre et al., Reference de la Torre, van der Ark and Rossi2015). In the present article we extend this approach to the development of personality profiles, represented by the patters of binary attributes.
The article is organized as follows. First, substantive aspects are discussed, including explanations of the personality traits relevant for forensic contexts and the selection of items measuring these traits from which the ENCUIST is constructed. Second, we present a brief introduction to CDMs because of the novelty of this approach to the field of personality. Third, the results of three data analyses are presented. The first analysis describes the application of factor analysis to investigate the dimensions measured by the ENCUIST. The second analysis is the application of CDM technique to estimate the personality profiles and the results of a linear regression analysis to predict exogenous variables from the profiles. The third analysis is the application of a structural equation model to compare its results with those of the CDM and to illustrate the similarities and differences between the two approaches. The article concludes with a general discussion summarizing the results and their practical implications.
Personality traits measured by the ENCUIST questionnaire
A reference personality model is needed to select the attributes that constitute the profile. The ENCUIST is based on Eysenck’s (Reference Eysenck1952) model of personality because it is a well-known consolidated taxonomy in this field. However, some modifications will be made to include some traits relevant for forensic contexts. Eysenck’s model defines three essential personality traits: Psychoticism (P), Extraversion (E), and Neuroticism (N). Eysenck established a hierarchical personality structure in which the three traits (PEN) are located at the top, and within each one are more specific factors corresponding to people’s common behavioral responses. Of the three traits of the model, E and N have received the most support and have even been retained in other personality models, such as the Big Five (Goldberg, Reference Goldberg1993), where the P trait has been least replicated in subsequent investigations (Corr, Reference Corr2010). For these reasons, we replaced the P trait with the Callous Unemotional trait or CU, which is a trait that Eysenck wished to reflect in his P dimension and is potentially more relevant in forensic contexts (Frick & White, Reference Frick and White2008). Subjects with high scores on CU have difficulties recognizing and reacting to certain emotions in others, specifically fear (Blair et al., Reference Blair, Mitchell, Peschardt, Colledge, Leonard, Shine and Perret2004), and they have serious difficulties processing facial expressions of fear or sadness. That is, they have longer reaction times for recognizing such emotional expressions, and when they say they recognize them, they commit more identification mistakes than subjects without these traits (Blair, Colledge, Murray, & Mitchell, Reference Blair, Colledge, Murray and Mitchell2001). Good processing of facial expressions is crucial for socialization and modulation of interpersonal behavior. Knowing how to identify others’ emotions allows one to act accordingly and curb behaviors that can cause interpersonal damage.
In addition to CU, we considered Expression of Anger (EA) as another important trait to take into account. Anger is a universal emotion that everyone experiences at some time, but some people feel it with excessive frequency and intensity and, for this reason it may be dysfunctional (Jasisnki et al., Reference Jasisnki, Lumley, Latsch, Schuster, Kinner and Burns2016). High levels of anger are associated with aggressive behaviors (Webster et al., Reference Webster, DeWall, Pond, Deckman, Jonason, Le and Bator2015), domestic violence (Barbour, Eckhardt, Davison, & Kassinove, Reference Barbour, Eckhardt, Davison and Kassinove1998), health problems (Smith, Glazer, Ruiz, & Gallo, Reference Smith, Glazer, Ruiz and Gallo2004), and interpersonal problems (Baron et al., Reference Baron, Smith, Butner, Nealey-Moore, Hawkins and Uchino2007). Given the close relation between anger and antisocial behavior, we think it is appropriate to introduce it into the theoretical model and relate it to Emotional Instability. That is, a person will be considered emotionally unstable if he/she has high levels of fear/anxiety (Eysenck’s original conception), high levels of anger, or the presence of both.
In summary, the traits that will be taken into account in the theoretical model to establish personality profiles are Extroversion (E), Neuroticism (N), Callous Unemotional (CU), and Expression of Anger (EA). We elaborated the ENCUIST to assess these four traits. The selected traits have been shown to be related to several personality traits in different models. We will relate the variables of the ENCUIST with the variables of Gray’s (1970) model of the biological bases of personality traits, which is the best-known alternative to the Eysenck model (Matthews & Gilliland, Reference Matthews and Gilliland1999). Gray’s model distinguishes two types of psychobiological systems: The first, the Behavioral Activation System (BAS), responds to appetitive conditioned signals (reward and non-punishment), activates approach behavior towards these types of signals or stimuli, and guides the organism towards the goals it needs to obtain. The BAS has been associated with positive moods, and its over-activation is involved in impulsivity (Meyer & Hofmann, Reference Meyer and Hofmann2005; Newman, MacCoon, Vaughn, & Sadeh Reference Newman, MacCoon, Vaughn and Sadeh2005). Regarding the model we will use herein, we expect to find a positive relation between the BAS and E. The second system, the Behavioral Inhibition System (BIS), is a system that responds to aversive conditioned stimuli, that is, to signs of punishment and non-reward, or to unfamiliar stimuli, by suppressing or inhibiting behavior. The BIS has been linked to the development of negative moods and anxiety (Newman et al., Reference Newman, MacCoon, Vaughn and Sadeh2005) and, for this reason, we expect that high scores on the BIS will be related to EA. On another hand, hypoactivity of the BIS (low BIS) is related to CU because, as mentioned, people with high scores on CU have difficulties experiencing emotions related to fear and anxiety (Heym & Lawrence, Reference Heym and Lawrence2010).
Cognitive Diagnostic Models
Cognitive diagnostic modeling is used to study the relation between underlying categorical psychological attributes and responses to questionnaire items (de la Torre, Reference de la Torre2009). The vast majority of CDM models assume binary attributes, although there are also some examples of polytomous attributes (Chen & de la Torre, Reference Chen and de la Torre2013). This paper considers only binary attributes because they are more relevant to the forensic context in which ENCUIST will be applied. The binary classification of the subject provided by the CDM is interpreted as being high or low on the personality variables.
From a statistical viewpoint, CDMs are structured latent class models that classify subjects into latent categories based on their item response patterns (Maris, Reference Maris1999). The key difference between CDMs and other popular psychometric models, such as factor analysis and item response theory, is that individuals are represented by categorical attributes in CDMs and by continuous traits in the other models.
A large number of CDMs have been described in the psychometric literature, among these we have selected the G-DINA model (Generalized Deterministic Input, Noisy and Gate) because it is a versatile model, allowing the assessment of the effect of each attribute on each item, the interactions among the attributes within the item, and the interactions between attributes in the general population of individuals (de la Torre, Reference de la Torre2011). The G-DINA model applies to dichotomous observed responses, where the response categories are labeled agree/disagree, right/wrong, etc.
The input to G-DINA is a matrix of responses and the so-called Q-matrix that represent the relation between observed items and latent attributes (Embretson, Reference Embretson1984; Tatsuoka, Reference Tatsuoka1985). The Q-matrix has order  $J \times K$, where J is the number of items and K is the number of attributes. The entries of the Q-matrix are zeros and ones. The intersection between row j and column k has the value of 1 when the attribute k is measured by the item j, and of 0 otherwise.
G-DINA represents the individual i by a profile,  ${\bf{\alpha }_i} = \left( {{{\rm{\alpha }}_{i1}},{{\rm{\alpha }}_{i2}}, \ldots ,{{\rm{\alpha }}_{iK}}} \right)$. The elements of the profile are binary values that indicate whether the subject scores high or low on each of the attributes measured by the test. In general, the number of distinct profiles for a test that measures K attributes is 2K. For example, the number of profiles for a test that measures four attributes is 24=16. The profile
 ${\bf{\alpha }_i} = \left( {0000} \right)$ indicates that the subject scores low on all four attributes, the profile
 ${\bf{\alpha }_i} = \left( {1110} \right)$ indicates that the subject scores high on the first three attributes and low on the fourth, etc. The
 ${\bf{\alpha }_i}$ profile is not directly observable and, for this reason, it is estimated from the responses to the questionnaire.
We shall examine the notation of the G-DINA model by means of the specific model that will be applied later in our empirical example. Suppose that observed responses are coded with 0 and 1, X ij denotes the response of subject i to item j and the item measures two attributes. The log-odds of the probability of a positive response is given by
 $$log{{P({X_{ij}} = 1|{{\rm{\alpha }}_i})} \over {P({X_{ij}} = 0|{{\rm{\alpha }}_i})}} = {{\rm{\delta }}_{j0}} + \,{\delta _{j1}}{{\rm{\alpha }}_{i1}} + \,\,{\delta _{j2}}{{\rm{\alpha }}_{i2}} + \,{{\rm{\delta }}_{j12}}{{\rm{\alpha }}_{i1}}{{\rm{\alpha }}_{i2}}\,,$$
where the parameter  ${\delta _{j0}}$ is the baseline and represents the log-odds of the positive response when the subject possesses neither the attributes
 ${{\alpha }_1}_{}$ nor
 ${{\alpha }_2}_{}$. Parameters
 ${\delta _{j1}}$ and
 ${\delta _{j2}}$ represent the increase in the log-odds as a result of the presence of the attribute
 ${{\alpha }_1}_{}$ or
 ${{\alpha }_2}_{}$; and parameter
 ${\delta _{j12}}$ represents the interaction of attributes within the item. This model is referred to as G-DINA with a logit link in the psychometric literature.
The second part of the G-DINA model is the probability of the profiles. Those profiles follow a categorical distribution, according to which the probability of the profile  ${\bf{\alpha }$r (where r = 1, …, 2K) is
 $$P\left( {{{\bf{\alpha }}_r}} \right) = {\pi _r}.$$
The parameters of the model in Equation (2) are the probabilities of 2K profiles: π1,..., πr,...,  ${\pi _{{2^K}}}$. Main effects and interactions between attributes are studied by fitting a log-linear model (with logit link) to the probabilities in Equation (2). More specifically, for a test that measures four attributes the probabilities in Equation (2) are computed as
 $${\rm{logit}}{\pi _r} = {\omega _0} + \sum\limits_{k = 1}^K {{\alpha _{rk}}{\omega _k}} + \sum\limits_{k = 1}^K {\sum\limits_{l = 1}^K {{\alpha _{rk}}{\alpha _{rl}}{\omega _{kl}}} } + \sum\limits_{k = 1}^K {\sum\limits_{l = 1}^K {\sum\limits_{m = 1}^K {{\alpha _{rk}}{\alpha _{rl}}{\alpha _{rm}}{\omega _{klm}}} } } + {\alpha _{rk}}{\alpha _{rl}}{\alpha _{rm}}{\alpha _{rn}}{\omega _{klmn}}$$
The parameters determine the pattern of associations among the attributes;  ${\omega _0}$ is the intercept that represents the value of the logit when all the attributes take zero value,
 ${\omega _k}$ is the main effect of the attribute
 ${\alpha _k}$,
 ${\omega _{kl}}$ is the interaction parameter between a pair of attributes,
 ${\omega _{klm}}$is the interaction among three attributes, and
 ${\omega _{klmn}}$ is the interaction between the four attributes. In the more general case, when there are interactions of any order between attributes, model (3) has
 ${2^k} - 1$ parameters. Particular cases of Equation (3) can be applied to investigate interactions between attributes. For example, the hypothesis of statistical independence between attributes is represented by a model in which all interactions are set to zero. The comparison between the fit of G-DINA model with and without interactions constitutes a statistical test of the hypothesis of independent attributes.
Empirical study
This section describes three empirical analyses aimed at developing and validating the ENCUIST for its use in personality profiling. The first empirical analysis consists of investigating the factor structure of the ENCUIST. In the second analysis, we used the CDM technique to classify the subjects in personality profiles. We also investigated the predictive validity of the dichotomous attributes in relation to two exogenous variables that are relevant in the forensic context. The third analysis consists of fitting a structural equation model (SEM) to ENCUIST to investigate the similarities and differences between CDM and SEM.
General Procedure
The three data analyses involve the use of the same empirical sample and instruments. These are described below.
Participants. The sample consisted of 516 university students, of whom 37.2% were men and 65.3% had completed postgraduate studies. The mean age was 32.8 years (SD = 11.5). Some characteristics of the sample that might be related to felonious behavior are as follows, 29.7% of the sample reported sometimes having been involved in fights, 3.1% had been incarcerated at some time, and 4.1% had a close relative who had been incarcerated. With regard to their relationships and capacity to establish links, 71.9% of the sample reported that they usually had stable couple relations (more than 2 years), and 12.2% reported that they changed friends easily. Lastly, we explored a victimological variable and found that 28.9% stated that they had suffered some kind of physical, sexual, or psychological abuse.
Instruments. As mentioned in the introduction, the ENCUIST is intended to measure the traits: E, N, CU, and EA. Additionally, we have investigated the criterion-related validity of ENCUIS scores in relation to two variables, BIS and BAS.
To assess the E and N traits, we used the 12-item E and N subscales of the five-factor Revised Neo Personality Inventory (NEO-FFI; Costa & McCrae, Reference Costa, McCrae, Boyle, Matthews and Saklofske2008). The response format rαnges from 1 (strongly disagree) to 5 (strongly agree). With regard to the E scale, some examples of items are: “I enjoy parties where there are many people” and “I like to be where the action is”. The E scale yields a Cronbach alpha of .83. Regarding the N scale, some examples of items are “I often feel inferior to others” and “Sometimes it seems that I’m not worth a thing” (Cronbach alpha of .85).
To assess the CU trait, we used the Inventory of Callous-Unemotional Traits (ICU, Roose, Bitjttebier, Decoene, Claes, & Frick, Reference Roose, Bitjttebier, Decoene, Claes and Frick2009), a 24-item self-report with 4 response options ranging from 1 (not true) to 4 (definitely true). The test is composed of three subscales: Uncaring, Callousness, and Unemotional (Cronbach alpha of .59, .67, and .86, respectively). Some examples of items are “I don’t care who I hurt as long as I get what I want” and “I don’t care if I get into trouble or problems”.
To assess the EA trait, we used anger expression and anger control of the State-Trait Anger Expression Inventory–2 (STAXI–2; Spielberger, Reference Spielberger1988). Specifically, the subscale of External expression of anger evaluates how the subject reacts when feeling furious. It is made up of 6 items with 4 response options (A: almost never, B: sometimes, C: often, and D: almost always), and it has a Cronbach alpha of .73. Some examples of items are: “I express my anger” and “I make ironic comments about others”.
The BIS/BAS test was used to study the criterion-related validity of the ENCUIST scores (Carver & White, Reference Carver and White1994). The BIS/BAS is made up of 20 items with 4 response options ranging from 1 (strongly disagree) to 4 (strongly agree). It contains two subscales: the BIS scale with 6 items and the BAS scale with 13 items (α = .74 and .77, respectively). Some examples of items are: “When I think that something unpleasant will happen, I usually feel very upset and restless” and “In comparison with my friends, I have very few fears”.
Procedure. We drew up an instrument consisting of all the items described above, 74 in total, and this was administered online by means of the Google Docs application. This application generates a link that is distributed to all study participants so that they can complete the questionnaire from their own computers. We informed the participants that their data were anonymous and confidential. All statistical analyses were run using the R language, version 3.4.1 (R Core Team, 2013).
Analysis 1: Factor structure of the ENCUIST
The computer program SPSS–22 was used to run factor analysis. First, we selected the items of the ENCUIST test with the best psychometric properties according to item-test correlation and reliability when the item was deleted. We selected the four best items for each one of the traits. The selected items for the E, N, CU and EA traits had Cronbach’s alpha coefficients of .70, .78, .87, and .71, respectively. These 16 items were then used in subsequent analyses. The BIS and the BAS scales had Cronbach’s alpha coefficients of .71 and .77, respectively.
Afterwards, we studied the factorial structure of the selected items by means of exploratory factor analysis. Given that our data are ordinal, a weighted least-squares estimation algorithm was applied following the recommendation of Flora and Curran (Reference Flora and Curran2004). The criteria suggested by Fabrigar and Wegener (Reference Fabrigar and Wegener2011) were used to determine the optimal number of factors; specifically, parallel analysis and goodness-of-fit statistics.
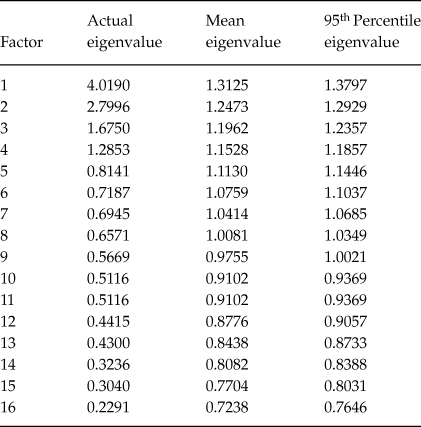
A parallel analysis (Horn, Reference Horn1965) was performed to determine the number of dimensions measured by the 16 selected items. Parallel analysis compares the eigenvalues of the observed data matrix with the eigenvalues of K simulated data matrices of the same size as the observed data. The mean and the 95th percentile of simulated eigenvalues were compared to the observed eigenvalue. As is well known, the number of retained factors is the number of observed eigenvalues that are higher than the simulated eigenvalues. The results are shown in Table 1 and indicate that four factors suffice to explain the data.
Results of Parallel Analysis for the ENCUIST

The second method we used for selecting the number of factors is the chi-square for the hypothesis of exact fit. The chi-square statistic was computed to compare fit against a saturated model (χ2) and to compare the goodness of fit of models with an increasing number of factors (∆χ2). The incremental chi-square, ∆χ2, is computed between the model with one factor and the model with two factors, then between models with two and three factors, etc. This process is repeated until a non-significant chi-square is found. Finally, we computed the close fit statistics RMSEA, CFI and SRMR. The results appear in Table 2. The chi-square indicates that at least five factors are needed to explain the data (models with more than five factors were not estimated). All in all we concluded that a model with four factors is a sufficient, although not exact, representation of the data for two reasons, the result of the parallel analysis and the measures of close fit (CFI > .95 and RMSEA < .08). Moreover, from a theoretical viewpoint the four-factor model is better grounded in the personality literature, and theoretical justification can also be considered as another indicator of the model’s goodness of fit (Reise, Widaman, & Pugh, Reference Reise, Widaman and Pugh1993).
Goodness of Fit for Factorial Models between 1 and 5 Factors for the ENCUIST

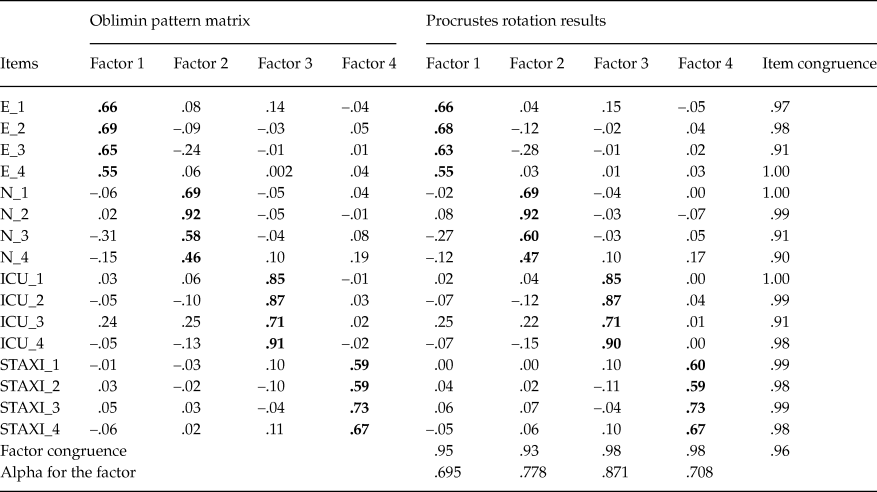
Factor loadings for the four-factor model were rotated to assist with their interpretation. Given that the factors could be related to each other, we carried out oblique rotation (oblimin direct). As seen in the left section of Table 3, the E items are grouped in the first factor, the N items in the second factor, the CU items in the third, and the EA items in the fourth factor. The correlations between the different factor pairs show the greatest relation between N and EA (r = .33), E and CU (r = .37), and E and N (r = –.30). In contrast, lower relations were found between EA and E (r = –.02), and between EA and CU (r = .07). In addition to the oblimin rotation, we carried out a Procrustes rotation, which allows modifying the factor solution so that it conforms as much as possible to a preset theoretical pattern based on the assumption that the items are one-dimensional and measure only the attribute for which they were designed. Adaptation to the theoretical pattern was measured by means of similarity coefficients. The results appear on the right side of Table 3. As shown in the column of item congruence, all the values of the congruence coefficients are above .90; indicating a good congruence between the theoretical matrix and the rotated matrix, which supports interpreting the four-factor as E, N, ICU and STAXI.
Oblimin and Procrustes Rotation for the Five-Factor Model

Note: E refers to the items of Extraversion; N, to Neuroticism; ICU, to Callous Unemotional; and STAXI, to Expression of Anger. The boldfaced values are the ones with target 1 in the Procrustes rotation.
Analysis 2: Application of Cognitive Diagnostic Models
Once the items for the ENCUIST were selected, we conducted a cognitive diagnostic analysis. The four factors of the model fitted in Analysis 1 are represented by four binary attributes in the G-DINA model. In these analyses, we investigated the relations between items and attributes, the associations among the four attributes and, finally, the linear regressions for BIS and BAS on the attributes to obtain evidence about criterion-related validity of the ENCUIST scores. To apply G-DINA the responses to the ENCUIST were dichotomized, response categories indicating any level of disagreement were assigned the code 0, and the responses indicating agreement received the code 1. The neutral category received the code 0 to equilibrate response proportions in the dichotomized data, because in our sample categories four and five are more frequent than categories one and two.
Empirical validation of the Q-matrix. The construction of the Q-matrix is typically performed by domain experts and it is to a large extent a subjective process. Recently, de la Torre and Chiu (Reference de la Torre and Chiu2016) proposed a general method for empirical validation of the Q-matrix. This method requires a provisional Q-matrix based on expert judgements, and consists of computing a discrimination index that can be used to identify and correct misspecified entries of the Q-matrix. The Q-matrix empirical validation for the present study was conducted using the Qval function of the GDINA R package (Ma & de la Torre, Reference Ma and de la Torre2018).
The provisional Q-matrix for the present analysis contains ones in the positions that correspond to the attribute that theoretically is measured by the item and zeroes in the other entries, in concordance to a simple structure.
Table 4 contains the Q-matrix suggested by the empirical validation procedure. Only five elements of the provisional Q-matrix were changed by the empirical validation procedure. The Q-matrix in Table 4 was used in all subsequent G-DINA analyses.
Q-matrix used for the G-DINA Model

Note: Boldface means that the value is zero in the theoretical Q-matrix and it is changed to 1 by the Q-validation procedure.
The goodness of fit for G-DINA models based on the provisional (theoretical) and empirically validated Q-matrix appear in Table 5, including the likelihood-ratio chi-square and distance measures. The result is that the difference between models is significant, and thus the empirically validated Q-matrix is used in the subsequent analysis.
Goodness of Fit for the Theoretical and the Empirical G-DINA Models

Note: The Q-matrix for the theoretical model represents the psychological attributed supposedly measured by the items. The empirical model uses the Q-matrix suggested by the modification index.
Results for the G-DINA model
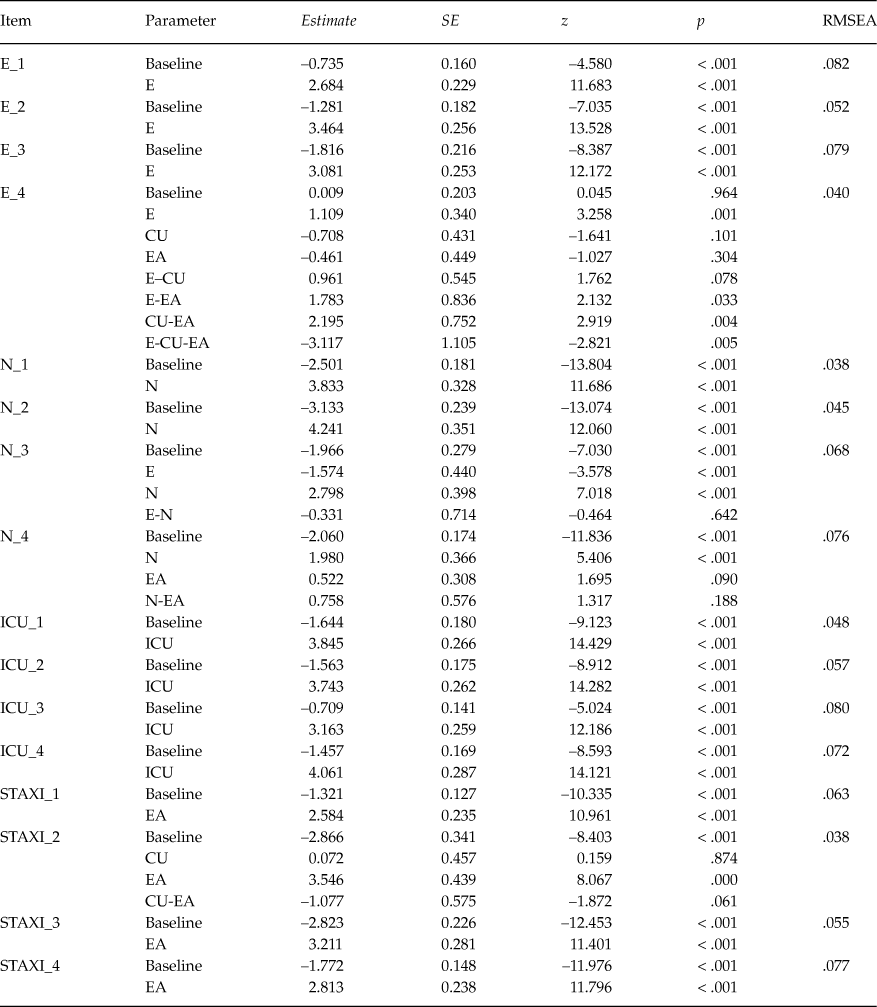
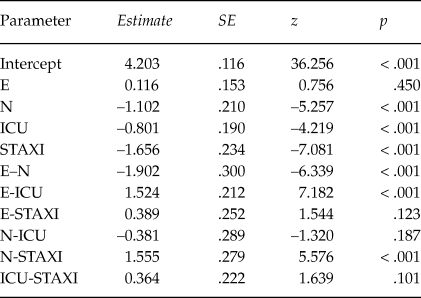
The G-DINA model based on the empirically validated Q-matrix was estimated using the CDM package (George, Robitzsch, Kiefer, Groß, & Ünlü, Reference George, Robitzsch, Kiefer, Groß and Ünlü2016; Ravand & Robizsch, Reference Ravand and Robitzsch2015; Robitzsch, Kiefer, George, & Uenlue, Reference Robitzsch, Kiefer, George and Uenlue2017). Table 6 presents the information about the estimates of Equation (1), including the values of the estimators, their standard errors, and the z statistic, which contrasts the hypothesis that the true value of the parameter is zero. As an example of the interpretation of these results, we can use item N_3. This item measures the attributes E and N, so the parameters shown in Table 6 are the baseline ( ${{\rm{\delta }}_{{\rm{j}}0}}$ in Equation 1), the weight of each attribute on the item (
 ${{\rm{\delta }}_{{\rm{j}}1}}$ and
 ${{\rm{\delta }}_{{\rm{j}}2}}$), and the interaction of the two attributes within the item (
 ${{\rm{\delta }}_{{\rm{j}}12}}$). Item N_3 has a more extreme z in attribute N, indicating that neuroticism is the dominant attribute for this item. In contrast, the z-value for the E-N interaction is not significant. In addition, in Table 6, we can observe that none of the interaction parameters between pairs of attributes are significantly different from zero.
Parameters of the GDINA Model

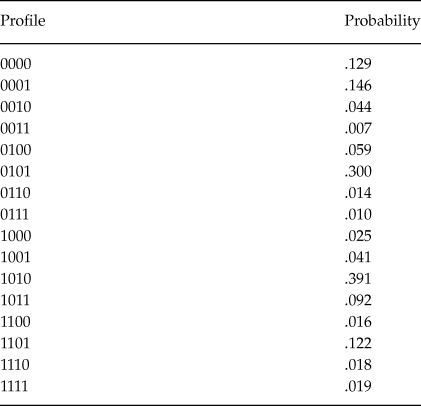
Table 7 shows the probabilities of the 16 personality profiles, that is, the possible classifications over the four dichotomous attributes. These probabilities are the parameters of Equation (2). As can be observed, the most likely profile (1010) contains subjects who claim that they are extroverts, emotionally stable, unemotional, and who do not express anger (30.1% of the sample).
Estimated Probabilities for the 16 Personality Profiles

Note: The profile is the binary classification in the E, N, ICU, and STAXI attributes.
Associations between attributes. We used tetrachoric correlations to analyze the relations between the binary values representing attributes. The tetrachoric correlations showed that scores in E are associated with N (–.39) and with CU (.51); and have hardly any relation with EA (.02). Regarding N, there is a negative relation between N and CU (–.33), and a positive relation between N and EA (.39). Finally, there is no significant relation between CU and EA (.003).
We also applied log-linear models using the glm function of R to investigate patterns of associations among the binary attributes. The chi-square is 107.91 (df = 11) for the model with no interactions and χ2 = 0.0002 (df = 5) for the model with pairwise interactions. Thus the results indicate that pairwise interactions suffice to explain the distribution of attributes. Table 8 shows the estimated log-linear parameters, ω, of Equation 3 for the model with pairwise interactions.
Results of the Log-Linear Model to the Cross-Classification of Attributes

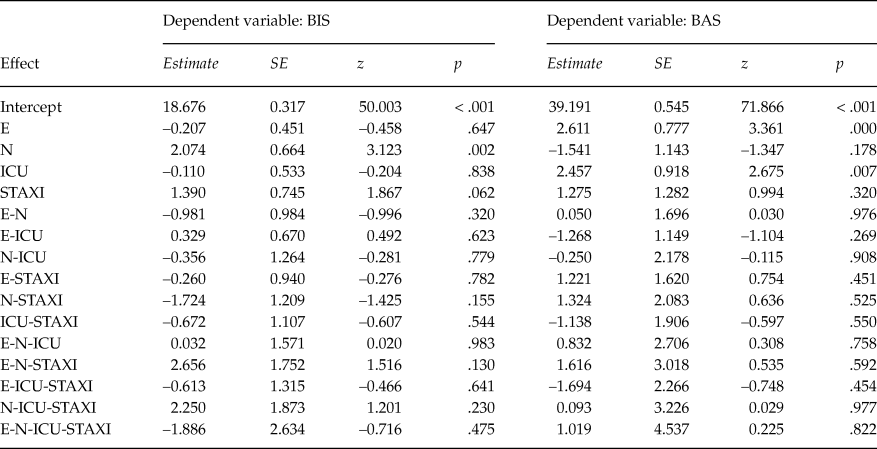
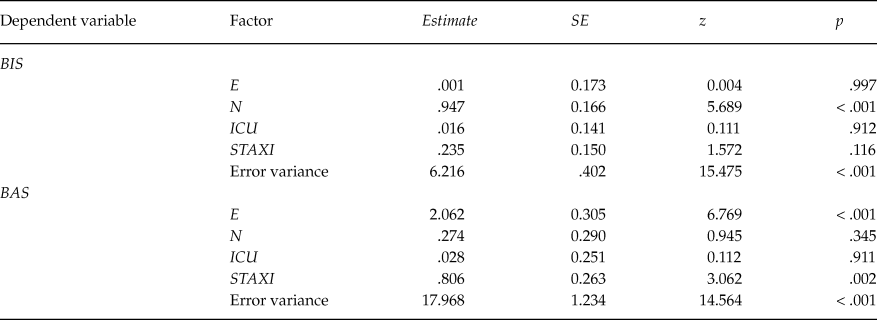
Criterion-related validity of the ENCUIST. Linear regressions were computed to provide evidence about the predictive validity of the ENCUIST taxonomies in relation to BIS and BAS. The independent variables for the linear regressions are the binary scores representing the attributes, including the interactions of any order among attributes. According to the hypothesis about the BAS, we expected to find a positive relationship between this variable and trait E, and, regarding BIS, we expected that high scores on BIS would be related to high scores on EA, whereas hypo-activity on BIS would be related to high scores on CU.
The results are significant, but there is still room for improvement. Regarding the BIS, the adjusted R 2 is .070, F 15, 500 = 3.59, p < .001. The results for the BAS are adjusted R 2 = .106, F 15, 500 = 5.07, p < .001. Table 9 shows the estimated parameters. Only some main effects of the attributes reached statistical significance; no evidence was found about the relevance of interactions between attributes in explaining BIS and BAS. The coefficients of N and STAXI on the BIS equation are significant. The significant predictors for BAS are E and ICU. These results conform to the expected relations among variables.
Linear regression of the BIS and the BAS over the attributes of the CDM and their interactions

Analysis 3: Fitting a SEM model
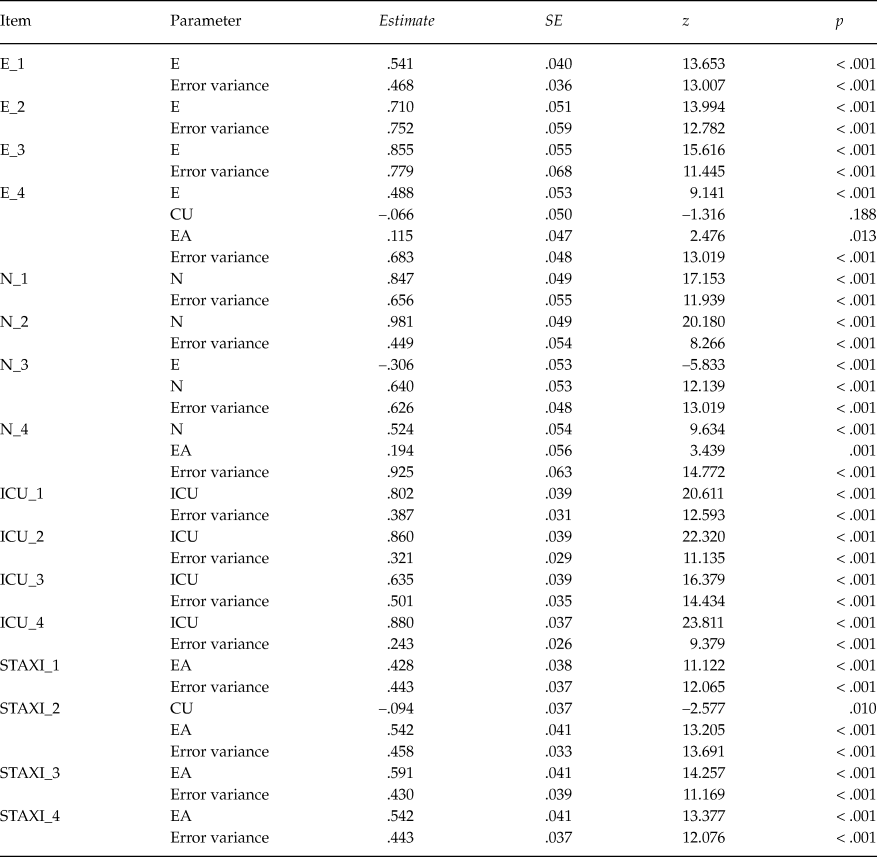
The SEM model was fitted to the ENCUIST data to illustrate the differences and similarities between SEM and CDM. The SEM model was estimated using the R package lavaan (Rosseel, Reference Rosseel2012). The four attributes, E, N, ICU, STAXI, are the factors of the SEM model; each factor is measured by the same observable variables as in the CDM. The linear regression between the criterion variables (BIS and BAS) and the factors were included in the SEM model. The SEM was estimated from the original, non-dichotomized, responses to the ENCUIST.
Table 10 contains the estimated item parameters for the SEM. Table 10 is the SEM analog of Table 6. The main difference between SEM and CDM is that the later model provides an estimate of the interactions between factors (attributes in the CDM terminology) within the items, see for example item E_4, whereas these interactions are not included in SEM.
Parameters of the Measurement Sub-Model for the SEM Model

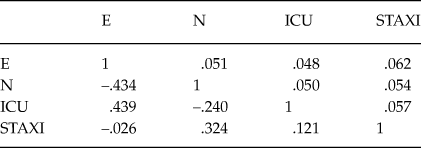
The estimated factor correlations and their standard errors appear in Table 11. This table is the SEM analog of Table 8, which contains the associations of attributes for the CDM model. The SEM approach assumes multivariate normality for the factors and thus, the only type of association between factors is linear correlation. In contrast, the CDM approach allows estimation of interactions of any order among attributes by fitting a log-linear model to the binary variables representing the scores in the attributes. In the present investigation we only found pairwise association between attributes. Thus, correlation suffices to explain the association pattern.
Factor Variances and Covariances for the SEM Model

Note: Factor correlations appear below the diagonal.
Standard errors appear above the diagonal.
Finally, Table 12 contains the regression sub-model of SEM, which consists of the linear regression between BIS and BAS over the factors measured by ENCUIST. This is the SEM analog of Table 9. The pattern of results for CDM and SEM concur with some exceptions. Similar to CDM, the BIS variable is predicted by the N factor and the BAS variable is predicted by E under SEM. However, a significant relation between ICU and BAS is found for CDM and is missing for SEM. The contrary occurs for the relation between STAXI and BAS.
Parameters of the Regression Sub-Model for the SEM Model

Discussion
Our aim was to develop and validate the ENCUIST questionnaire for personality profiling in a forensic context. The ENCUIST tests measures the traits of Extroversion (E), Neuroticism (N), Callous-Unemotional (CU) and Expression of Anger (EA) using a limited number of items. In the forensic context, the questionnaires have to be short, because a rapid initial evaluation of the subject is needed prior to more in-depth interviews. CDMs provide a means to classify individuals as high or low in relevant psychological attributes. Exploratory factor analysis was used to select the four items that best measure each of the traits, which resulted in a final questionnaire of 16 items.
The methodological tool used to elaborate personality profiles from responses to the ENCUIST is the G-DINA model, taken from the field of CDMs. The G-DINA model provides a unique profile for each subject consisting of a classification on binary personality attributes.
Linear regressions were estimated to evaluate the predictive validity of the personality profiles with respect to the BIS and BAS variables. The results support the proposed hypothesis about the relation between these variables and the attributes measured by the ENCUIST, although the effect sizes were low. The variable that best predicts BAS scores is E. The BAS underlies the dimension of impulsivity and is activated by signals of reward and is thereby related to extroverted subjects (Newman et al., Reference Newman, MacCoon, Vaughn and Sadeh2005). As expected, the variable N is the one that best predicts the BIS score. The BIS is a system that has been linked in diverse studies of anxiety and negative moods (Carver & White, Reference Carver and White1994). Given that the BIS variable has been shown to be related to emotional instability, it is consistent that it is also related to the variable EA (Lievaart et al., Reference Lievaart, van der Veen, Huijding, Naeije, Hovens and Franken2016). In contrast, we did not find any relation between low scores on the BIS and high scores on CU in the regression analysis results, but we did find a relation when analyzing the tetrachoric correlations between the different attributes. In these analyses, we obtained a negative correlation between the variables N and CU. These results indicate that emotionally stable people with low anxiety scores typically obtain higher scores on CU.
The results of the CDM were compared to a SEM model to illustrate the differences between the two approaches. In the present investigation the CDM makes more sense because the psychological attributes are to be treated as binary variables in the forensic context. The CDM gives dichotomized attribute scores based on optimizing the statistical goodness of fit to the current data, thus the binary classification of CDM is optimal in a statistical sense. On the other hand, latent trait models (i.e., factor analysis and SEM) provide factor scores along a continuous scale that would have to be dichotomized a-posteriori using arbitrary cut-points to classify individuals. The cut-point is based on the scale of the latent factor or its distribution in the population, but it is not intended to optimize a statistical fit measure.
The present paper illustrates that the CDM approach is more flexible than the SEM approach in investigating interactions of attributes within the items and the interactions between the attributes. SEM models are based on linear relations between observed variables and factors, and between factors. In consequence, associations between variables reduce to correlations. In contrast, CDM is based on binary variables and thus, log-linear models (with interactions of any order) can be used to investigate the associations between observed variables and attributes, and among the attributes themselves. In this investigation the conclusions from CDM and SEM showed similar general patterns because the triple or higher order interactions happened to be non-significant. The advantages of CDMs over SEM models should be more prominent in those applications in which there are interactions of attributes within items, in the distribution of attributes in the population of individuals, or in the regressions of criterion variables over attributes.
The present investigation is only a first step in the development of the ENCUIST that will be continued by gathering data from forensic populations. The main limitation of the present paper is the use of a convenience sample to calibrate ENCUIST. We did so because the large samples needed to apply the test-construction and statistical procedures are difficult to obtain in a forensic context. This sample is still informative because the traits measured by ENCUIST are general personality traits that are not specific for the forensic population. Notwithstanding, ENCUIST still has to be validated using data from people involved in judicial processes; including witnesses, defendants, or those prison sentences. Particularly important are data from persons who have engaged in actual criminal behavior. For example, one identifying characteristic for inclusion in such a sample would be whether an individual has ever been arrested and charged with a serious crime, and then whether or not a finding of guilt has been determined. Future research should focus on validating ENCUIT using data from forensic populations.