Introduction
Chickpea (Cicer arietinum L.) is an important cool-season grain legume crop that serves as an excellent source of protein in the diets of vegetarian people. In Asia, it is used for diversified purposes and several snacks can be prepared from it. The availability of a diverse germplasm exhibiting variability for different traits is an important resource in any crop improvement programme. There are two types of cultivated chickpea: desi and Kabuli. Kabuli-type grains are generally larger than desi types. However, lot of variation has been observed in both types, and many times, Kabuli types have grain size as small as that of desi, while desi types can also attain the larger size as that of Kabuli. It has often been considered that grain size/weight and protein content are inversely related so that larger grains have less protein content while smaller ones have more protein content (Blixt, Reference Blixt1979). This general trend has been observed in almost all grain crops. The availability of larger and broader germplasm harbouring wide variability serves as an excellent resource for identifying novel alleles through the approach of association mapping (Gupta et al., Reference Gupta, Kulwal and Jaiswal2014). In the present study, we report the wide variability observed for five important quantitative traits including seed weight and protein content, and also report the significant positive correlation between these two important traits.
Experimental details
Experimental material consisted of a diverse set of 238 chickpea genotypes comprising entries from international and exotic collections, as well as promising genotypes from the university, that represent both desi and Kabuli types (Supplementary Table S1, available online). These genotypes were raised in the farm of Mahatma Phule Agricultural University, Rahuri during 2012–13. Each accession was grown on a single row of 3 m. Approximately 30 seeds per row were sown with a spacing of 45 cm × 10 cm. The recommended package of practices for chickpea was followed to raise a good crop.
Data on five quantitative traits, namely days to flowering, plant height, days to maturity, 100-seed weight and protein content, were recorded on each genotype following the standard procedures. Crude protein content was estimated using the NIR SpectraAlyzer (ZEUTEC, Rendsburg, Germany) as described by Jadhav et al. (Reference Jadhav, Rayate, Mhase, Thudi, Chitikineni, Harer, Jadhav, Varshney and Kulwal2015).
Results and Discussion
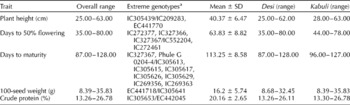
The use of a diverse set of genotypes is an excellent resource for the identification of a large number of novel alleles compared with those detected using commonly used biparental populations (Gupta et al., Reference Gupta, Kulwal and Jaiswal2014). Chickpea genotypes used in the present study exhibited wide variation for all the five quantitative traits (Table 1). For example, plant height ranged from 25 to 63 cm and exhibited spreading as well as erect growth habit. Both desi and Kabuli types exhibited almost equal range for this trait. Wide variation was also observed for days to 50% flowering as well as days to maturity. Desi types exhibited a wider range compared with Kabuli types (Table 1). Similarly, these genotypes exhibited a large variation for 100-seed weight as well as protein content. Both desi and Kabuli types comprised small as well as large seed types and seed weight varied from 8.39 to 35.83 g. Similarly, wide variation was also observed for protein content, ranging from 13.26 to 26.78%. This variation was common in desi and Kabuli types and is higher than the one reported by Singh et al. (Reference Singh, Bejiga and Malhotra1990).
Descriptive statistics of different quantitative traits in chickpea

a Genotypes with the minimum and maximum values are separated by slash (/).
Significant positive correlations were observed between plant height and the other four traits, while days to flowering and days to maturity were highly correlated (Table 2). Interestingly, a highly significant positive correlation was observed between seed weight and protein content, which is rather unusual as against the common presumption that both traits are inversely related. This also suggests that there might be common genes for both traits so that these traits can be improved simultaneously. However, additional studies are needed to confirm this. Path analysis also showed that seed weight had the highest direct effect on protein (0.22) compared with the other traits.
Correlation between different quantitative traits in chickpea

**Significant at P< 0.01.
One of the reasons for the general absence of a positive correlation between seed weight and protein content could be attributed to the fact that selection is often always made for higher yield. Moreover, lack of diversity in cultivated chickpea also indirectly contributes to this negative correlation, as only high-yielding genotypes with less protein content are frequently used in breeding programmes. Protein content in the grain is the ratio of amino acids and proteins translocated to grain and the total amount of metabolites converted to grain, whereas yield which is influenced by seed weight is the enhanced assimilation of metabolites and their transformation to yield components. Kibite and Evans (Reference Kibite and Evans1984) suggested that in wheat, this joint dependence of these two traits on the same primary characteristics for higher values justifies their negative correlation. This may also hold true in the case of chickpea.
Studies involving a larger set of genotypes for determining the correlations between these two important traits in chickpea are scarce. Using a large collection of 3267 Kabuli chickpea accessions, Singh et al. (Reference Singh, Bejiga and Malhotra1990) reported that 100-seed weight and protein content contributed to higher yield indirectly and that these two traits were significantly positively correlated with each other, while days to maturity contributed to increased protein content. However, in our study, no such correlation was found between protein content and days to maturity.
Therefore, a broader germplasm resource harbouring loci that control both yield-contributing trait (seed weight) and important nutritional parameter (protein content) is valuable in breeding programmes. This may be one of the reasons for the significant correlation observed between these two traits in the present study. Although core and mini-core collections are available in chickpea, which represent the total available diversity, they have not been studied for protein content. The genotypes exhibiting wide variation for traits such as seed weight and protein content can be used for developing biparental populations for precise identification of major QTLs governing these traits. Previously, a total of 187 genotypes from this set were successfully used by our group for the identification of marker–trait association, enabling us to identify important genomic regions containing QTLs for protein content (Jadhav et al., Reference Jadhav, Rayate, Mhase, Thudi, Chitikineni, Harer, Jadhav, Varshney and Kulwal2015). Some of these loci were also common for seed weight, which might justify the positive correlation observed between the two traits in the present study.
Supplementary material
To view supplementary material for this article, please visit http://dx.doi.org/10.1017/S147926211500060X
Acknowledgements
The authors thank Dr P. N. Harer, ex-principal scientist, for providing germplasm and Amol Jadhav and Shriram Rayate for help with phenotyping and data recording. They also thank two anonymous reviewers for their useful comments.