Introduction
Additive manufacturing (AM) technologies are now being used to produce polymer parts with a wide range of properties. Advances on stereolithography apparatus (SLA)-based three-dimensional (3D) printers, an example of vat polymerization AM technique, has allowed quick production of parts that are economical, have a smooth surface finish, and with relatively high resolution and quality. SLA can produce polymers with tunable properties from polymer blends and nanocomposites thereby producing parts and devices for applications such as biomedical and dental fields.[Reference Dizon, Espera, Chen and Advincula1, Reference Attaran2] SLA produces parts on a layer-by-layer fashion by means of photopolymerization crosslinking.[Reference Weng, Zhou, Lin, Senthil and Wu3] Photopolymerization is a type of free-radical polymerization initiated by the absorption of light (either visible or ultraviolet).[Reference Crivello and Reichmanis4] Commonly used monomers are acrylate-based resins due to the ease of forming dense 3D polymer networks upon polymerization resulting in a wide range of physical and chemical properties.[Reference Kannurpatti, Anseth and Bowman5, Reference Gojzewski, Sadej, Andrzejewska and Kokowska6]
Nanocomposites of nanoparticles (1–100 nm in size) dispersed in a polymer matrix, as exemplified by silica nanoparticles, nanoclay, graphene, carbon nanotubes, etc. creates synergistic properties to a material when properly nanostructured.[Reference Sadej-Bajerlain, Gojzewski and Andrzejewska7, Reference Palmero8] Nanocomposites, including 3D-printed parts, combine the best properties of organic polymers and inorganic nanomaterials resulting in improved thermal and mechanical properties.[Reference Sadej-Bajerlain, Gojzewski and Andrzejewska7, Reference Beun, Glorieux, Devaux, Vreven and Leloup9–Reference Liu and Mo12] This is in part, due to the high surface area-to-volume ratio surface interaction between nanofiller and polymers in nanocomposites.[Reference Gojzewski, Sadej, Andrzejewska and Kokowska6] More recently, polymer nanocomposites by SLA has been gaining attention due to improved thermo-mechanical properties.[Reference Beun, Glorieux, Devaux, Vreven and Leloup9–Reference de Leon, Chen, Palaganas, Palaganas, Manapat and Advincula11] Nano silica (SiO2) has been one of the most useful reinforcement nano materials due to its good thermal, dielectric, and mechanical characteristics.[Reference de Leon, Chen, Palaganas, Palaganas, Manapat and Advincula11, Reference Liu and Mo12] Adding modified nano SiO2 on an SLA photocurable resin, the mechanical properties, favorable glass transition temperature (T g), and thermal stability of nano SiO2 composite specimens could be improved. The flexural modulus of an SLA 3D-printed object from a resin filled with 1 and 2 wt% silica could be increased by 189% and 120%, respectively.[Reference Liu and Mo12] The tensile strength of the resin filled with 1- and 2-wt% silica was increased by 22.4% and 43.6%, respectively. However, when the amount of nano SiO2 is increased to above 3 wt%, the mechanical properties tend to decrease, indicating that improvement of properties still relies on proper dispersion and nanostructuring. The glass transition and degradation temperature are also increased when nano SiO2 is added.[Reference Liu and Mo12]
Poly (ethylene glycol) diacrylate (PEGDA) as a crosslinking and networking material is widely being used for biomedical applications such as for microfluidic devices[Reference Gojzewski, Sadej, Andrzejewska and Kokowska6, Reference Gong, Beauchamp, Perry, Woolley and Nordin13–Reference Kim, Jeong, Khademhosseini and Suh15] and hydrogels[Reference Cuchiara, Allen, Chen, Miller and West16] digital light processing (DLP) have been used to investigate the fabrication of microfluidic channels using PEGDA.[Reference Gong, Beauchamp, Perry, Woolley and Nordin13] The homogeneity of the optical dose within individual layers and the depth the critical dose penetrates into a flow channel during fabrication were important considerations. Also, micro- and nano-channels were fabricated using UV-assisted irreversible sealing to bond partially crosslinked PEG surfaces. This method can be used to form very small channels (~50 nm diameter).[Reference Kim, Jeong, Khademhosseini and Suh15] The effect of formulation parameters on the bending properties of cell-seeded PEGDA hydrogels has been reported. By varying the molecular weights and weight fractions, it was observed that the flexural stiffness of PEGDA hydrogels is comparable with native tissues.[Reference Cuchiara, Allen, Chen, Miller and West16]
SLA-printed biocompatible materials are becoming more important for biomedical applications. There is a need to better understand the thermo-mechanical characteristics of swellable biocompatible nanocomposites for medical applications. Further, understanding of the swelling characteristics as well as the mechanical properties of swollen 3D-printed parts is important. This study aims to characterize poly (ethylene glycol) diacrylate/nano SiO2—PEGDA/SiO2 nanocomposites in terms of rheology, structure, thermo-mechanical properties, swelling behavior, and morphological properties. The main objective is to understand the behavior of PEGDA/SiO2 nanocomposites with increasing nano SiO2 loading, and also the mechanical behavior changes in the swollen state. The knowledge gained will be useful in further understanding their advantages and limitations for future biomedical and microfluidic device applications.
Experimental section
Materials
The main resin component used was poly (ethylene glycol) diacrylate having an average molecular weight of 575 g/mol (PEGDA575) from Millipore Sigma (formerly Sigma Aldrich). The photoinitiator PL-TPO 2,4,6-trimethylbenzoyl-diphenylphosphine oxide having an absorption range of 230–430 nm was supplied by Esstech Inc. The hydrophilic fumed silica CAB-O-SIL EH-5 with an average particle diameter of 7 nm was purchased from Cabot Corporation.[Reference Sacca, Pedicini, Carbone and Passalacqua17, 18] This silica could increase the viscosity of liquid systems and also reinforce polymeric materials. Incorporation of this material improves the hardness, tensile strength, and elongation.[Reference Chartier, Badev, Abouliatima, Lebaudy and Lecamp19]
Preparation of PEGDA/SiO2 Nanocomposites
For the unfilled PEGDA formulation, 1 wt% of photoinitiator was added to the PEGDA resin and ultrasonicated. For the PEGDA/SiO2 nanocomposites, 1, 3 and 5 wt% SiO2 particles were added to the PEGDA and photoinitiator mixture and ultrasonicated for 30 min to disperse the nanoparticles well before printing. The PEGDA/SiO2 resin was ultrasonicated with an amplitude of 30%, pulse duration of 5 s, and pulse interval of 2 s.
The tensile and compressive test specimens were printed using a Formlabs Form 2 SLA 3D printer which has a build volume of 145 × 145 × 175 mm and a class 1, 405 nm violet laser. The printer has a power of 250 mW and laser spot size of 140 µm. Printing resolutions (layer thickness) of 25, 50, 100 µm are achievable using this printer.
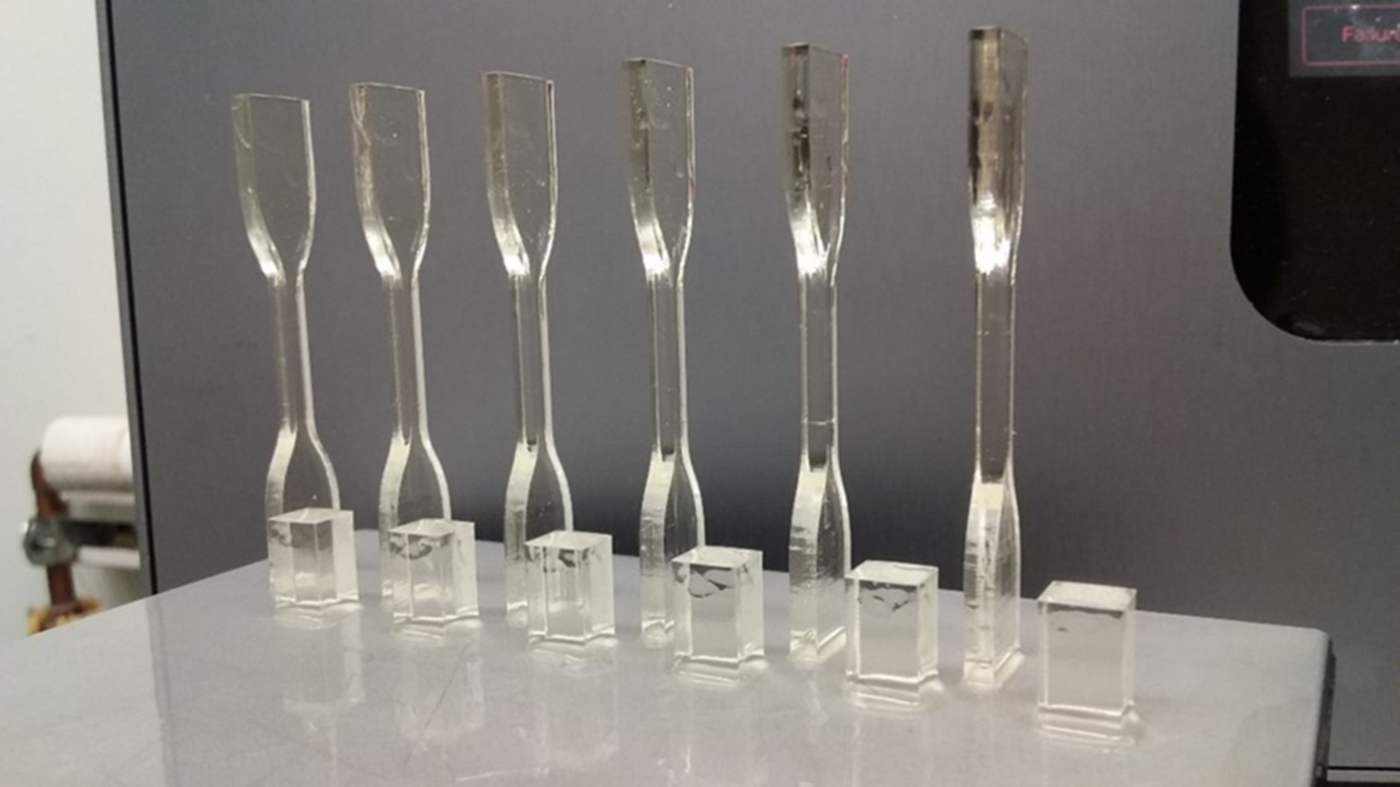
Test specimens were printed in the upright direction to avoid using supports, which may affect the homogeneity of the gauge length of the sample, especially the tensile specimens. The axis resolution used was 100 µm. After printing, the printed samples were then immersed in isopropyl alcohol (IPA) bath for 5 min, and transferred to another IPA bath for another 5 min to remove any uncured resin material (the specimens were agitated before removing from the IPA bath each time). The test specimens were then air dried. Figure 1 shows the 3D-printed specimens attached on the build plate.
Mechanical test specimens 3D-printed using Formlabs Form 2 SLA printer. Front: compression test specimens; back: tension test specimens.

Characterization methods
Rheological characterization
The viscosity of the resin was expected to increase with the addition of more SiO2 nanoparticles. This increase is due to several factors such as the surface wetting, the amount (concentration), the shape and size distribution of the particles.[Reference Chartier, Badev, Abouliatima, Lebaudy and Lecamp19] The viscosity of the photocurable resin for use in SLA printing should be low to allow good recoating between the resin tank and the printed part/build plate.[Reference Weng, Zhou, Lin, Senthil and Wu3, Reference Hinczewski, Corbel and Chartier20] It has been reported that the viscosity limit for SLA printing is 3 Pa s at 30/s or (3000 cP) and some reported values below 5 Pa s at 30/s (or 5000 cP).[Reference Crivello and Reichmanis4, Reference Wozniak, de Hazan, Graule and Kata21, Reference Wozniak, Graule, de Hazan, Kata and Lis22] Viscosity of the PEGDA/SiO2 resin formulations with increasing filler loading (0, 1, 3, 5 wt%) were measured using a Brookfield DV2 T viscometer, at various speeds (1–90 rpm where applicable), multipoint averaging with points taken every 2 s and averaged every 10 s, an end condition of 3 min, and a water bath temperature of 35 °C.
Structural characterization
Fourier transform infrared (FTIR) spectroscopy was used to confirm the functional groups in the resin before and after printing thereby understanding the formation and degree of cross-linking. A Cary 600 Series FT-IR spectrometer was used with scanning range of 400–4000/cm (Agilent Technologies). Measurements were based on attenuated total reflectance-Fourier transform infrared (ATR-FTIR) methods.
Swelling test
PEGDA is a hydrophilic and swellable material, and thus has the capacity to absorb water upon immersion. Hydrogels swell but do not dissolve in a solvent. An important parameter for hydrogels is the degree of swelling or swelling percentage which depends on the nature of solvent used, network density and polymer solvent interaction parameter.[Reference Ottenbrite, Kinam and Okano23] For each PEGDA/SiO2 loading condition, three tensile and compressive test samples were prepared for the swelling test. The samples were immersed in deionized water at room temperature (25 °C). The swollen samples were removed from water, allowed to drip on a paper towel and eventually wiped with filter paper, and then weighed. This process was repeated for each time interval. The swelling percentage of each sample was calculated as the change in weight over the initial weight of the sample using Eq. (1).[Reference Tighe24, Reference Wong, Ashton and Dodou25]
 $$\hbox{Percentage}\;\hbox{Swelling}\;{\rm (\% )} = \displaystyle{{M_t - M_0} \over {M_0}} \times {\rm \;} 100{\rm \%} $$
where M t is the weight of swollen samples at time t, and M 0 is the initial weight of the samples.
The equilibrium water content (EWC), which is the maximum amount of water absorbed by gel samples was determined by using Eq. (2).[Reference Tighe24, Reference Wong, Ashton and Dodou25]
 $$\hbox{EWC}\; (\% ) = {\rm \;} \displaystyle{{M_s - M_0} \over {M_0}} \times {\rm \;} 100{\rm \%} $$
where M s is the weight of swollen samples at equilibrium.
Tension test
An MTS universal testing machine (UTM) with a 5 kN load cell was used. ASTM D638 was adopted for the tensile tests and three samples were tested for each nano filler loading. Both ends of the samples were attached to the grip as shown in Fig. S1. The ram speed was 5 mm/min until failure. The mechanical properties obtained from the stress–strain curves of each specimen were the elastic modulus (E), ultimate tensile strength (UTS), and elongation at break. The values obtained from each specimen were compared to the other specimens to investigate the difference in the mechanical properties of samples with different filler loading, and also those of swollen samples.
Compression test
The same UTM used for the tension tests was used for the compression tests. ASTM D695 was adopted for the compression test and three samples were tested. The set-up including the sample is shown in Fig. S2. The ram speed was 2 mm/min until failure. The mechanical properties obtained from the stress–strain curves of each specimen were the compressive modulus, and break strength. The values obtained from each specimen were compared to the other specimens to investigate the difference in the mechanical properties of samples with different filler loading, and also those of swollen samples.
Tension and compression tests of swollen specimen
Tension and compression test samples were immersed in deionized water at room temperature (25 °C). The samples were removed from water after 4 days of immersion, excess water was wiped, and the dimensions were measured, and tested following the previously described procedures for the tests.
Scanning electron microscopy
Scanning electron microscopy (SEM) was used to observe the sample surfaces and fracture morphologies of the unfilled PEGDA and PEGDA/SiO2 nanocomposites. The surface of compressive test samples and the fracture morphologies of samples after tension tests were observed. Samples were coated with 15 nm thick palladium powders using a Hummer 6.2 Sputter System from Anatech USA. SEM micrographs were taken using a JEOL scanning electron microscope (JEOL-JSM-6510LV) with an acceleration voltage of 15 kV and a working distance of 11–15 mm.
Thermogravimetric analysis
Thermogravimetric analysis (TGA) measures the changes in the physical and chemical properties of materials upon degradation with increasing temperature. It is also commonly used to measure the percent weight loss indicating percentage composition as well as understand the thermal stability of the material.[26] TGA was carried out using TGA 2050 V5.4A from TA Instruments. The platinum pan for TGA was cleaned using cotton/acetone and then torched. A small sample of the PEGDA/SiO2 nanocomposite ranging from 5 to 10 mg was prepared for the test. In a nitrogen atmosphere, the amount and rate of change in the mass of the PEGDA/SiO2 nanocomposite were measured as a function of temperature at a ramp rate of 10 °C/min up to a maximum temperature of 600 °C. Nitrogen was purged at rates of 70 and 30 mL/min.
Results and discussion
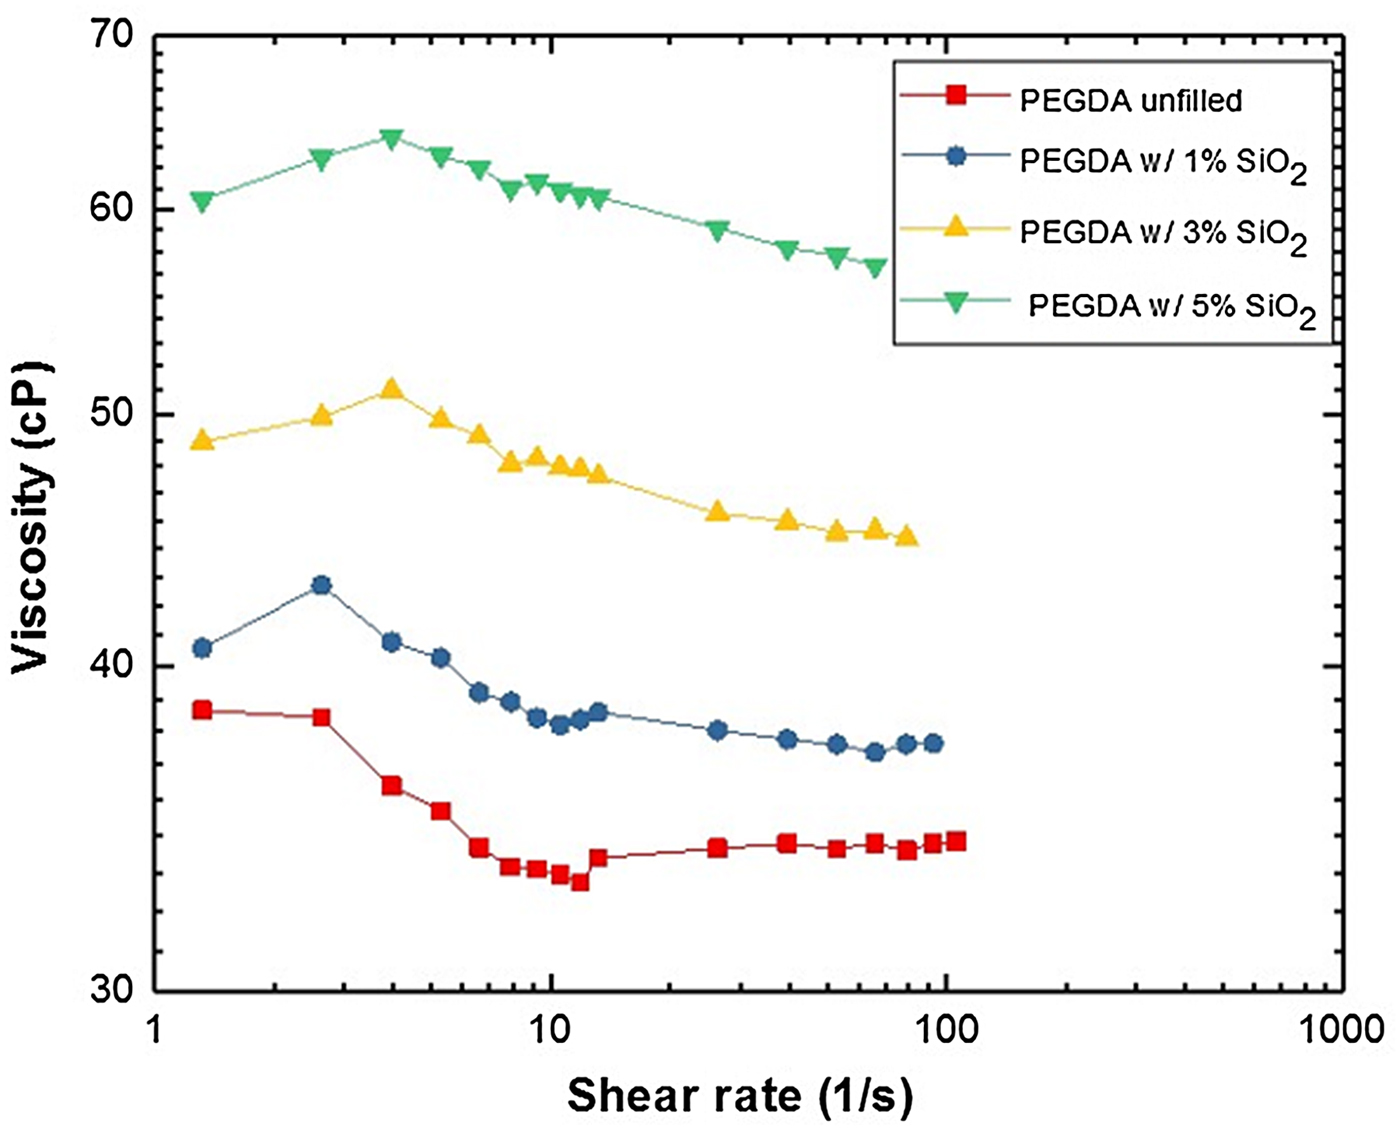
The viscosities of resins with different amounts of SiO2 (i.e. 0, 1, 3 and 5 wt%) loading were measured. Figure 2 shows the viscosity of the resin with different SiO2 loading. The viscosity values of the resins are well below the maximum limit, and that the viscosity increases as the amount of nanofiller increased. Also, for all samples, it can be observed that there is no significant variation in the viscosity trend with increasing shear rate, and the behavior of the PEGDA/SiO2 resins are nearly similar with the unfilled PEGDA resin. The value for the unfilled resin (i.e., PEGDA Mn:575) is ~38 cP which is close to the value published by the supplier of 57 cP.[27] The small difference could be due to the difference in temperature, i.e., 35 °C for this paper, and 25 °C for the information provided by the supplier. As it is generally known, the viscosity of liquids decreases with increase in temperature.[Reference Cornelissen and Waterman28] Since the viscosity of all the formulations is just ~65 cP, which is much lower than the viscosity limit set for SLA utilization[Reference Crivello and Reichmanis4, Reference Wozniak, de Hazan, Graule and Kata21, Reference Wozniak, Graule, de Hazan, Kata and Lis22], then all formulations prepared (i.e. SiO2 loading) may possibly be printed.
Viscosity of unfilled PEGDA resin, and PEGDA/SiO2 resins with different SiO2 concentrations.

The FTIR spectra of the unfilled PEGDA, SiO2 and PEGDA/SiO2 nanocomposites are shown in Fig. S3. The FTIR analysis of the unfilled PEGDA and PEGDA/SiO2 nanocomposites were differentiated. The presence of functional groups such as O–H stretching (~3496/cm), C–H stretching (~2867/cm), and CO stretching (~1728/cm). Further, the spectra show the peak for the unfilled PEGDA at ~512/cm, ~465/cm for the SiO2, and for the PEGDA/SiO2 nanocomposite with 5 wt% SiO2, a peak at ~463/cm can be observed. SiOH bending in the SiO2 powder could be observed at ~960/cm as well.
The effect of the concentration of SiO2 nanoparticle on the swelling characteristics of PEGDA was evaluated and is illustrated in Fig. 3. Figure 3(a) shows the swelling behavior for the tension test specimen, while Fig. 3(b) shows the compression test specimen. The swelling percentage is an important parameter for analysis of swelling behavior.[26, Reference Horkay and Zrinyi29] The swelling percentage of PEGDA/SiO2 nanocomposites with varying SiO2 concentrations increased with time and reached equilibrium (~32 wt%) after 3 days for the tensile test specimen, and 4 days for the compression test specimens. The EWC, or the maximum amount of water absorbed by gel samples is up to ~32%. The compression test samples took a longer time to reach maximum swelling compared with the tension test specimen due to its larger thickness. Also, it was found that higher filler loadings (i.e., 3 and 5 wt%) resulted in slightly lower swelling percentage probably due to the reduction of the swellable PEGDA material with respect to the nanofiller or more crosslinking facilitated by the nanoparticle.
Effect of SiO2 concentration on the swelling percentage of PEGDA/SiO2 nanocomposites, (a) tension test specimen, and (b) compression test specimen.

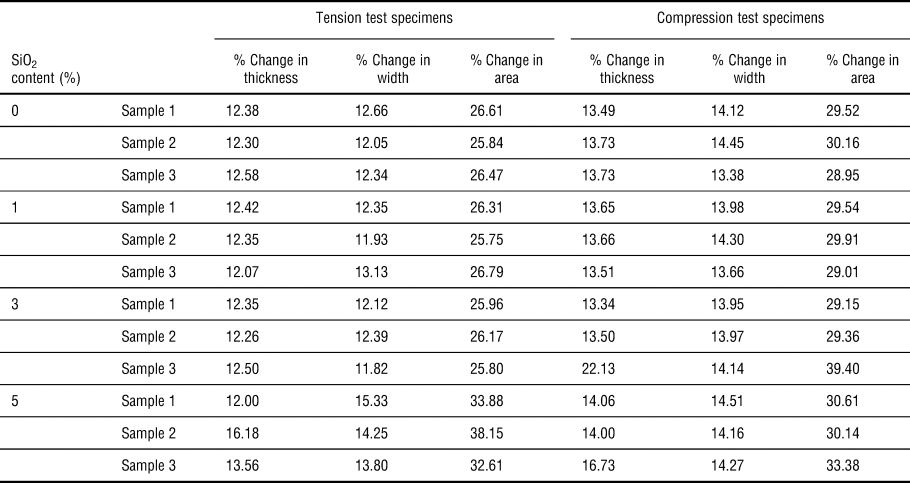
Table I shows the dimensional changes in swollen specimens after 4 days of immersion in deionized water. For both tension test and compression test specimens, there is a 25%–40% increase in the areas of the swollen samples. This is important to take note especially considering that mechanical tests will be correlated with the swollen state and in calculating the strength values.
Dimensional change in swollen specimen.

Representative tensile stress–strain curves of the PEGDA/SiO2 nanocomposites are shown in Fig. 4(a). Here, the data showing the maximum tensile strength are plotted. It can be observed that Young's modulus of the PEGDA/SiO2 nanocomposites increases with increasing nano SiO2 content, which could be due to the high stiffness of the nano SiO2.[Reference Liu and Mo12] This is similar with previous reports.[Reference Palmero8] The PEGDA material, generally, has very low strain at break.
(a) Representative tensile stress versus strain curve of PEGDA/SiO2 nanocomposites; (b) tensile strength versus % SiO2 of unswollen and swollen samples; (c) average Young's modulus of swollen PEGDA/SiO2 nanocomposites; (d) strain at break of swollen PEGDA/SiO2 nanocomposites; (e) average compressive strength of swollen PEGDA/SiO2 nanocomposites; (f) compressive modulus of swollen PEGDA/SiO2 nanocomposites.

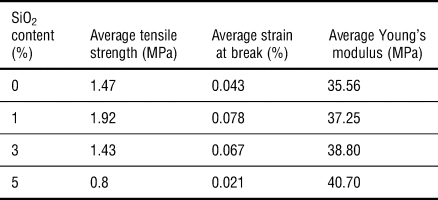
Table II summarizes the tensile characteristics of PEGDA/SiO2 nanocomposites. The PEGDA/SiO2 nanocomposites showed the best improvement in tensile strength with the addition of 1% SiO2 (~30% increase). Adding 3% and 5% SiO2 actually degraded the tensile strength of the composite. This is similar with the observations reported by Liu et al., wherein the tensile strength of the resin filled with 1 wt% and 2 wt% silica increased by 22.4% and 43.6%, respectively. However, when the amount of nano SiO2 was increased to above 3 wt%, the mechanical properties decreased, and was observed to be lower than the unfilled resin.[Reference Liu and Mo12] The average strain at break has a similar behavior with the average tensile strength, while average Young's modulus increased with the increase in SiO2 loading.
Tensile characteristics of PEGDA/SiO2 nanocomposites.

The tensile strength of swollen PEGDA/SiO2 nanocomposites is plotted in Fig. 4(b). Using the original area measured, all the swollen samples showed much higher average tensile strength compared with the samples that did not undergo swelling. When the swollen area has been used to compute for the strength, the average tensile strengths for all samples are above or similar to the strength of the un-swollen samples except for the unfilled sample. These results demonstrate that the PEGDA/SiO2 nanocomposites retain its strength even when water has diffused into it. The strength values using the original area was used in order to understand the effect of swelling and compare with the results from other research groups.[Reference Oka, Sakohara, Gotoh and Iizawa30]
Figure 4(c) shows the average Young's modulus of swollen PEGDA/SiO2 nanocomposites. All the swollen samples showed higher average Young's modulus values compared with the samples that did not undergo swelling. The addition of the nano SiO2 increased the contribution of the strengthening particles and reduced that of the more ductile PEGDA resin, thereby increasing the stiffness of the PEGDA/SiO2 nanocomposite.
Figure 4(d) shows the elongation at break of swollen PEGDA/SiO2 nanocomposites. Except for the unfilled sample, the average elongation at break of all samples showed higher or similar values as compared with the unswollen samples. Again, the addition of nano SiO2 increased the amount of brittle ceramic particles and reduced that of the more ductile PEGDA resin, thereby decreasing the flexibility and elongation at break of the PEGDA/SiO2 nanocomposite.
Figure 4(e) shows the compressive strength of swollen PEGDA/SiO2 nanocomposites. Using the original area measured, all the swollen samples showed similar average compressive strength compared with the samples that did not undergo swelling. When the swollen area has been used to compute for the strength, the average compressive strength is a little bit lower than the strength of the un-swollen samples (<30% decrease). These results demonstrate that the PEGDA/SiO2 nanocomposites could retain up to 70% its strength even when water has diffused into the gel, demonstrating the importance of the crosslinked connectivity.
Figure 4(f) shows the compressive modulus of swollen PEGDA/SiO2 nanocomposites. All the swollen samples showed lower average compressive modulus compared with the samples that did not undergo swelling. These results demonstrate that the compressive modulus of PEGDA/SiO2 nanocomposites, in the same way with the compressive strength, in general decreases after being immersed in water.
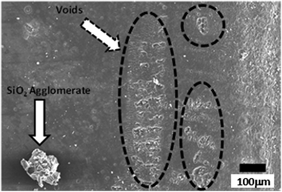
Typical SEM micrographs of crack morphologies of unfilled PEGDA and PEGDA/SiO2 nanocomposites are shown in Figs. 5(a) and 5(b). Figure 5(a) shows the cracks found for the unfilled PEGDA sample, and Fig. 5(b) shows the crack morphology for the PEGDA/SiO2 nanocomposite with 1 wt% SiO2 loading showing also SiO2 agglomeration (bottom part).
SEM micrographs of fracture surfaces of unfilled PEGDA and PEGDA/SiO2 nanocomposites after tensile tests. (a) Unfilled PEGDA; (b) 1% SiO2 loading; SEM micrographs of top surfaces of PEGDA/SiO2 nanocomposites after tensile tests. (c) 3% SiO2 loading; (d) 5% SiO2 loading, (e) TGA of unfilled PEGDA and PEGDA/SiO2 nanocomposites.

Figures 5(c) and 5(d) show the top surface of the compression test specimen after 3D printing for the 1- and 3-wt% SiO2, respectively. With the addition of more SiO2 particles, agglomerates could be found. As demonstrated in Fig. 5(d), agglomerate sizes could reach to as large as ~200 µm in diameter, which could result in the following: stress concentration along PEGDA-SiO2 interfaces; scattering of UV light; and creation of cavities left by SiO2 particles which may have been easily removed by IPA washing [a possible reason for the voids seen in Fig. 5(d)]. Figure 5(c) also shows the side of the compression test specimens demonstrating the inherent rough surface brought about by the layered manner of producing the part. Some voids, which appear to be cracks, could also be observed in many parts of the surface.
Figure 5(e) shows the TGA results for the PEGDA/SiO2 nanocomposites. In particular, the weight-loss values of the nanocomposites with increasing temperature could be obtained. The experimental data also showed that PEGDA with 1 wt% silica has similar stability and heat resistance with the unfilled PEGDA resin. Table S1 titled “Temperature Values for 10% and 90% Weight Loss” has been added in the Supplemental data. In the second column of the table, the temperature values for each condition where the 10% of the weight has been lost can be found. In the third column, the temperature values for each condition where the 90% of the weight has been lost is also listed. Both these two columns show a trend, wherein the temperature values increased as we increased the nano SiO2 content. Also, the onset temperature of the sharp weight loss of PEGDA/SiO2 are higher than the unfilled PEGDA resin, especially those with 5 wt% SiO2 content, demonstrating its superior thermal stability than the other formulations. This is due to its higher SiO2 content, wherein the thermal properties of the SiO2 contribute more to the overall thermal stability of the nanocomposite. This could be due to several reasons such as the possibility of more chemical cross-linking sites between SiO2 and PEGDA itself.[Reference Liu and Mo12] Additionally, rapid mass loss of all samples could be observed from 300 °C to 450 °C for the unfilled PEGDA, and PEGDA/SiO2 nanocomposites with 1 and 3 wt%, while it was between 380 °C to 475 °C for the PEGDA/SiO2 nanocomposite with 5 wt%.
Regarding the char yield/residual mass after the TGA up to 600 °C, Fig. 5(e) also shows that there are large scattering of data for both the 0 wt% and 1 wt% silica conditions. While for the 3 wt% and 5 wt% SiO2 conditions, smaller variations can be observed. With these results, the 3d printing process demonstrated some inhomogeneous distribution of nano SiO2 particles after printing as supported by nano SiO2 agglomerations seen from SEM investigations [shown in Figs. 5(c) and 5(d)]. This could be an inherent issue with this printing technique, and further investigations are needed to elucidate these results when using the SLA process for producing nanocomposites.
Summary and conclusions
The thermo-mechanical and swelling properties of 3D-printed PEGDA/SiO2 nanocomposites with varying SiO2 loadings have been evaluated. Adding SiO2 content could increase the tensile and compression strengths of 3D-printed PEGDA. The loading that gave the highest strength is 1 wt%. Increasing the nano SiO2 in general increases the stiffness of the nanocomposite. The rate of swelling varies depending on the thickness of the part. The tensile and compressive strengths of swollen PEGDA/SiO2 nanocomposite specimens were generally higher than the unswollen specimens. Crack morphologies using SEM have been correlated with the damage mechanism and the measured mechanical properties. TGA confirmed the importance of structuring (preventing agglomeration) in improving composite performance. Adding SiO2 content could improve the thermal stability of the PEGDA/SiO2 nanocomposites. However, some scattering of mass values could be observed after the TGA test for the different loading conditions, this is a further confirmation of the inhomogeneous distribution of the silica particles due to agglomeration, especially with higher loading percentages.
Supplementary material
The supplementary material for this article can be found at https://doi.org/10.1557/mrc.2018.188
Acknowledgments
This work is supported by the Department of Science and Technology — Philippine Council for Industry, Energy, and Emerging Technology Research and Development (DOST-PCIEERD) and PETRO Case and the Honeywell-KCNSC Polymer 3D printing consortium (Dr. Jamie Messman and Dr. Dan Bowen).